4659
Investigating the use of arterial spin labeling perfusion as a substitute to DCE-MRI in primary tumor perfusion of nasopharyngeal carcinoma1Cancer Hospital, Chinese Academy of Medical Sciences, Beijing, People's Republic of China, 2GE Healthcare MR research China, Beijing
Synopsis
Assessment of perfusion is important in tumor diagnosis, stage and therapeutic effect evaluation. This study aimed to investigate the relationship between arterial spin labeling (ASL) (with PLD=1.0, 1.5 and 2.0s) and DCE-MRI parameters of nasopharyngeal carcinoma (NPC). Two observers measured the tumor blood flow (TBF) by ASL and DCE derived parameters including MaxSlop, CER, IAUGC, Ktrans, Kep and Ve. TBF showed moderate to strong correlations between all three TBF and DCE-MRI parameters except between all TBF with Ve and between TBF of PLD1.5s and CER. ASL is a feasible non-invasive tool in NPC to quantitatively assess the perfusion.
Purpose
Nasopharyngeal carcinoma (NPC) is a type of malignant head and neck tumor, its diagnosis, stage and therapeutic effect evaluation have heavy reliance on the assessment of blood perfusion [1,2]. The value of DCE-MRI on the evaluation of the tumor perfusion has been well recognized, however, its need of intravenous contrast media would be bound to bring the risk of allergy and nephrogenic systemic fibrosis (NSF). On the other hand, arterial spin labeling (ASL) perfusion is a non-invasive and non-contrast enhanced technique to quantitatively measure tissue perfusion by using blood as an endogenous tracer. This study is aimed to compare the blood perfusion assessed by ASL and the perfusion parameters derived from DCE-MRI on NPC, as well as optimizing the choice of PLD selection in ASL.Method
44 patients with untreated NPC confirmed by pathology received MRI before nasopharyngoscope biopsy and treatment. MR scans were performed on a 3.0T whole body scanner (GE Discovery 750) equipped with an 8-chanel head and neck coil. Consent forms were obtained prior to the scans. Enhanced T1, fat suppressed T2 weighted and ASL were performed with matching spatial coverage. In ASL, three post labeling delays (PLD) of 1.0s, 1.5s and 2.0s were used. All the measurements were performed using the vendor supplied softwares on the Advantage Workstation (ADW 4.6 version, GE, US), and ROIs were delineated using the last phase on DCE-MRI as the reference. The tumor blood flow (TBF) measured by ASL with three post-labeling delay times (1.0, 1.5 and 2.0 sec) and the DCE derived parameters including MaxSlop, CER, IAUGC, Ktrans, Kep and Ve were measured by two observers and compared by Spearman's correlation coefficient. Inter-observer consistencies of the obtained measurements were also assessed.Results
The TBF measured by ASL and perfusion parameters of DCE-MRI are shown in Fig1 and good consistency were found between the two observers (ICC = 0.937-0.997; with narrow 95 % confidence interval). A higher mean value of TBF was also observed an increasing PLD (75.53±34.10 mL/min/100 g, 81.18±35.31 mL/min/100 g and 84.66±35.53 mL/min/100 g with PLD = 1.0s, 1.5s and 2.0s respectively). The correlation coefficients are shown in Fig2. It is seen that TBF of ASL showed moderate correlation with quantitative parameters derived from DCE-MRI: Ktrans (r=0.664-0.720), Kep (r=0.623-0.675); and mild correlation with semi-quantitative parameters: MaxSlop (r=0.338-0.386), IAUGC (r=0.346-0.407), and CER (r=0.309, 0.345).Discussion and conclusion
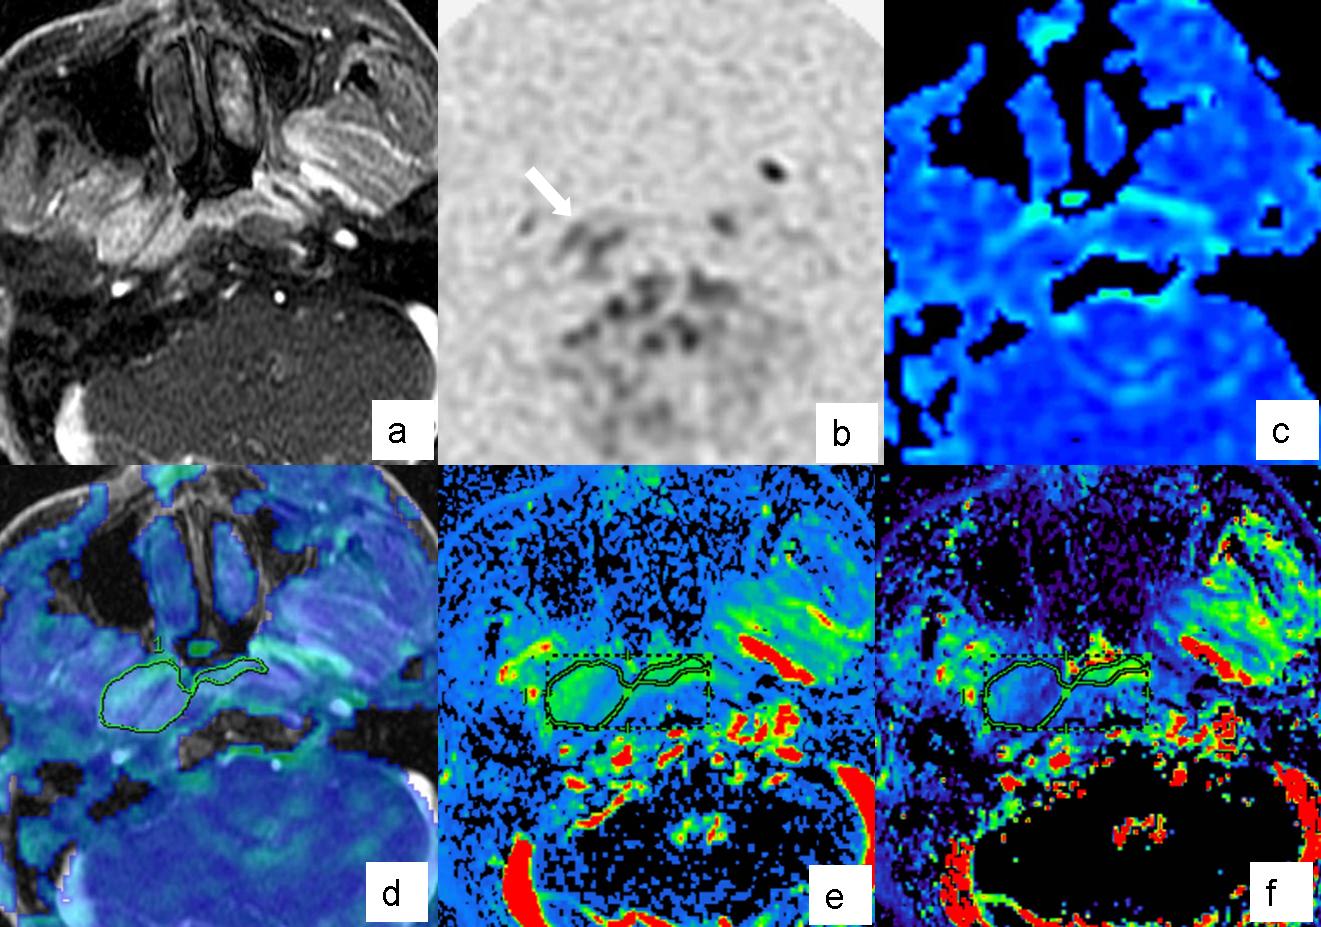
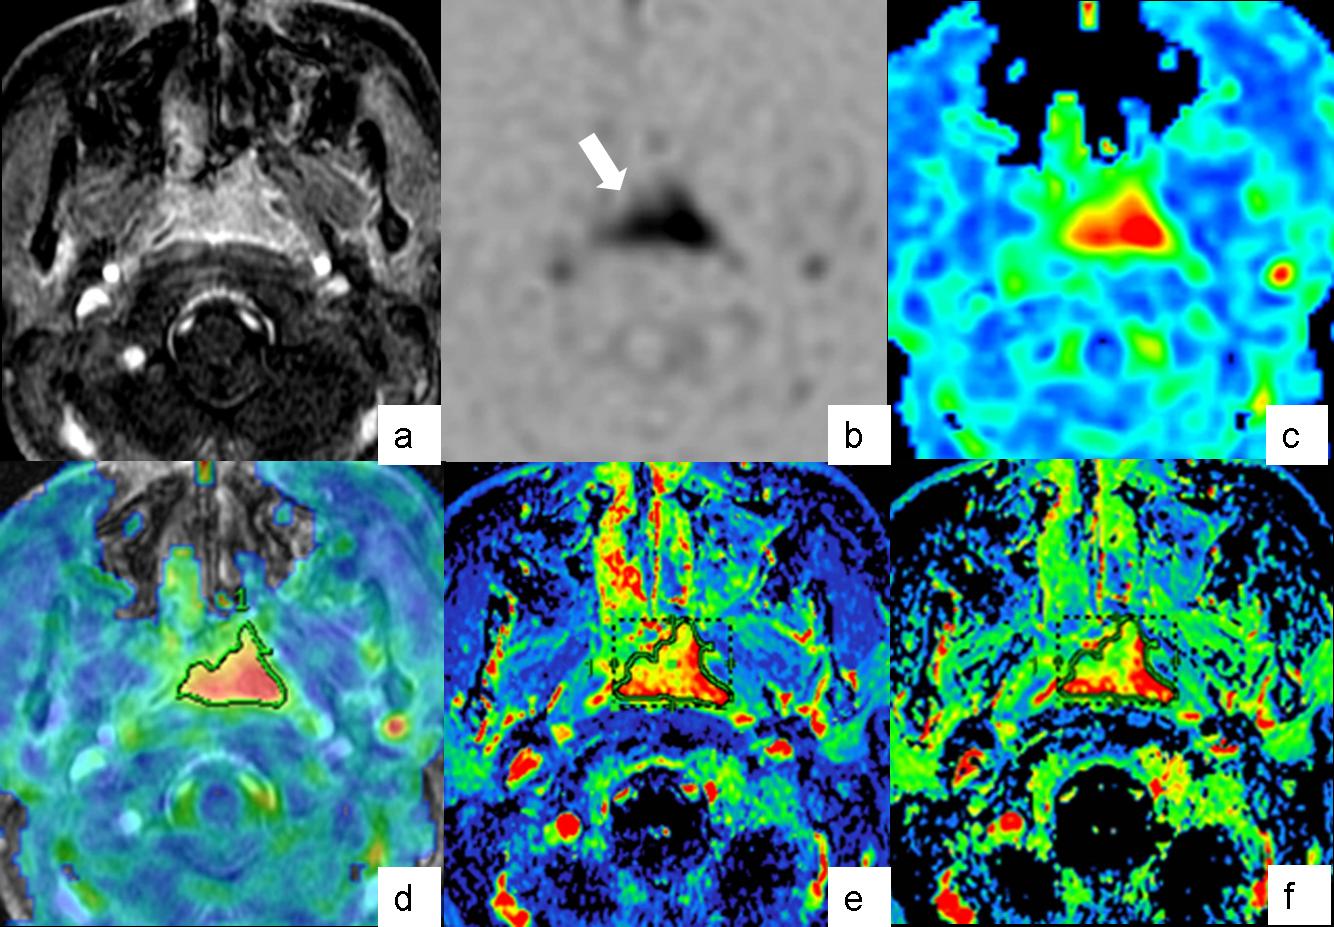
A typical case of NPC showing low perfusion and high perfusion levels are shown in Fig.1 and Fig.2 respectively. The blood flow of tumor and permeability surface of capillary are the dominant factors for Ktrans [3], also as supported by this study that the TBF measured by ASL showed positive correlation to Ktrans. On the other hand, Kep, was generally to be considered to closely correlate to the permeability of the tissue [4]. In this study, moderate correlation was also observed between Kep and TBF from ASL, which indicated that blood flow also had a great impact on Kep in NPC. Only mild correlation was observed between TBF and semi-quantitative parameters of DCE-MRI, which might be due to the perturbing factors in the derivations of the semi-quantitative parameters. In this study, it was observed that most significant correlation between TBF and the parameters of DCE-MRI was obtained with a PLD of 1.0s, which indicates that a relatively short post labeling delay might feature the best performance. As demonstrated by this study, ASL based perfusion, with a suitable choice of PLD, has high potential to be alternative for DCE-MRI in the assessment of the perfusion of NPC.Acknowledgements
No acknowledgement found.References
[1] Liao XB, Mao YP, Liu LZ, et al. How does magnetic resonance imaging influence staging according to AJCC staging system for nasopharyngeal carcinoma compared with computed tomography? Int J Radiat Oncol Biol Phys 2008;72:1368-77.
[2] Zheng D, Chen Y, Liu X, et al. Early response to chemoradiotherapy for nasopharyngeal carcinoma treatment: Value of dynamic contrast-enhanced 3.0 T MRI. J Magn Reson Imaging 2015;41:1528-40.
[3] Jesberger JA, Rafie N, Duerk JL, et al. Model-free parameters from dynamic contrast-enhanced-MRI: sensitivity to EES volume fraction and bolus timing. J Magn Reson Imaging 2006;24:586-94.
[4] Tofts PS, Brix G, Buckley DL, et al. Estimating kinetic parameters from dynamic contrast-enhanced T(1)-weighted MRI of a diffusable tracer: standardized quantities and symbols. J Magn Reson Imaging 1999;10:223-32.
Figures
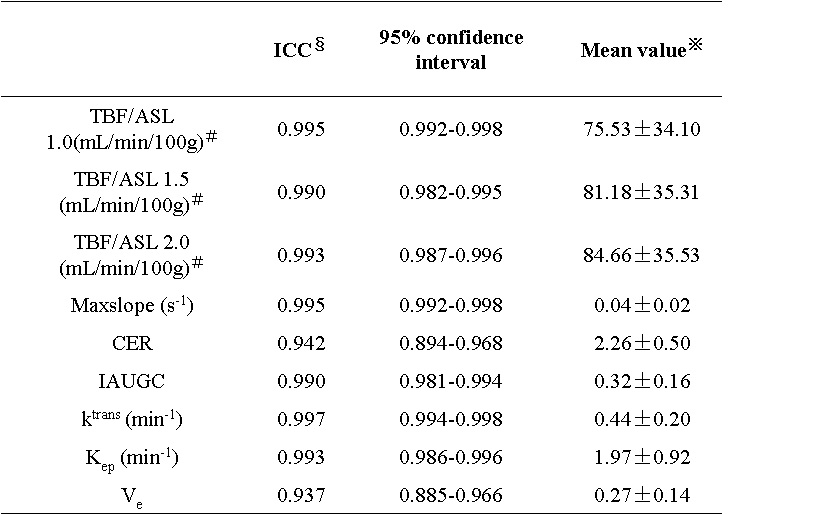
Consistency inter-observers
§ICC is the abbreviation of Intra-class correlation.
※Mean value is the average of measurements by the two observers.
﹟TBF/ASL 1.0, TBF/ASL 1.5 and TBF/ASL 2.0 represent the TBF of ASL at PLD 1.0msec, 1.5msec and 2.0msec respectively.
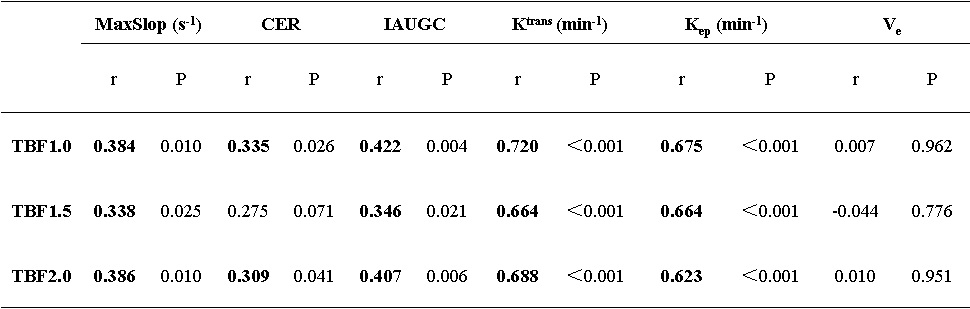
Correlation between parameters of ASL and DCE-MRI