4657
In Vivo Study of the Human Ear Canal Using Contrast-Enhanced MRI1Computer Science, University of Copenhagen, Copenhagen, Denmark, 2Brüel & Kjaer, Denmark
Synopsis
We present the first MRI-based study of the anatomy of the human outer ear. We show that on 45 subjects we can accurately retrieve the anatomy of this outer cavity using a focussing coil, a T2-weighted sequence and vegetable oil. As validation, we show that from the retrieved anatomies of the population we can, using standard methodology, compute an average ear canal that has distinct anatomical landmarks as well as the acoustical properties, which are almost identical to that of a real ear-canal anatomy.
Purpose
The shape of the human ear acts as a preprocessing unit of the auditory input and is an important part of the auditory processing system. However, the shape of the deep part of the canal (from the second bend through the bony part to the tympanic membrane) is relatively unexplored . It has only been studied on cadavers with only very few in vivo samples due to the proximity of the facial nerves to the ear canal, which cause a high degree of sensitivity to the deep part of the canal. This makes standard impression techniques a very painful method for acquiring anatomical information about the deep part of the ear canal. It is desirable to gain insight into the shape of the deep part of the canal in order to be able to model the acoustical properties of the canal accurately. In order to extract the shape of the outer ear we propose to use a T2-sequence combined with a focussing coil and vegetable oil to enhance contrast and minimize susceptibility artefacts. From the images we extract the surface of the canal and construct an average ear canal from a point distribution model generated using non-rigid surface registration. We compare the anatomical landmarks and acoustical properties of the constructed average ear-canal to that of a real ear.Methods
Using a Siemens Avanto 1.5T scanner in combination with a focus sing coil, we obtained 45 contrast enhanced T2-weighted MRI axial scans with a resolution of 0.22 x0.22 mm and a slice thickness of 0.5 mm of the human ear canal. In order to minimize susceptibility artefacts and contrast enhance the geometry of the ear canal cavity, each subject was placed on the side, and the canal was filled with vegetable oil. The ear canal was then segmented manually, and the surface extracted using marching cubes. The surfaces were registered iteratively to a mean1 and a standard point distribution model was created2. From the co-registered surfaces, a standard shape model without size normalization was created3 and the mean was computed. Using the euclidean distance, the closest canal was identified. Using the measured acoustical impedance of the closest real ear-canal, the frequency response for both the closest canal and the mean was computed.Results
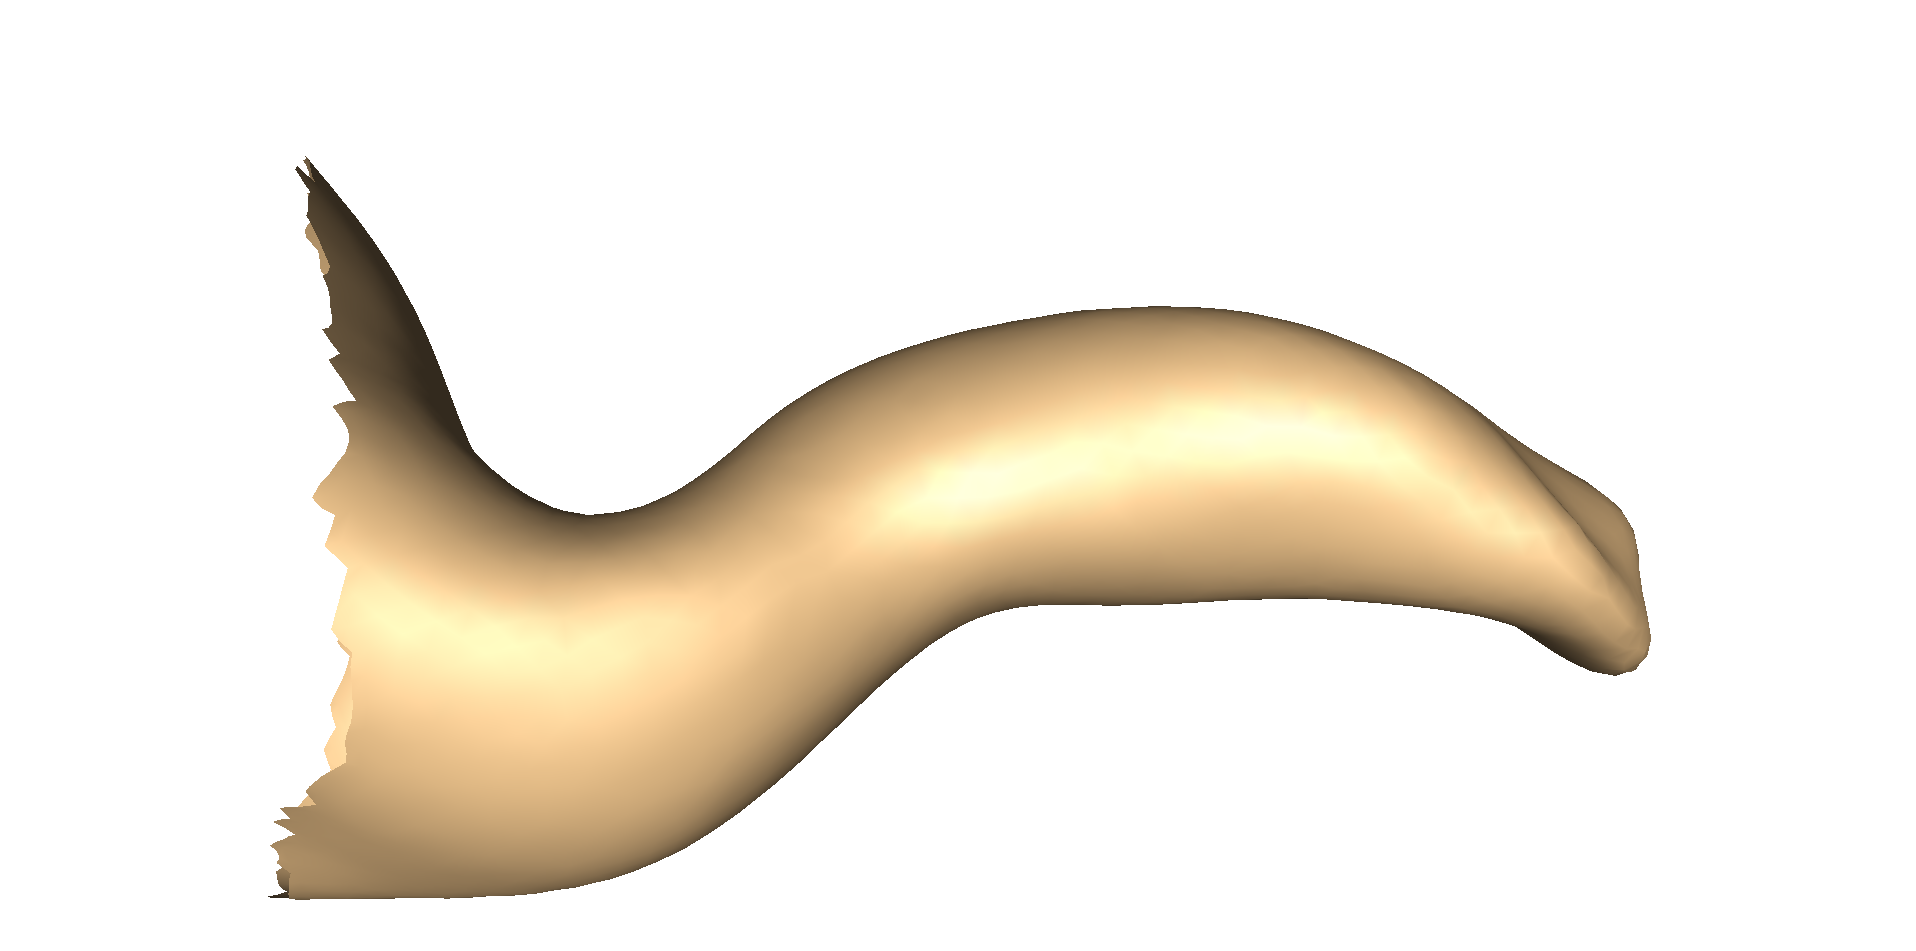
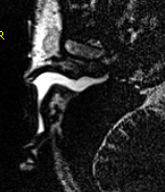
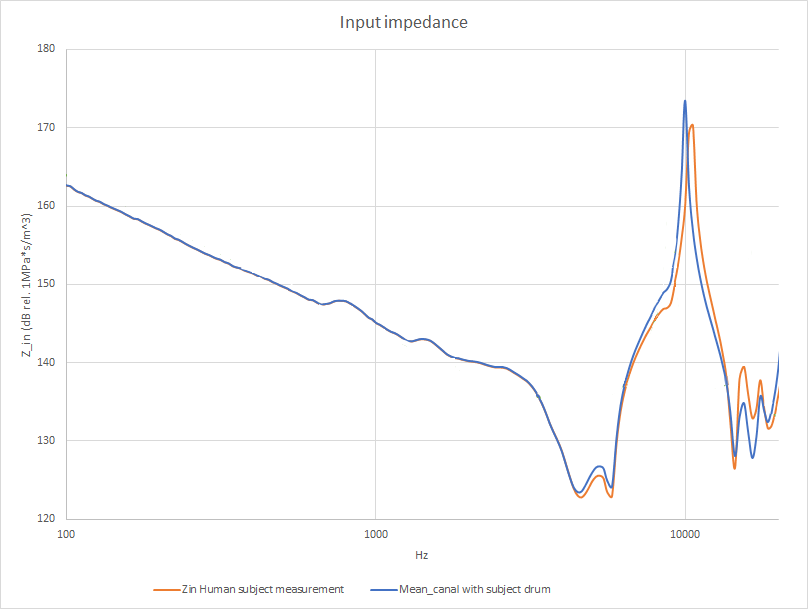
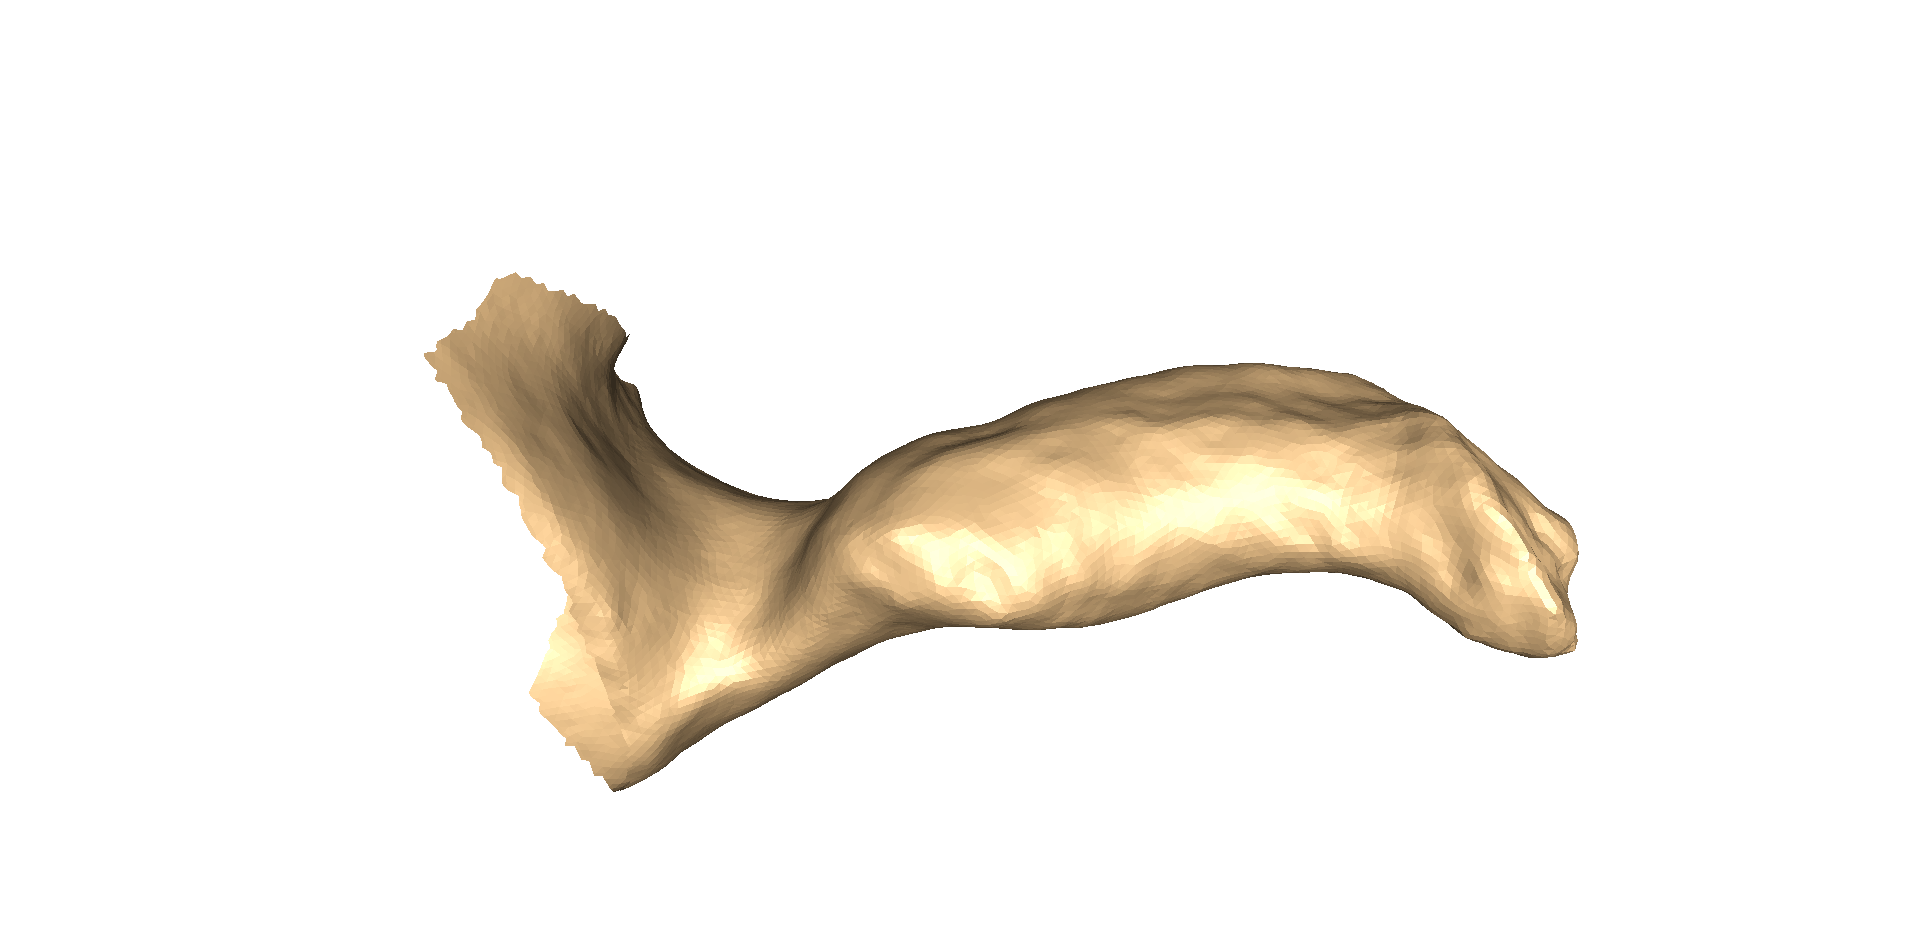
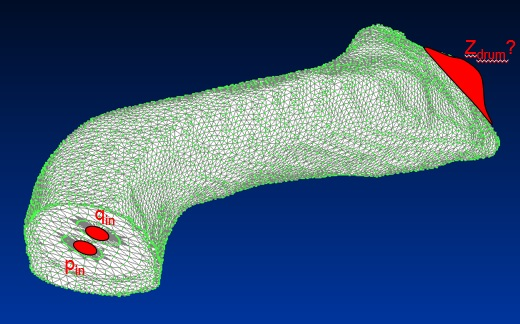
The contrast-enhanced image shows the ear canal as a bright homogeneous volume (Figure 2). The corresponding extracted surface can be seen in Figure 3 as well as the computed mean ear-canal in Figure 1. The surfaces show the attachment point of malleus to the tympanic membrane. The first and the second bend are also clearly visible on the individual impression as well as the mean. To validate the acoustical properties of the average ear canal we compare its acoustical properties to that of the most similar real human ear canal using euclidean distance. Figure 2 show the measured acoustic input impedance $$$Zin$$$ of the closest human ear canal compared to a simulation model of the average ear canal terminated with a finite element model of the same tympanic membrane as the human subject. The simulation setup is shown in Figure 5.Discussion
The combination of a T2 sequence, a focussing coil and vegetable oil produces sufficient contrast to form an image with a clear signal of a homogeneous volume, that accurately represents the outer ear canal of each of the 45 subjects. The average of the outer ear canal from the concha to the tympanic membran, computed from the point distribution model of the population, is indistinguishable from a real human ear canal. The simulations performed on the mean ear canal compared to that of the closest ear canal, have very similar acoustical characteristics as displayed in Figure 3. This supports our claim that the generated mean ear-canal does in fact accurately mimic the shape and thus the acoustical properties of a real human ear canal.Conclusion
We have extracted 45 human ear canals using enhancing cavity contrast while minimizing susceptibility artefacts in T2-weighted images through the using vegetable oil. From the resulting images we were able to successfully extract the ear canal of all 45 subjects and their corresponding surfaces. We co-registered the surfaces using a non-linear surface registration to create a point distribution model, from which an average ear canal was computed. We confirmed that the resulting average ear canal has the same acoustical properties and distinct anatomical features, such as the first and the second bend and the attachment point of the malleus on the tympanic membrane, compared to that of a real ear canal.Acknowledgements
No acknowledgement found.References
1. Darkner,
S., Vester-Christensen, M., Paulsen, R. R., & Larsen, R. (2008,
March). Non-rigid registration of 2D manifolds in 3D Euclidian space. In
Medical Imaging (pp. 69142R-69142R). International Society for Optics and Photonics.
2. Dryden, I. L., & Mardia, K. V. (1998). Statistical shape analysis (Vol. 4). Chichester: J. Wiley.
3. Darkner, S., Larsen, R., & Paulsen, R. R. (2007, October). Analysis of deformation of the human ear and canal caused by mandibular movement. In International Conference on Medical Image Computing and Computer-Assisted Intervention (pp. 801-808). Springer Berlin Heidelberg.
Figures