4655
Mutant huntingtin dosage effect on incidence of high striatal Glutamine in a mouse model of Huntington’s disease – a symptom of liver pathophysiology?1Roche Pharma Research and Early Development, Hoffmann-La Roche Pharmaceuticals Ltd, Basel, Switzerland
Synopsis
In contrast to transgenic models of Huntington’s disease (HD) newly available knock-in models, such as the HttQ175, recapitulate the heterozygosity present in the clinically observed pathophysiology. Here we report a longitudinal assessment of striatal metabolites using 1H-MRS and volumetry in 30+ brain regions in both male and female HttQ175 mice. Apart from a genotype-specific, progressive neurodegenerative phenotype present in both genders, we discovered an entirely novel feature in mouse models of HD, namely individuals with abnormally high glutamine (Gln) levels, whose incidence increased with mutant Htt gene dosage. In line with emerging data on a widespread peripheral metabolic perturbation in HD, we hypothesize that this excessive Gln is a consequence of disordered hepatic metabolism.
PURPOSE
Huntington's disease (HD) is a progressive, neurodegenerative disorder caused by an abnormal expansion of a CAG repeat in the gene encoding the huntingtin protein (Htt). This mutation leads to the expression of a poly-glutamine stretch that changes the functions of mutant Htt (mHtt), inducing pathological processes eventually causing neurodegeneration. Previous MRS and MRI studies have shown that metabolic alterations i.e., reduction of N-acetylaspartate (NAA) and striatal atrophy can detected in HD patients and mouse models of HD1,2. Newly available knock-in models (e.g., Q175) recapitulate the heterozygosity of human HD, the clinically observed pathophysiology and behavioral abnormalities including motor and cognitive deficits3. While older N-terminal and full-length transgenic HD models have been extensively characterized using 1H-MRS and volumetry studies2,4,5, data in knock-in models have only been assessed either in aged mice or in mixed-gender groups with volumetry limited to a few brain regions6,7. Here we assessed striatal metabolites using 1H-MRS and volumes of 30+ brain regions longitudinally in both male and female Q175 mice.METHODS
1H-MRS and MRI in Q175 male and female heterozygous (HET-m, HET-f), homozygous (HOM-m, HOM-f) and wild-type (WT-m, WT-f) littermates with longitudinal study design across 4 time points (2, 4, 7 and 10 months of age). Group size n=10 per genotype/gender. MRS/MRI: Bruker BioSpec 9.4T with 72 mm bird-cage resonator for excitation and surface coil for reception. Mice were sedated with isoflurane (2%). 1H MR spectra were acquired using point-resolved spectroscopy PRESS from single voxel (1.8x1.8x2.0mm3) in the left striatum. Analysis was performed in an automated pipeline using custom scripts for the “LCModel” software. Volumetry: 31 axial T2-weighted structural images (0.078x0.078x0.6mm3) were acquired using a RARE sequence. Volumes of anatomically predefined brain regions were determined by spatially registering an in-house digital brain atlas onto each individual brain at each visit (using “SPM5”).RESULTS AND DISCUSSION
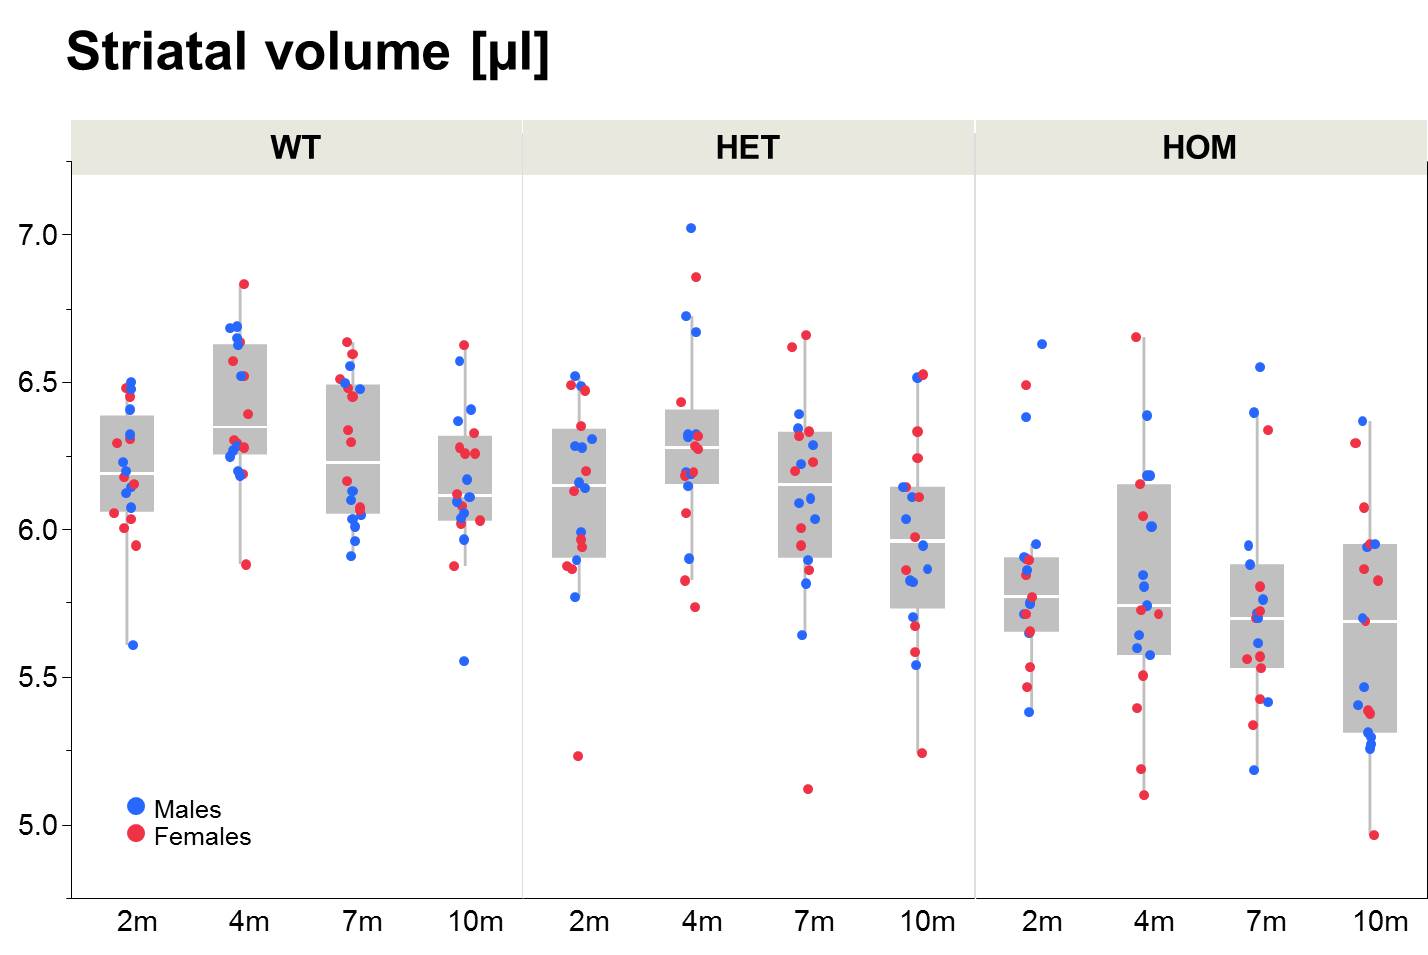
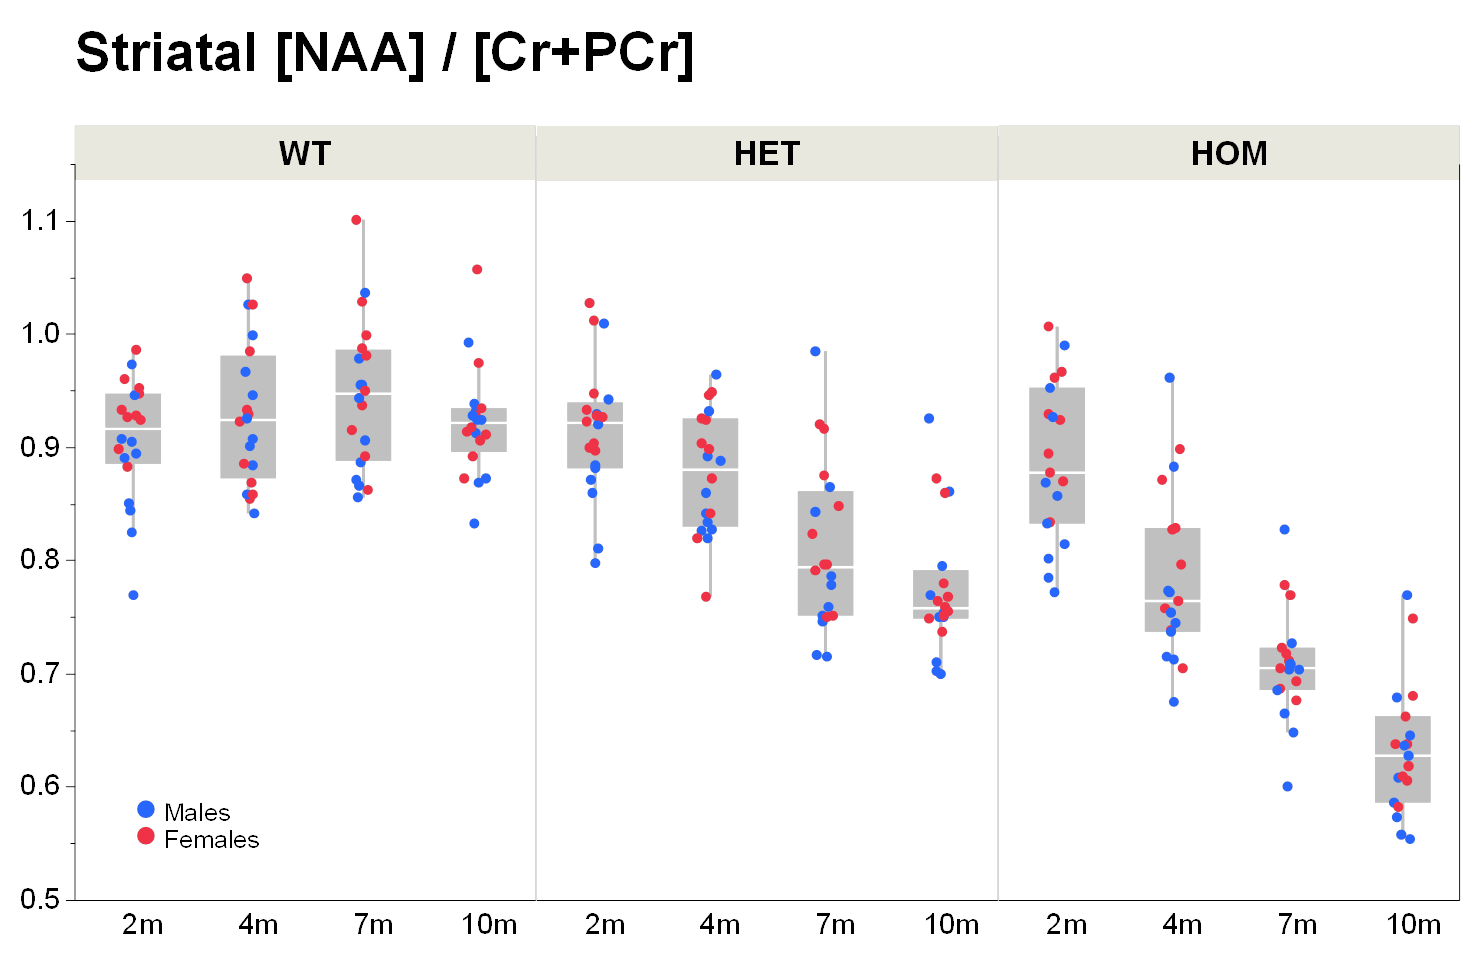
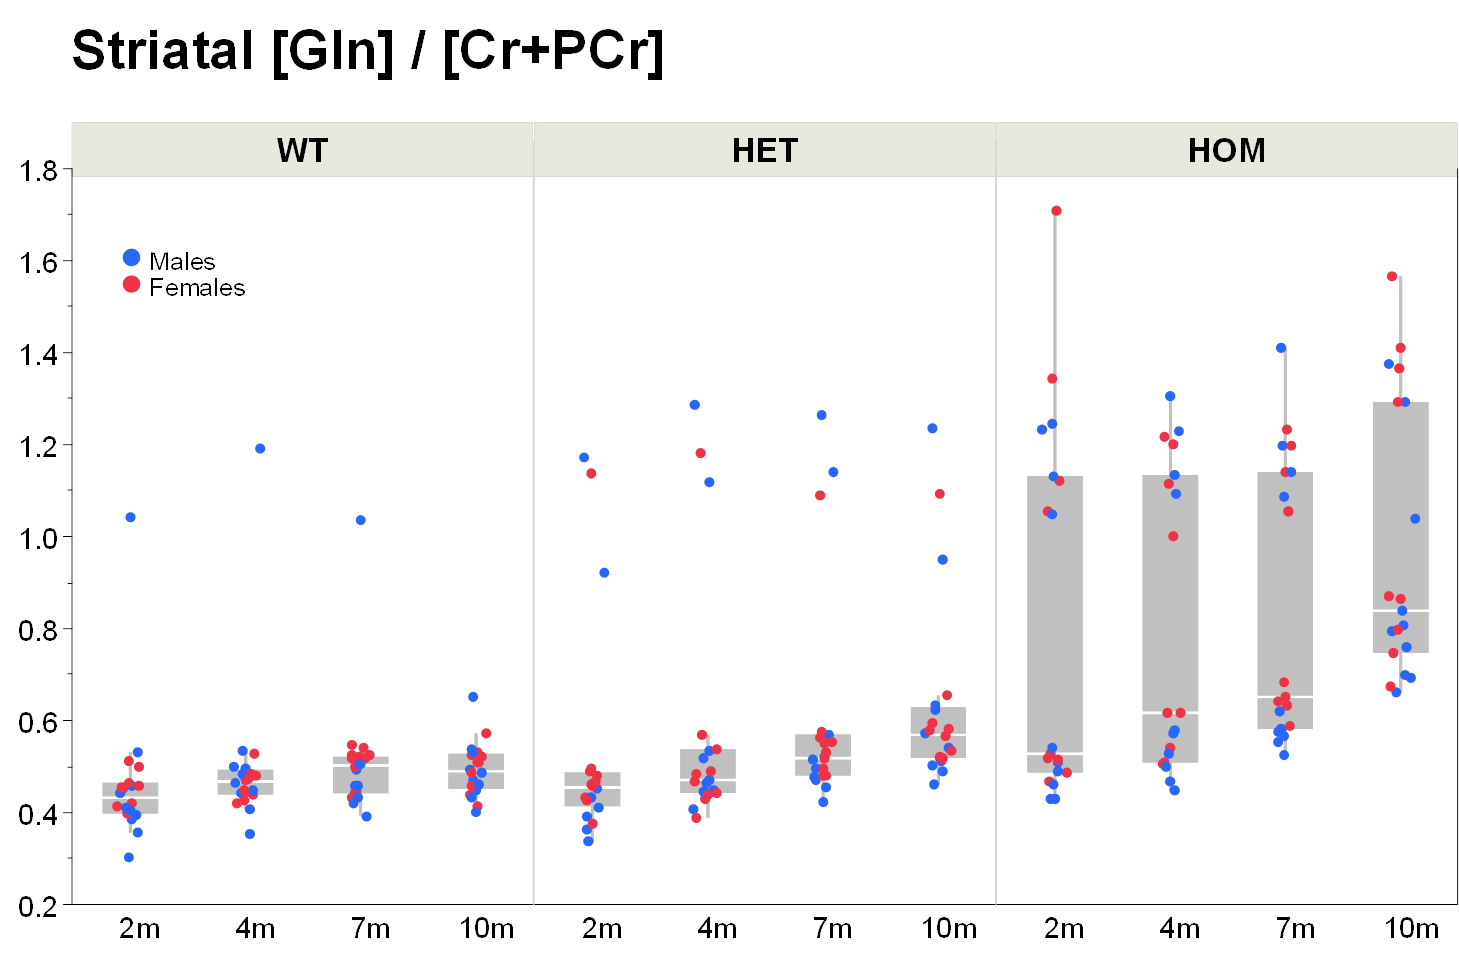
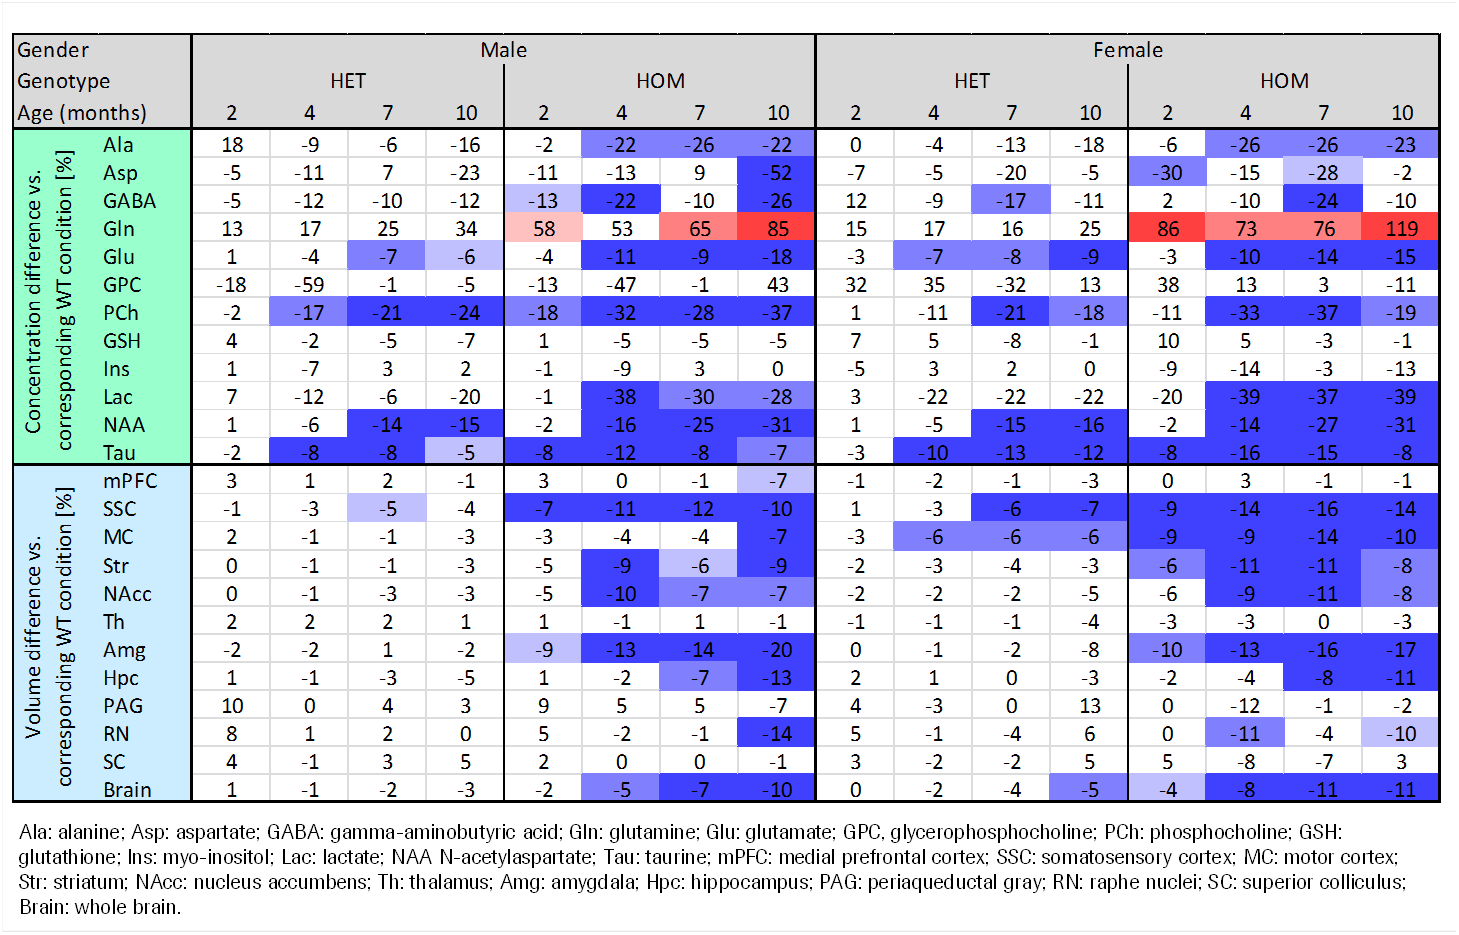
Our results confirm previous findings of a neurodegenerative phenotype in HOM Q175 mice7 reflected by an age-dependent decrease in striatal volume as well as a reduction in NAA when compared to age-matched controls (Fig.1+2). This phenotype was present in both male and female HOM mice and detectable from an age of 4 months. Table 1 provides an overview of significant differences between mutant (HET, HOM) and WT mice for both genders in striatal metabolite concentrations and volumes of brain regions. Remarkably, cortical volume loss together with reduction in taurine appeared to precede striatal atrophy and reduction in NAA and was present in HOM-m and HOM-f already at 2 months. Also, atrophy appeared to be restricted to certain brain regions. HET mice showed only a mild phenotype with no significant changes in striatal volume (unlike in previous assessment of Q175 mice7), and the reduction in NAA only starting at 7 months. The reduction in Glu and increase in Gln in HOM mice has been described earlier in HD models7,8,9, albeit for mixed-gender groups. It appears that the increased Gln levels are stronger/earlier in female mice.We also observed a remarkable feature not reported for HD mouse models so far, namely sub-groups of individuals with age-independent, abnormally high Gln values (usually twice the level of the standard concentrations), whose empirical incidence increased with increasing gene dose (1/20, 3/20 and 8/20 for WT, HET and HOM mice; p=0.0042, Cochran-Armitage trend test; no gender effect, Fig.3). A low incidence of about 1/25 in WT mice is supported by previous (unpublished) data from other in-house studies. The affected individuals also showed higher striatal volumes and deviant concentrations of other metabolites (e.g., higher NAA, lower Ins), although not as pronouncedly. Elevated Gln group levels have been reported previously in HD mouse models7,8,9 and HD patients10, and have been attributed to a decrease in neuronal-glial Glu-Gln cycle and reduced glutaminase activity9. On the other hand, high Gln levels in the brain have also been found in patients with chronic hepatic encephalopathy, where excess ammonia diffuses into the brain and is subsequently metabolized to Gln11,12. We hypothesize that excessive Gln present in some (“high-Gln”) individuals is a consequence of disordered hepatic metabolism, with the incidence related to mHtt dosage, whereas the age-dependent Gln increase in “low-Gln” individuals reflects locally disturbed Glu-Gln metabolism. Indeed, there is evidence for a widespread peripheral metabolic perturbation in HD13, albeit with unclear relevance to the core CNS symptomatology.
CONCLUSION
Apart from an age-dependent alteration in markers of neurodegeneration in homozygous Q175 mice, we identified sub-groups with abnormally high striatal Gln levels, whose incidence showed a mHtt dosage effect. This novel feature may represent a cerebral marker of peripheral metabolic perturbation described for mouse models of HD and HD patients.Acknowledgements
We gratefully acknowledge Sebastien Debilly, Stephanie Schoeppenthau and Ciril Waelti for skilled animal handling and Thomas Bielser for data processing.References
1. Jenkins BG, Rosas HD, Chen Y-CI, et al. 1H NMR spectroscopy studies of Huntington’s disease. Neurol. 1998;50:1357-1365. 2. Jenkins BG, Andreassen OA, Dedeoglu A et al. Effects of CAG repeat length, HTT protein length and protein context on cerebral metabolism measured using magnetic resonance spectroscopy in transgenic mosue models of Huntington’s disease. J. Neurochem. 2005;95:553-562. 3. Menalled LB, Sison JD, Dragatsis I, et al. Time course of early motor and neuropathological anomalies in a knock-in mouse model of Huntington's disease with 140 CAG repeats. J Comp Neurol. 2003;465(1):11-26. 4. Aggarwal M, Duan W, Hou Z, et al. Spatiotemporal mapping of brain atrophy in mouse models of Huntingtons’s disease using longitudinal in vivo magentic resonance imaging. Neuroimage 2012;60:2086-2095. 5. Tkac I, Dubinsky JM, Keene CD, et al. Neurochemical changes in Huntington R6/2 mouse striatum detected by in vivo 1H NMR spectroscopy. J Neurochem. 2007;100:1397-1406. 6. Pépin J, Francelle L, Carrillo-de Sauvage M-A, et al. In vivo imaging of brain glutamate defects in a knock-in mouse model of Huntiongton’s disease. Neuroimage 2016;139:53-64. 7. Heikkinen T, Lehtimäki K, Vartiainen N, et al. Characterization of Neurophysiological and Behavioral Changes, MRI Brain Volumetry and 1H MRS in zQ175 Knock-In Mouse model of Huntiongton’s Disease. PLOS ONE 2012;7(12) e50717. 8. Tkac I, Henry P-G, Zacharoff L, et al. Homeostatic adaptations in brain energy metabolism in mouse model of Huntington’s disease. JCBFM 2012;32 :1977-1988. 9. Jenkins BG, Klivenyi P, Kustermann E, et al. Nonlinear decrease over time in N-acetyl aspartate levels in the absence of neuronal loss and increases in glutamine and glucose in transgenic Huntington's disease mice. J Neurochem. 2000;74 :2108-2119. 10. Taylor-Robinson SD, Weeks RA, Bryant DJ, et al. Proton magnetic resonance spectroscopy in Huntington's disease: evidence in favour of the glutamate excitotoxic theory. Mov Dis. 1996;11:167-173. 11. Kreis R, Farrow N, Ross BD. Localized 1H NMR spectroscopy in patients with chronic hepatic encephalopathy. Analysis of changes in cerebral glutamine, choline and inositols. NMR Biomed. 1991;4(2):109-16. 12. Kanamori K, Ross BD, Chung JC, et al. Severity of hyperammonemic encephalopathy correlates with brain ammonia level and saturation of glutamine synthetase in vivo. J Neurochem. 1996;67:1584-1594. 13. Carroll JB, Bates GP, Steffan J, et al. Treating the whole body in Huntington's disease. Lancet Neurol. 2015;14:1135-42.Figures