4653
Correlation between dynamic changes of glutamate metabolism and microcirculatory perfusion in basal ganglia after hypoxic–ischemic brain damage1Department of Radiology, Shengjing Hospital of China Medical University, Shenyang, People's Republic of China, 2Department of Radiology, Shengjing Hospital of China Medical University, Shenyang, China, People's Republic of China, 3Department of Imaging Systems Clinical Science, Philips Healthcare (China), Beijing, People's Republic of China
Synopsis
The excitotoxicity of glutamate metabolism as well as hemodynamic disorders of the brain are both risk factors for neonatal hypoxic–ischemic brain damage (HIBD). To investigate the combined application of intravoxel incoherent motion (IVIM) and 1H-magnetic resonance spectroscopy (MRS) in exploring the possible mechanisms. This study was undertaken to examine basal ganglia metabolites (by means of 1H MRS) and microcirculation (by means of IVIM) in a piglet model of hypoxic-ischemia (HI). It is concluded that elevation of glutamate occurs in parallel to perfusion disruption reflected by changes in perfusion fraction f after HI.
Purpose
To observe changes, by multiparametric magnetic resonance (MR) scanning, in glutamate metabolism in basal ganglia after the induction of hypoxia–ischemia (HI) in newborn piglets, and to explore interactive changes between glutamate metabolism and the microcirculation and their possible mechanisms.
Methods
A HIBD model in newborn piglets was established. Piglets were subjected to common carotid artery occlusions with concomitant drop in inhaled O2 to 6% for 40 minutes. All examinations were performed on a 3.0-T MRI (Achieva 3.0T TX; Philips Healthcare Systems, Best, The Netherlands) with an eight-channel sensitivity-encoding receiver coil. Before an operation, and 0–6 h, 8–12 h, 18–30 h and 48–60 h after HI insult, animals were subjected to a 1H-magnetic resonance spectroscopy (MRS) scan, which were acquired using a point-resolved spectroscopy (PRESS) sequence with TR = 2000 ms; TE = 37 ms; bandwidth = 2000 Hz and number of signal acquisition (NSA) = 64. VOI (10 mm × 10 mm × 10 mm) was placed in the left basal ganglia. Then, changes in glutamate metabolism (including glutamate [Glu], glutamine [Gln] and glutamate + glutamine [Glx]) in damaged basal ganglia were analyzed using LCModel (Linear Combination Model) software. Meanwhile, an intravoxel incoherent motion (IVIM) scan was performed with a single-shot spin echo planar imaging (EPI) sequence; TR/TE 4000 ms/90 ms; matrix 228 × 231; slice thickness 5 mm; and 16 b-values (0, 10, 20, 40, 80, 110, 140, 170, 200, 300, 400, 500, 600, 700, 800, and 900 s/mm2). IVIM raw data were transferred to post-processing software (home-made Matlab script; Philips Healthcare, China), and then post-processed with a bi-exponential model to give pseudo-color images of diffusion coefficient D, pseudo-diffusion coefficient D* and perfusion fraction f. The 40-voxel ROI was manually marked on the left basal ganglia in images at b = 0 s/mm2 by combining T2WI scan images and then D, D* and f values were calculated; the latter two parameters D* and f can provide information on microcirculatory perfusion. Correlations between metabolism involving the release of glutamate and changes in IVIM-derived perfusion parameters were further analyzed.
All statistical analyses were performed using SPSS 20.0. Multiple comparisons of data were performed by one-way analysis of variance (ANOVA), and Correlations were analyzed by Spearman rank correlation analysis.
Results
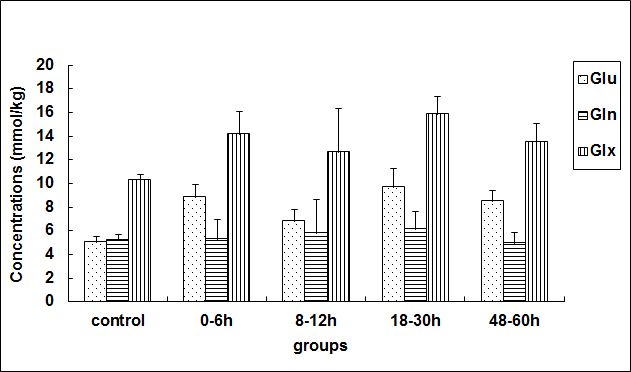
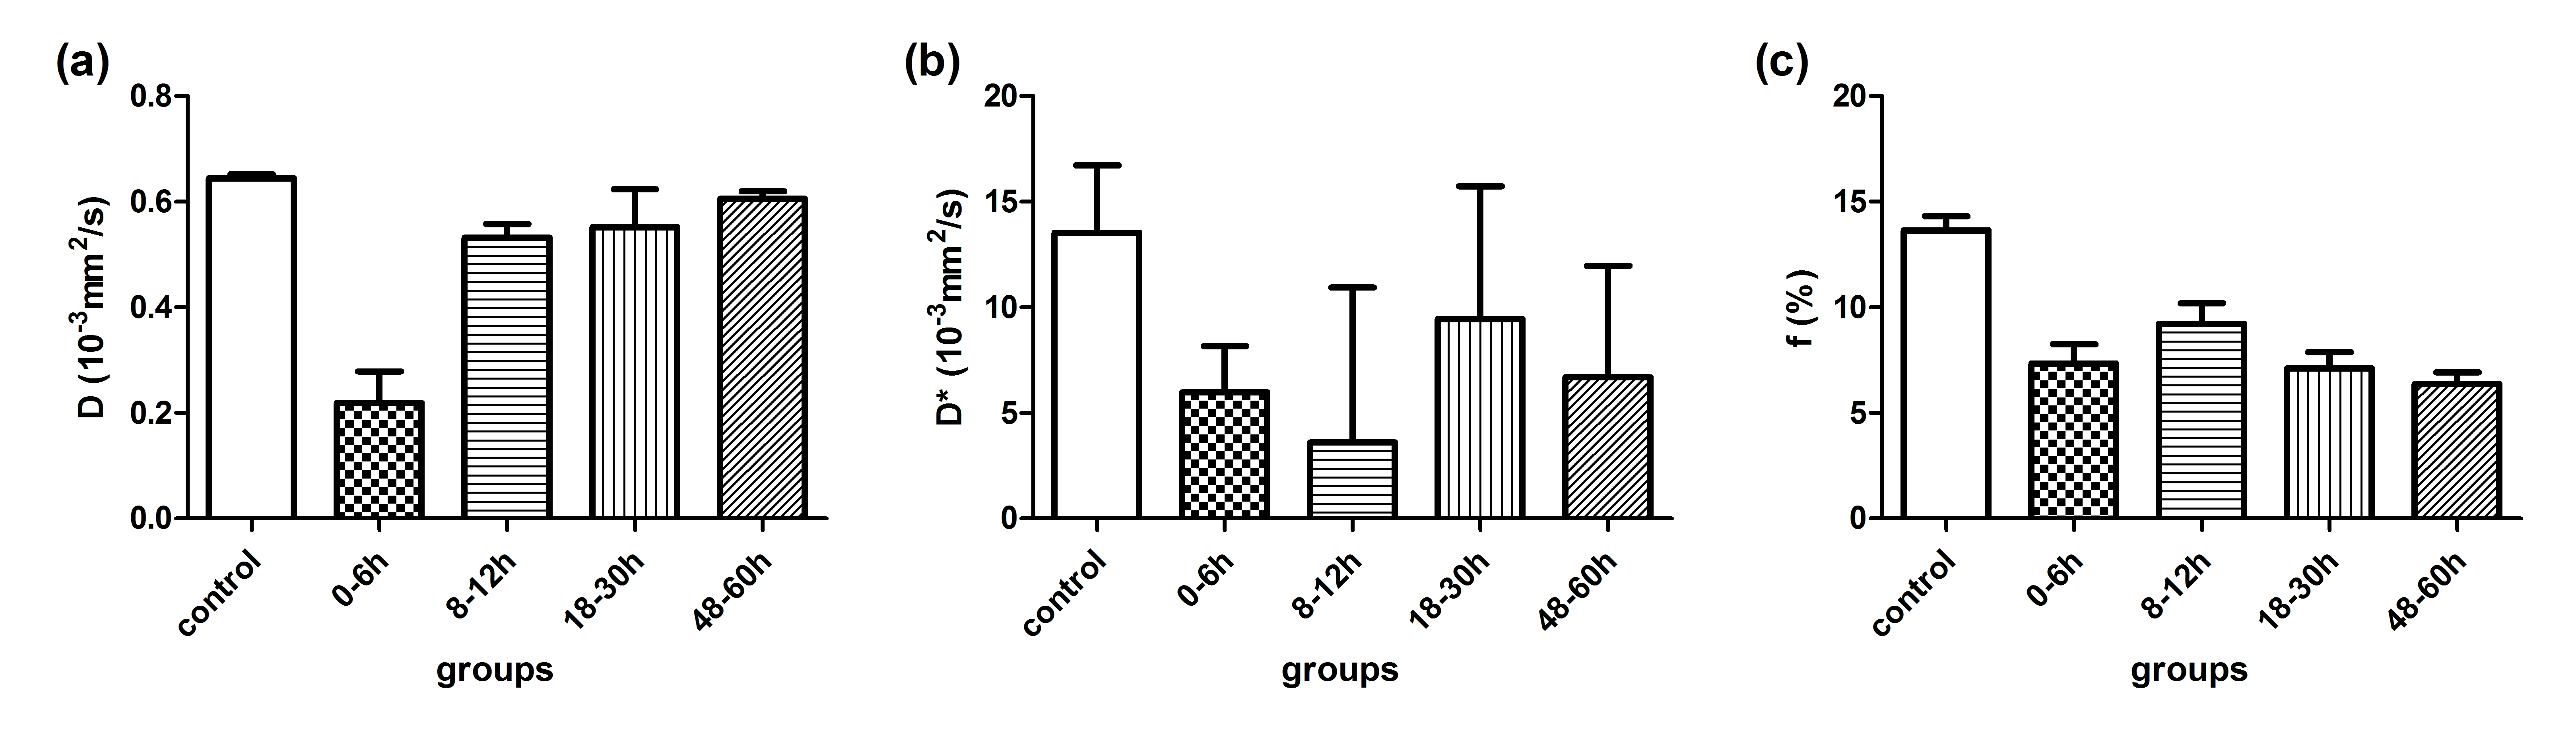
Compared with the control group, the concentration of Glu in the basal ganglia showed a “two-phase” change after HI (Fig 1); the Glx concentration demonstrated a similar change; while the Gln concentration among the various groups was not statistically different. As shown by Fig. 2, the perfusion fraction f, trended to recover gradually at < 12 h after a HI operation, but was still lower than that for the control group; thereafter, it further decreased and displayed an opposing trend to the changing trend in the Glu concentration. However, a statistically significant difference in D* was not found among various groups.
Glu showed a significant negative correlation with f (r = -0.643, P = 0.001); Glx also showed a negative correlation with f (r = -0.478, P = 0.016); however, no relationship was observed between Glu, Gln or Glx, and D*.
Discussion
The excitotoxicity of glutamate metabolism1 as well as hemodynamic disorders of the brain2,3 are both risk factors for HIBD. As previously reported,4,5 nerve activities are tightly associated with the degree of vascular perfusion in the brain. Our results showed that Glu-mediated excitotoxicity results from, and contributes to, disturbances in microcirculatory perfusion, and their joint effects are an important cause of neuronal injury in the acute stages of HIBD.Conclusion
IVIM-derived f -value can be used to evaluate brain microcirculatory perfusion after HI and significant negative correlation was observed between Glu concentration with f. Therefore, it is inferred that glutamate release is closely related to microcirculatory changes in the acute stages of HIBD. Meanwhile, combining use of IVIM and 1H-MRS may be helpful for understanding the relevant pathophysiological mechanisms in HIBD in vivo.Acknowledgements
No acknowledgement found.References
1. Choi DW, Rothman SM. The role of glutamate neurotoxicity in hypoxic-ischemic neuronal death. Annual review of neuroscience. 1990;13:171-182.
2. Pryds O, Greisen G, Lou H, Friis-Hansen B. Vasoparalysis associated with brain damage in asphyxiated term infants. The Journal of pediatrics. Jul 1990;117(1 Pt 1):119-125.
3. Howlett JA, Northington FJ, Gilmore MM, et al. Cerebrovascular autoregulation and neurologic injury in neonatal hypoxic-ischemic encephalopathy. Pediatric research. Nov 2013;74(5):525-535.
4. Busija DW, Bari F, Domoki F, Louis T. Mechanisms involved in the cerebrovascular dilator effects of N-methyl-d-aspartate in cerebral cortex. Brain research reviews. Nov 2007;56(1):89-100.
5. Jackman K, Iadecola C. Neurovascular regulation in the ischemic brain. Antioxidants & redox signaling. Jan 10 2015;22(2):149-160.
Figures