4652
A metabolic study of hypoxic ischemia during mouse brain development using hyperpolarized 13C1Department of Radiology and Biomedical Imaging, UCSF, San Francisco, CA, United States, 2Joint UCSF/UC Berkeley Graduate Group in Bioengineering, UCSF, San Francisco, CA, United States, 3Department of Neurology, UCSF, San Francisco, CA, United States, 4Department of Pediatrics, UCSF, San Francisco, CA, United States
Synopsis
In this study, we applied dynamic nuclear polarization (DNP) technique to investigate C1 labeled 13C pyruvate to lactate conversion on hypoxic ischemia (HI) injured neonatal mouse brains during development. Our results showed that lower pyruvate level and higher lactate to pyruvate ratio on the injured hemisphere in comparison to the non-injured hemisphere at the day of injury (P10). This difference narrows as the brain matures. With this technique, we are able to examine individuals’ response to HI in vivo during brain development.
Introduction
Hypoxic ischemia (HI) is a neonatal brain injury that causes death and permanent disability. Metabolic changes in response to HI are important to shed light on its mechanisms and long-term tissue evolution. Dynamic nuclear polarization (DNP) has been proven to increase 13C NMR signal for more than 10,000 fold, allowing investigations of 13C metabolic exchanges in vivo1,2, to provide additional tissue characterization to T1- and T2-weighted MRIs which assess morphological changes. Using DNP, our study investigated the changes in pyruvate to lactate conversion during maturation in HI mice.Methods
Preparation: 10 mice received HI using the Vannucci model3 on the left hemisphere at postnatal day 10 (P10) by cutting and clotting one carotid artery and treated with hypoxia for an hour. They were scanned at P10, P17 and P32. Some dates were slightly shifted or missing due to scanner availability, technical issues or animal expiration. Mice were anesthetized with 1.5% isoflurane and 1 L/min oxygen and continuously monitored during scans. All experiments were conducted on a vertical 14.1T (Agilent) 600WB NMR spectrometer with 55mm 1000mT/m gradients and a 40mm diameter 1H and 13C dual-tuned coil. C1 labeled 13C pyruvate was polarized using an Oxford HypersenseTM DNP instrument and 150µL of the dissolution mixture containing 160mM pyruvate was injected into the tail vein through a catheter over a span of 12 seconds.
Data acquisition: Data were acquired on a 24 mm × 24 mm × 5 mm slab centered on the brain, with 2D chemical-shift imaging acquired using center-out 8x8 phase encoding with 128 spectral points. The acquisition was started 10 seconds after the beginning of pyruvate injection and repeated every 5s (4s TR with 1s delay between each repetition) for a total of 75s with constant flip angle of 10°. A T2-weighted image was acquired using fast spin echo with TR/TE=1.3s/12ms and resolution of 0.12mmx0.12mmx1mm.
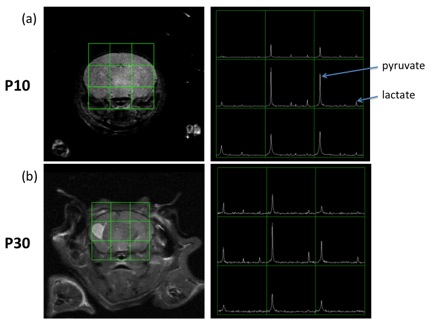
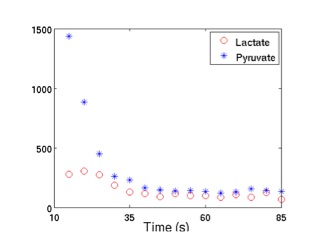
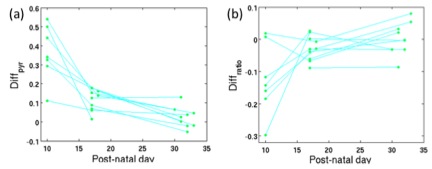
Data processing: Voxel shift was performed on the 2D grid to locate one voxel on the left hemisphere and one voxel on the right hemisphere (Figure 1). The area under the pyruvate curve and the lactate curve (Figure 2) were taken from a voxel on each of the hemispheres. To examine the changes in pyruvate uptake into the brain and the production of lactate across different ages, we compared the absolute pyruvate level and the ratio of lactate to pyruvate between two hemispheres. The pyruvate signal difference between two hemispheres were calculated as Diffpyr = (PyrR–PyrL)/(PyrR+PyrL), where PyrR is the area under the pyruvate curve for the right hemisphere and PyrL is calculated the same for the left. The difference in lactate to pyruvate ratio were calculated as Diffratio = (LacR/PyrR– LacL/PyrL)/(LacR/PyrR+LacL/PyrL), where LacR/PyrR is the ratio of the area under the lactate curve to the area under the pyruvate curve for the right hemisphere and LacL/PyrL is calculated the same for the left.
Results
Figure 1 shows the T2-weighted imaging results of a representative subject at P10 and P30. One can observe hypointensity at P10 and hyperintensity at P30 on part of the left hemisphere. There is a significant reduction of pyruvate uptake in the left hemisphere than the right at P10, but minimal difference is shown at P30. Figure 3a shows consistent results from all subjects that the left hemisphere has much less pyruvate at P10, but the difference shrinks at P17 and is almost similar to the right at P32. Though the left hemisphere has lower pyruvate level, its lactate to pyruvate ratio is higher at P10 (Figure 3b). The lactate to pyruvate ratio has very little difference between both hemispheres at P17 and P32, where the difference lies below 10% for all subjects.Discussion
At very early stage of HI injury (such as P10), the lack of blood flow to the injured hemisphere might be the cause of reduction of pyruvate arrival. By HI injury, anaerobic respiration causes increase in lactate production, as we can see from higher lactate to pyruvate ratio on the injured hemisphere than the non-injured side. As the brain matures, even though T2-weighted images still show structural damage of the brain, the pyruvate to lactate metabolism seems to recover for the injured hemisphere and get back to the same level as the non-injured hemisphere at adult age (P32). By applying hyperpolarized 13C, we are able to investigate longitudinal metabolic changes in vivo, which will provide a more comprehensive understanding of brain maturation of HI injury, besides structural changes from conventional MR images.Acknowledgements
No acknowledgement found.References
[1] Ardenkjaer-Larsen JH, Fridlund B, Gram A, Hansson G, Hansson L, Lerche MH, et al. Increase in signal-to-noise ratio of > 10,000 times in liquid-state NMR. Proceedings of the National Academy of Sciences of the United States of America. 2003;100:10158-63.
[2] Golman K, in 't Zandt R, Thaning M. Real-time metabolic imaging. Proceedings of the National Academy of Sciences of the United States of America. 2006;103:11270-5.
[3] Rice JE, Vannucci RC, Brierley JB. The influence of immaturity on hypoxic-ischemic brain damage in the rat. Annals of neurology. 1981;9:131-41.
Figures