4648
Striatal 7T 1H-MRS in two Huntington's Disease Mouse Models (zQ175 and YAC128)1Radiology, University of British Columbia, Vancouver, BC, Canada, 2Centre for Molecular Medicine and Therapeutics, University of British Columbia, Vancouver, BC, Canada, 3Physics and Astronomy, University of British Columbia, Vancouver, BC, Canada
Synopsis
Two Huntington’s disease (HD) mouse models with difference rates of disease progression, zQ175 and YAC128, were examined using 7T proton magnetic resonance spectroscopy of mice aged 6-7 months. zQ175 heterozygous and homozygous genotypes showed significantly decreased [tNAA] and increased [mI] compared to wild type. No differences in metabolite concentrations were found between YAC128- (wild type) and YAC128+ mice. A slow HD disease course in YAC128+ genotype may be the reason for lack of measured metabolite concentration differences.
Introduction
Huntington’s disease (HD) is a neurodegenerative disease that results in cognitive, motor and psychiatric disturbances1. The striatum (caudate nucleus and putamen) is a known early site of disease, and has been found to have significant atrophy even before manifest HD2. Human MRS studies have found significantly decreased [tNAA] and increased [mI] in the putamen3,4 of HD brain. Many different mouse models for HD have been developed over the last couple of years to mimic similar pathology and disease progression as in humans. Recently zQ175 mice (knocked-in expanded CAG repeat in HTT gene) have been found to exhibit similar changes in metabolite concentrations as in humans5. The YAC128 (transgenic mouse) model is also thought to be a good model as it expresses the full human mutant HTT gene, but has a slower progression than the zQ175 model. Here we examine MRS of these two mouse models at 7T at 6-7 months of age to see if they mimic human metabolite changes.Methods
All scans were completed on a 7T Bruker Biospec MR with a 30cm bore size. MRS in the striatum of the mouse brain was acquired using a PRESS sequence with outer volume suppression and VAPOR water suppression; TE=10.48ms, TR=4000ms, NA=512, 4096 points, BW=2.5kHz, 2.5x2.5x3mm3 voxel size with a 34 minute acquisition time. Fieldmap-based shimming (MAPSHIM) was used with further manual optimization if the water linewidth was greater than 13 Hz. MRS was fit with LCModel and metabolite concentrations were determined with the assumption of 80% water content and an unsuppressed water relaxation attenuation of 0.7, with a rejection criteria of outputs of SNR<7 and FWHM>11Hz. The genotypes of the zQ175 mice were wild type (n=8), heterozygous (n=6) and homozygous (n=5). Mutant YAC128+ (n=7) were compared to their wild type (WT) littermates (YAC128-, n=8). All mice were between 6-7 months old when scanned. YAC128 mice were compared using a Welch's t-test (assumed unequal variances) and zQ175 were compared using a one-way ANOVA and Tukey HSD post-hoc analysis (assumed equal variances).
Results and Discussion
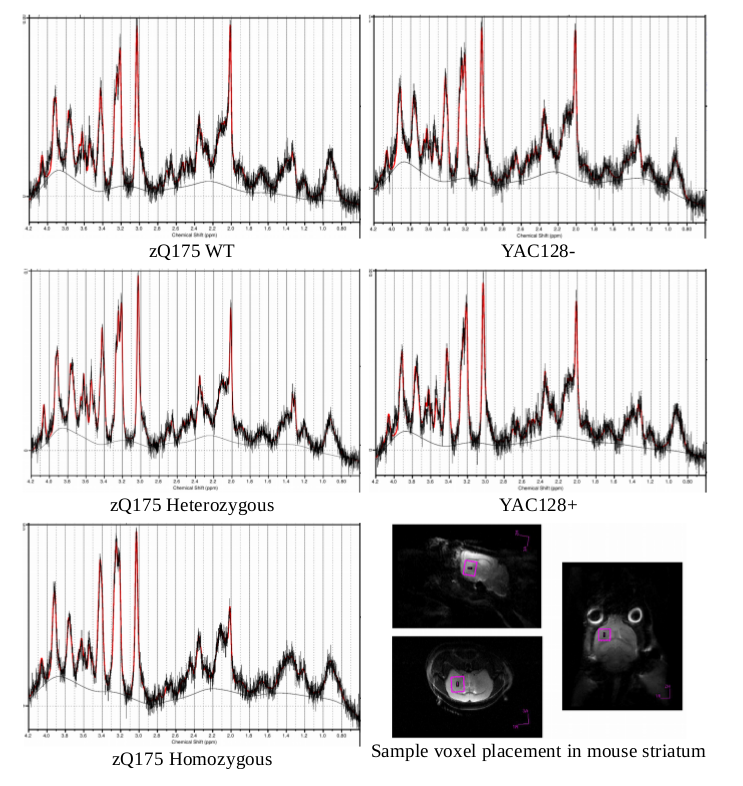
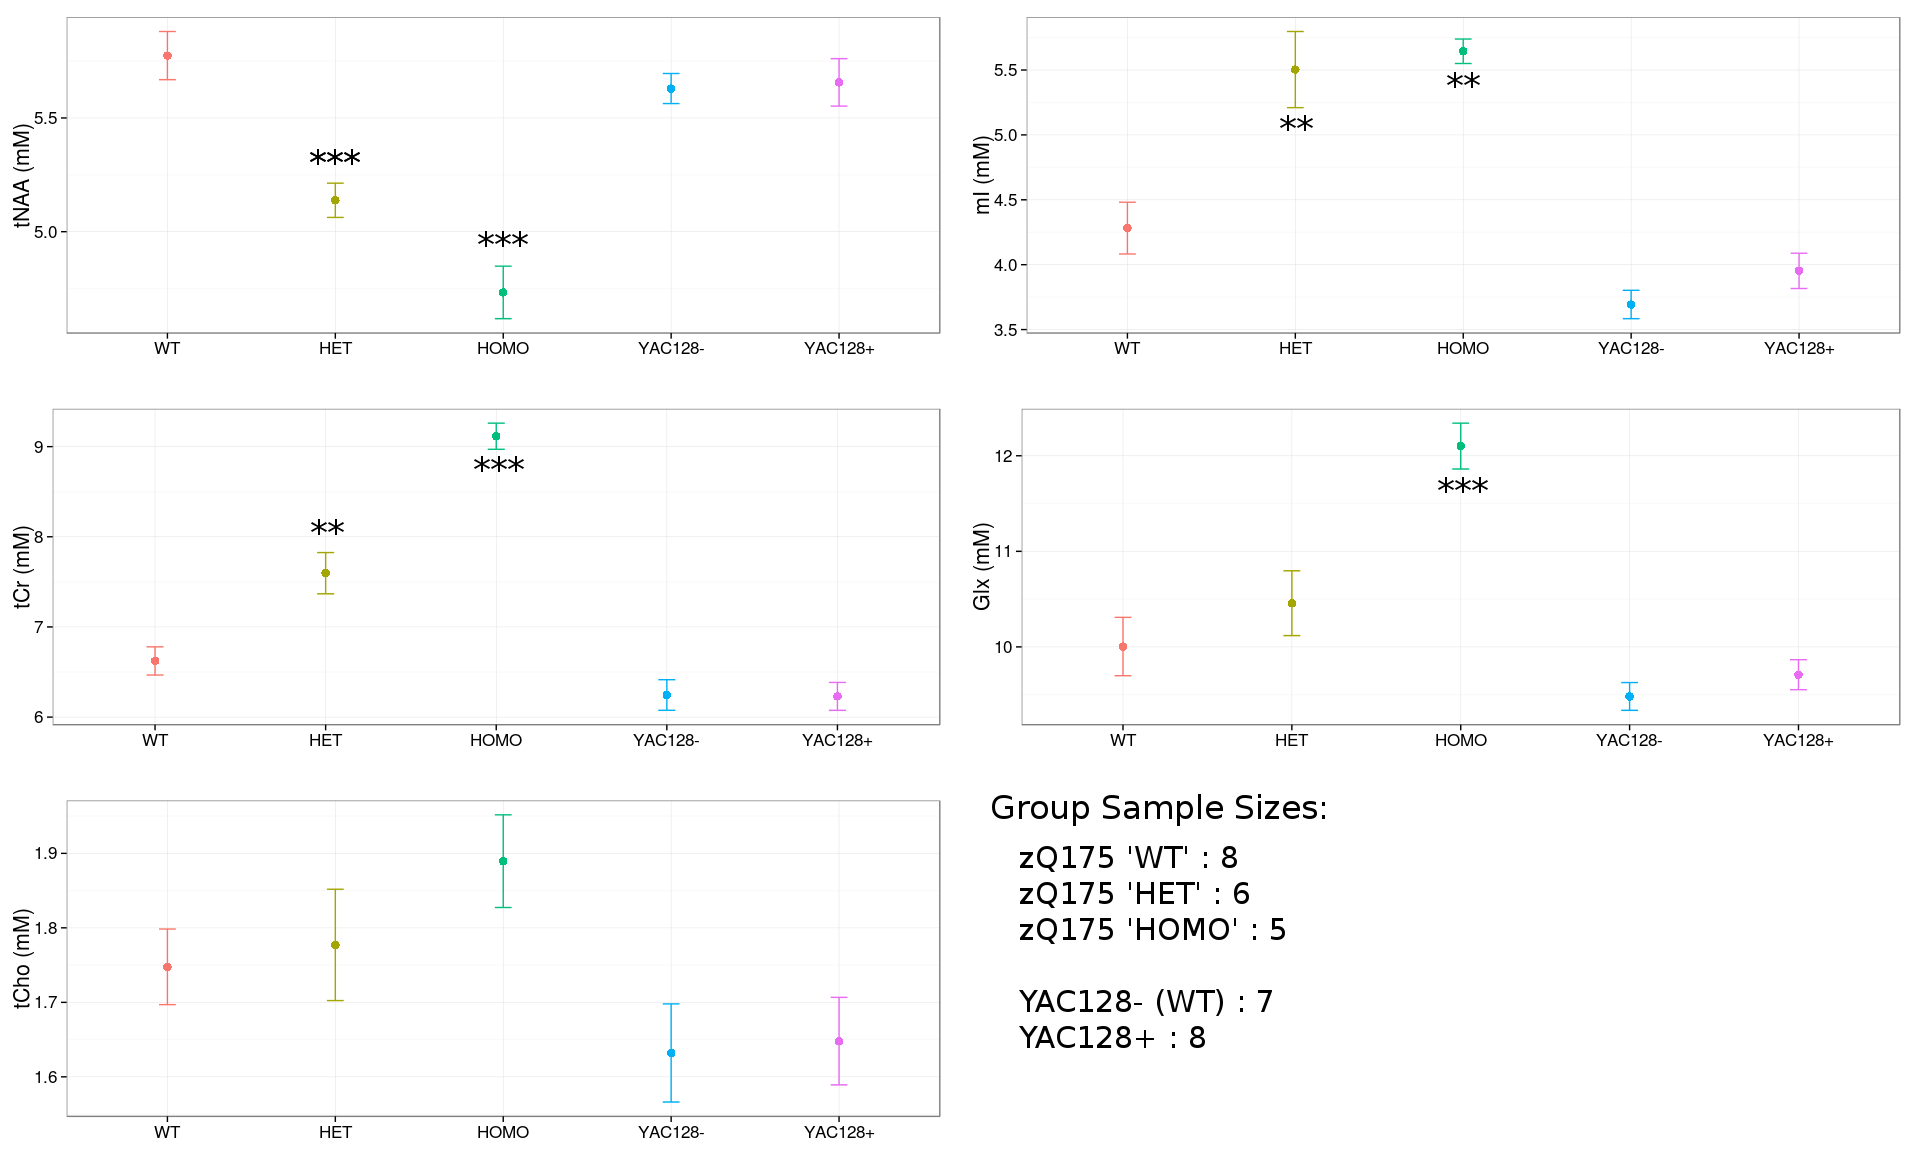
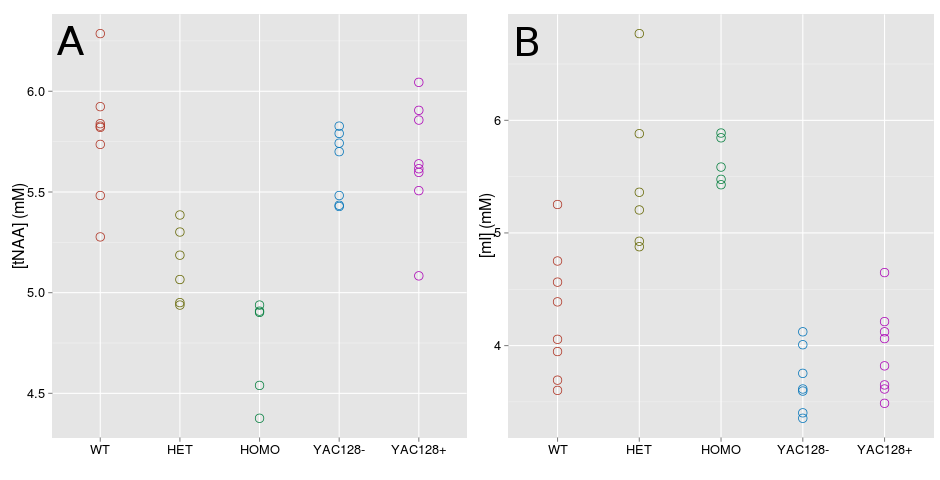
Figure 1 shows sample spectra for mouse genotypes and metabolite means and standard errors are given in Figure 2 for the main metabolites. The two main metabolites of interest based on human studies, are tNAA and mI, which are shown for all mice in Figure 3.
zQ175: Significant differences between wild type (WT) and HD mice (both HOMO and HET genotypes) were found for [tNAA] (p<0.001) and [mI] (p<0.01). A previous study found significant differences between WT and HD [tCr] and [Glx], similar to our results, but no genotype differences for [tNAA] and [mI]. zQ175 mice showed metabolite changes similar to those found in human MRS studies; these changes appeared to occur early in zQ175mice, consistent with previous reports of early striatal atrophy in these mice5.
YAC128: The YAC128- (WT) and YAC128+ mice showed no significant differences in [tNAA] (p=0.83) and [mI] (p=0.16), however YAC128+ did have higher mean [mI]. YAC128+ mice have a slower disease progression than zQ175 mice and do not show significant striatal volume changes at 6 months6. Hence 6-7 months may be too early in the disease progression to detect [tNAA] differences. We will scan older YAC128+ mice at 18 months of age to see if these metabolite changes occur later in the disease course of this mouse model.
Acknowledgements
We thank the CHDI Foundation for funding this project.References
1. Roos RAC. Huntington’s disease: a clinical review. Orphanet J Rare Dis [Internet]. 2010;5(1):40. Available from: http://ojrd.biomedcentral.com/articles/10.1186/1750-1172-5-40
2. Tabrizi SJ, Scahill RI, Owen G, Durr A, Leavitt BR, Roos RA, et al. Predictors of phenotypic progression and disease onset in premanifest and early-stage Huntington’s disease in the TRACK-HD study: Analysis of 36-month observational data. Lancet Neurol [Internet]. 2013;12(7):637–49. Available from: http://dx.doi.org/10.1016/S1474-4422(13)70088-7
3. Sturrock A, Laule C, Wyper K, Milner RA, Decolongon J, Santos RD, et al. A longitudinal study of magnetic resonance spectroscopy Huntington’s disease biomarkers. Mov Disord. 2015;30(3):393–401
4. Sturrock A, Laule C, Decolongon J, Dar Santos R, Coleman AJ, Creighton S, et al. Magnetic resonance spectroscopy biomarkers in premanifest and early Huntington disease. Neurology. 2010;75(19):1702–10.
5.
Heikkinen T, Lehtimäki K, Vartiainen N, Puoliväli J, Hendricks SJ,
Glaser JR, et al. Characterization of Neurophysiological and
Behavioral Changes, MRI Brain Volumetry and 1H MRS in zQ175 Knock-In
Mouse Model of Huntington’s Disease. PLoS One. 2012;7(12). Available from:
http://dx.doi.org/10.1371/journal.pone.0050717
6. Slow EJ, van Raamsdonk J, Rogers D, Coleman SH, Graham RK, Deng Y, et al. Selective striatal neuronal loss in a YAC128 mouse model of Huntington disease. Hum Mol Genet. 2003 Jul;12(13):1555–67.
Figures