4647
31P MR Spectroscopic Imaging of the Human Brain at 7T1Advanced Imaging Research Center, University of Texas Southwestern Medical Center, Dallas, TX, United States, 2Department of Neurology and Neurotherapeutics, University of Texas Southwestern Medical Center, Dallas, TX, United States, 3Department of Chemistry, Unversity of Texas at Dallas, Richardson, TX, 4VA North Texas Health Care System, Dallas, TX, United States
Synopsis
31P MRS is capable of probing cerebral metabolism in vivo, but clinical applications are limited by poor spatial resolution. This study demonstrates that 31P MRS imaging (MRSI) at 7T can offer high quality spectral data that enables cross-sectional mapping of various phosphorus-bearing metabolites in normal human brain. In a patient with prior ischemic stroke, high-energy phosphates were depleted and extracellular inorganic phosphate was increased in the stroke lesion.
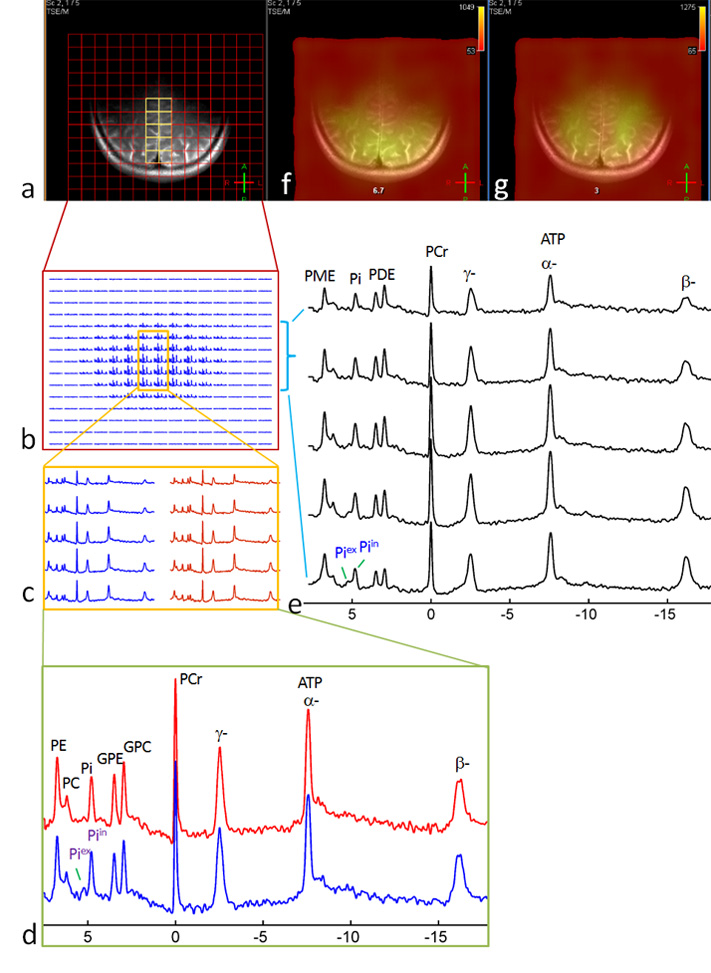
INTRODUCTION: Clinical application of 31P MRS for evaluation of cerebral metabolism has attracted strong interest for diverse conditions1-9. The concentrations of phosphorylated metabolites and intracellular pH may be altered in cerebral tissues with aging2,9, and in pathological conditions such as depression6, epilepsy4, insomnia7, schizophrenia3, bipolar diorders1 and Alzheimer’s disease8. Despite its potential value for clinical application, at present the brain 31P MRSI at 1.5T and 3T still suffers from low spatial resolution due to inherent low detection sensitivity and low spectral dispersion. This study aims to utilize ultrahigh field 7T 31P MRSI for mapping cross-sectional distribution of P-metabolites in human brain. At 7T, less abundant and chemically similar phosphorylatedmetabolites can be resolved , such as phosphomonoesters (PME, including phosphoethenalamine, PE, at 6.7 ppm and phosphocholine, PC, at 6.2 ppm), and phosphodiesters (PDE, including glycerolphosphoethenalamine, GPE, at 3.5 ppm and glycerolphosphocholine, GPC, at 3.0 ppm), as well as intra- and extracellular inorganic phosphate (at 4.8 and 5.2 ppm, all relative to phosphocreatine). Additionally, minor regional difference in metabolite contents can be revealed at high spatial resolution as demonstrated in this study in healthy subjects and an ischemic stroke patient.
METHODS: All subjects, 4 healthy volunteers and one ischemic stroke patient, participated the study with written consent under an approved IRB protocol. The subjects were positioned supine in the MRI scanner (7T Achieva, Philips Healthcare), with the back of the head positioned in the center of the RF coil. The coil is a double-tuned 1H /31P T/R coil comprised of two tilted partially overlapped loops of diameter 10 cm, shaped to fit the skull. Single-slice 2D 31P MRSI data were acquired using the following parameters: TR 2 s, spectral width 4 kHz, sample points 2k, NA 4, in plane resolution 1x1 cm2 (APxRL), slice thickness ~ 6 cm as defined by coil sensitive region, scan time ~ 25 min. 31P spectra post-processing was performed using scanner software SpectraView with a line-broadening factor of 10 Hz prior to FT and phasing. Metabolite quantification was based on peak fitting with Voigt lineshape, and data analysis was done with a home-built program in Matlab. g-ATP signal at -2.5 ppm was used as intensity reference to compare metabolites between right and left occipital lobes.
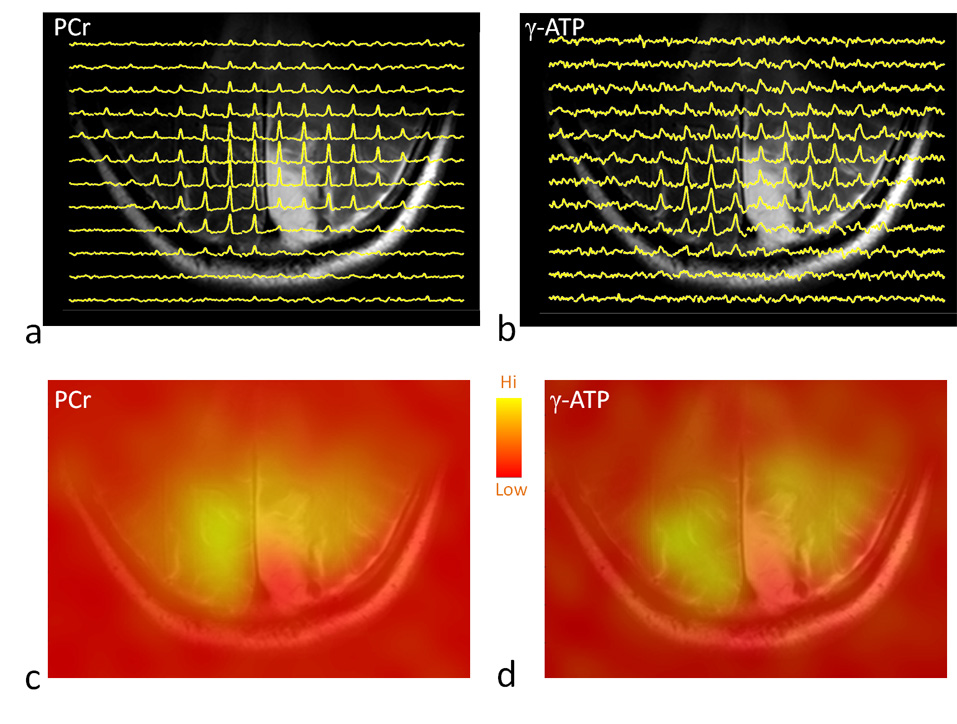
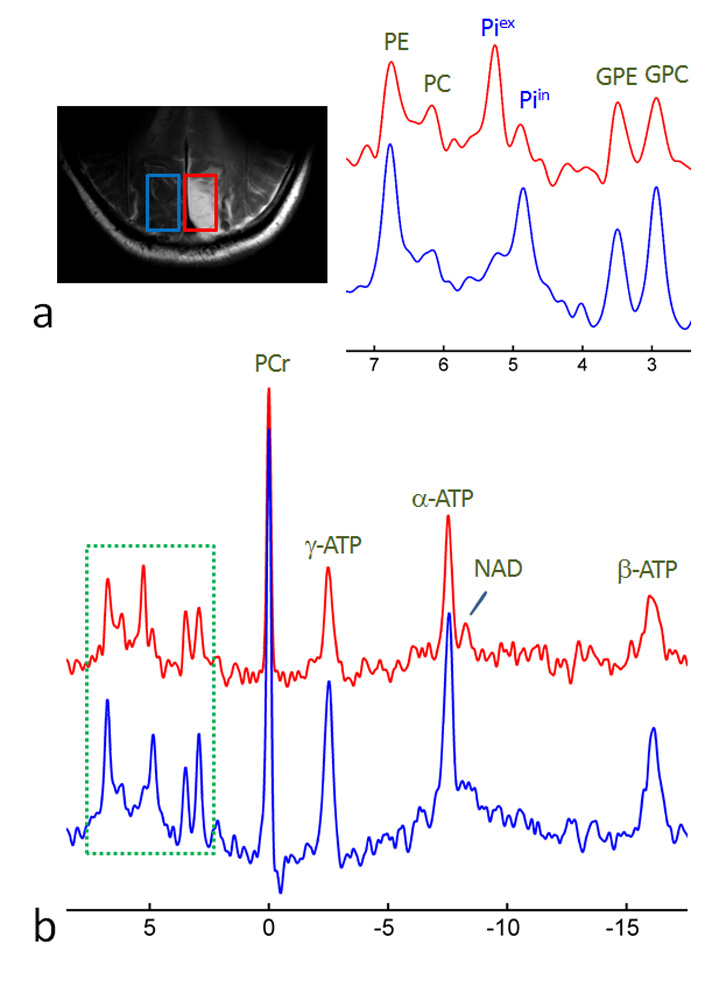
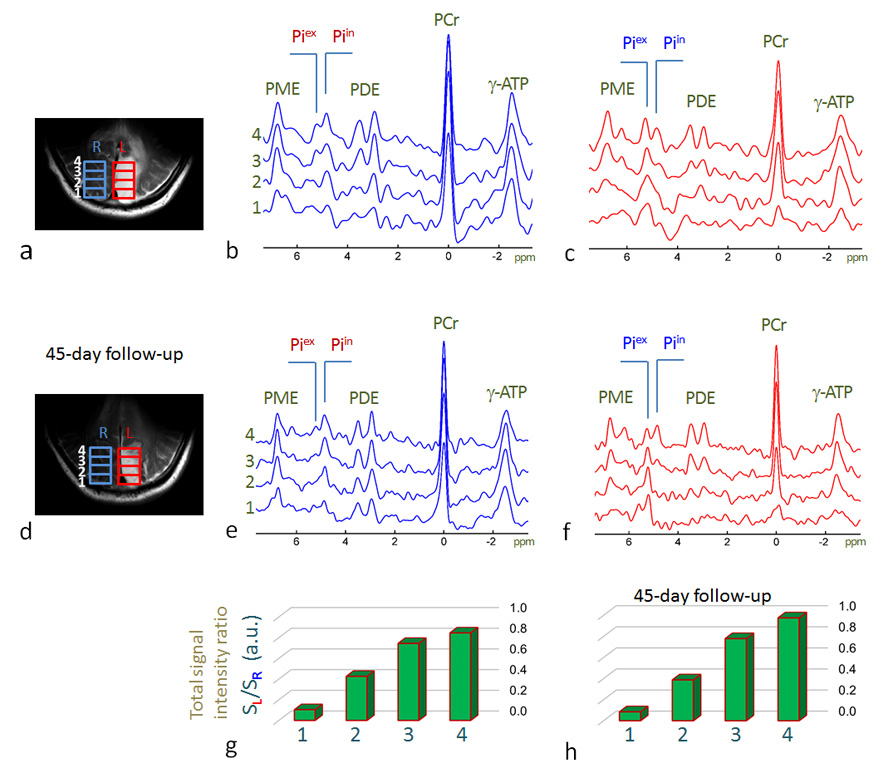
RESULTS and DISCUSSION: Fig.1 shows a representative brain 2D 31P MRSI dataset acquired from a 32-year old healthy subject. The anatomy of the brain is clearly delineated by the 15x15 data matrix, with sharp drop off of 31P signals on the brain edge as transitioning from the tissue (Fig.1b). From the high-res 31P spectral data (Fig.1c-1e) and representative metabolite image maps (Fig.1f for PE, and Fig.1g for GPC), one can easily appreciate the symmetric feature of the P-metabolite distribution along RL dimension and their regional difference along AP dimension. No significant difference in metabolite ratio was found between left and right occipital lobes (PE/ATP: 0.40±0.08 vs 0.41±0.07, PC/ATP: 0.23±0.02 vs 0.24±0.02, Piex/ATP: 0.02±0.01 vs 0.03±0.02, Piin/ATP: 0.24±0.04 vs 0.27±0.03, GPE/ATP: 0.20±0.04 vs 0.20±0.03, GPC/ATP: 0.34±0.04 vs 0.34±0.05, PCr/ATP: 1.12±0.20 vs 1.01±0.21 for n = 4 subjects). In contrast, there is significant difference in Pi/ATP and PC/ATP ratio between these two regions for the stroke patient (Piex/ATP: 0.60±0.14 vs 0.14±0.01, Piin/ATP: 0.12±0.05 vs 0.33±0.12 and PC/ATP: 0.37±0.10 vs 0.17±0.02, see below). Figs.2-4 show the 2D 31P MRSI data collected from this stroke patient, a 40-year old male, who suffered from ischemic insult due to occlusion of posterior cerebral artery in the left branch. The cross-sectional distribution of phosphocreatine PCr and ATP in 31P signal intensity (Fig. 2a and 2b) and 2D map (Fig. 2c and 2d) indicate a diminished energy availability in the lesion tissue located in the left occipital lobe, as compared to the contralateral healthy-looking tissues. As anticipated, there is gross loss of total intracellular metabolites in the lesion, accompanied by the elevation of extracellular Pi (Figs. 3 and 4), evidencing a condition with cell death and concomitant expansion of extracellular volume. Because of high spatial resolution, the 7T 31P MRSI data also reveal uneven distribution among different metabolites within the lesion (Figs.3 and 4), but there was no dramatic change in metabolites over time, as demonstrated by the comparison of initial (Fig.4a-c,g) and follow-up scans after 45 days (Fig.4d-f,h). This is consistent with the stable condition without stroke recurrence for this patient.
CONCLUSIONS:
We have demonstrated the advantage of measuring brain P-metabolites using 31P MRS imaging at 7T. The capability to reveal metabolic abnormalities at high spatial resolution may facilitate the future approval of 7T MRI in clinic applications.
Acknowledgements
This project was supported by the National Center for Research Resources and the National Institute of Biomedical Imaging and Bioengineering of the National Institutes of Health through P41EB015908, DK081186, R37-HL-034557 and P01DK058398, Department of Defense Grant W81XWH-06-2-0046.References
REFERENCES: 1. Shi XF, et al. Decreased brain PME/PDE ratio in bipolar disorder: a preliminary 31P magnetic resonance spectroscopy study. Bipolar Disord. 2015;17(7):743-52. 2. Hinsberger AD, et al, Magnetic resonance imaging volumetric and P-31 magnetic resonance spectroscopy measurements in schizophrenia. J Psych & Neurosc. 1997;22,111–117. 3. Weber-Fahr W, et al. Altered phospholipid metabolism in schizophrenia: a phosphorus 31 nuclear magnetic resonance spectroscopy study. Psychiatry Res. 2013;214(3):365-73. 4. Andrade CS, et al. Widespread pH abnormalities in patients with malformations of cortical development and epilepsy: a phosphorus-31 brain MR spectroscopy study. Brain Dev. 2014;36(10):899-906. 5. Plante DT, et al. Gray matter-specific changes in brain bioenergetics after acute sleep deprivation: a 31P magnetic resonance spectroscopy study at 4 Tesla. Sleep. 2014;37(12):1919-27. 6. Harper DG, et al Tissue Type-Specific Bioenergetic Abnormalities in Adults with Major Depression. Neuropsychopharmacology. 2016 Oct 5. doi: 10.1038/npp.2016.180. 7. Harper DG, et al. Energetic and cell membrane metabolic products in patients with primary insomnia: a 31P magnetic resonance spectroscopy study at 4 tesla. Sleep. 2013;36(4):493-500. 8. Mandal PK, et al. Mapping of hippocampal pH and neurochemicals from in vivo multi-voxel 31P study in healthy normal young male/female, mild cognitive impairment, and Alzheimer's disease. J Alzheimers Dis. 2012;31 Suppl 3:S75-86. 9. Wijnen JP,et al. 31P magnetic resonance spectroscopic imaging with polarisation transfer of phosphomono- and diesters at 3 T in the human brain: relation with age and spatial differences. NMR Biomed. 2010;23(8):968-76.Figures