4646
Baseline of Chemical Exchange Saturation Transfer Imaging for Brain1Graduate School of Biomedical Sciences, Tokushima University, Tokushima, Japan, 2Global MR Applications and Workflow, GE Healthcare, 3Graduate school of Health Science, Tokushima University, 4School of Health Sciences, Tokushiama University, 5School of Health Sciences, Tokushima University
Synopsis
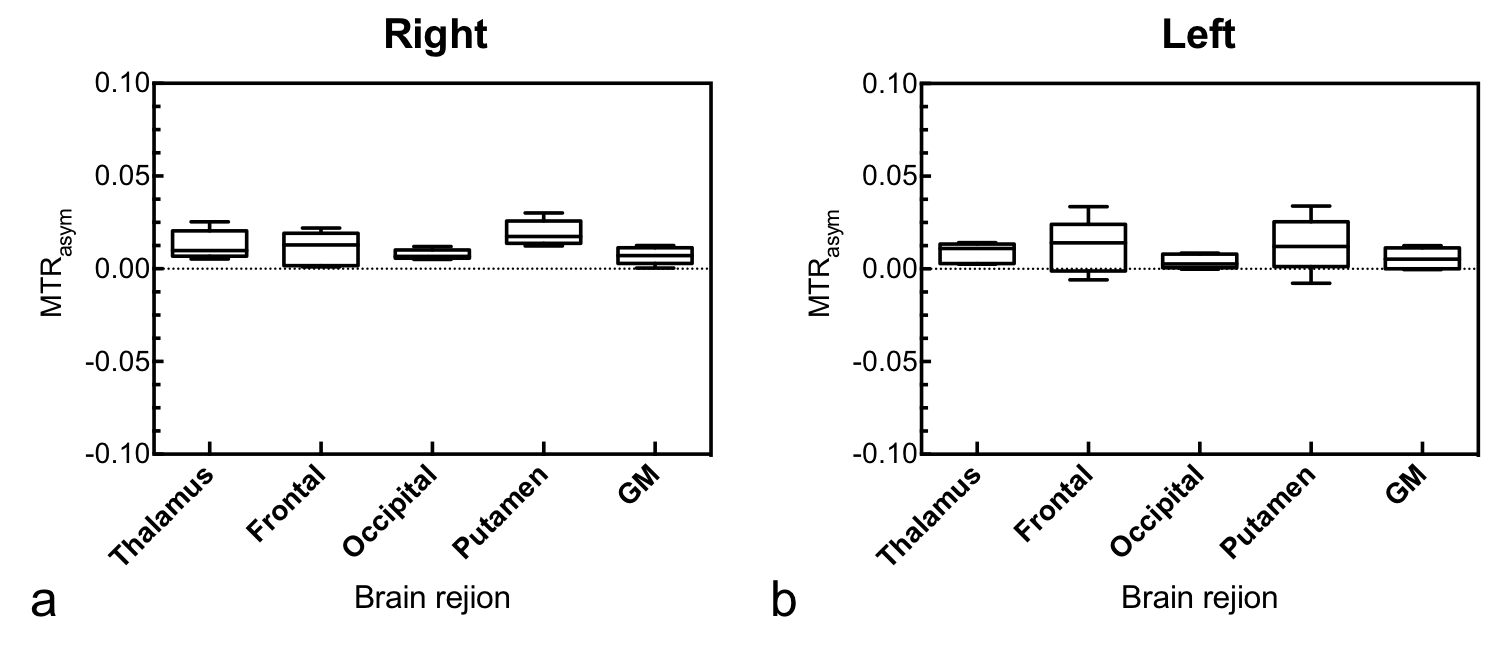
The purpose of this study is to assess the CEST effect and contrast of various brain regions in normal for phase cycle-CEST MR imaging. Subjects were five healthy volunteers. All slice positions were set on the nucleus basalis level. ROIs were set as thalamus, frontal, occipital, putamen, and gray matter on right and left brain hemispheres of each subject There was no significant difference in mean MTRasym values among each brain region (P > 0.01 for all). CEST effects for normal brain tissue had no dependency on region and/or left-right hemispheres.
Introduction
Chemical exchange saturation transfer (CEST) magnetic resonance (MR) imaging has been reported as a useful clinical application for the brain, e.g., tumor and ischemia [1, 2]. Particularly, amide proton transfer (APT) imaging is used for grading brain tumors [3]. On the other hand, pulse sequence and strength of magnetization transfer (MT) pulse using CEST imaging is made different by using a magnetic resonance (MR) scanner and measuring static magnetic field strength (B0) [4]. Until now, little attention has been given to the effect of CEST on normal regions of the brain. Therefore, it is necessary to have more detailed information on this subject, i.e., normal baseline.Purpose
The purpose of this study is to assess the CEST effect and contrast of various brain regions in normal for phase cycle-CEST MR imaging.Materials and Methods
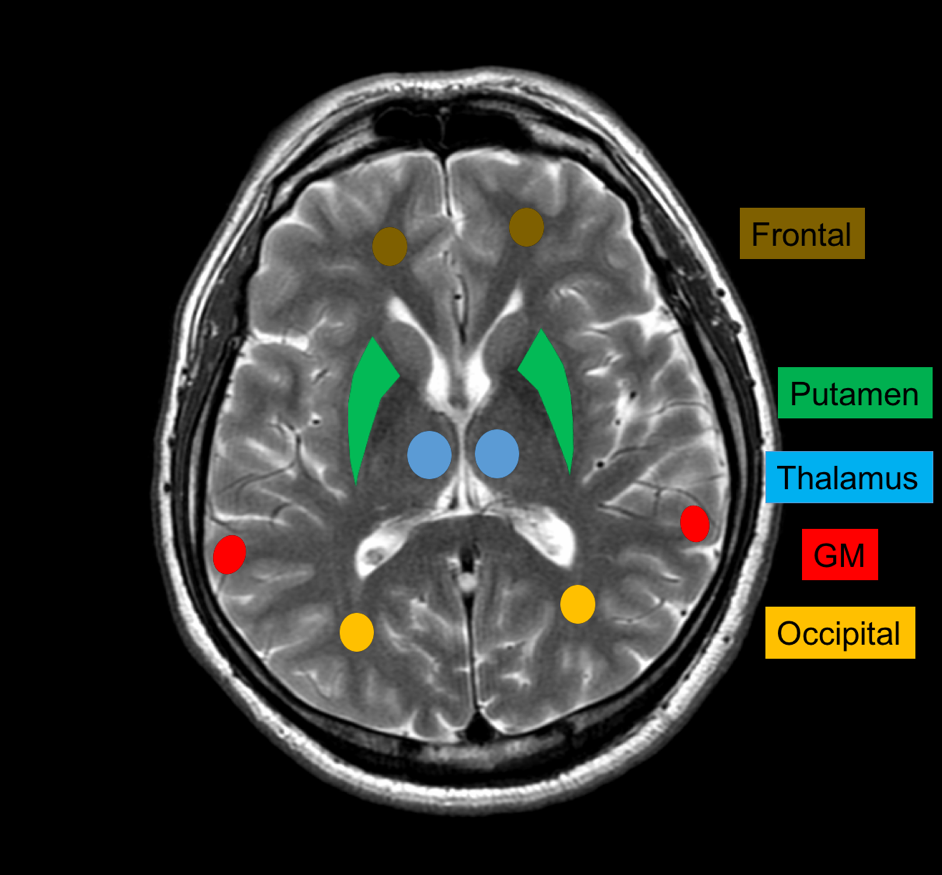
On a 3.0 T MR system (Discovery 750, GE Healthcare), CEST imaging was performed with a specialized echo-planner imaging (EPI) sequence with phase cycle radio frequency (RF) preparation (mean B1, 2μT; total RF irradiation time, 3.5 sec). CEST images were acquired with an offset frequency equivalent to ±7 ppm per 32 steps. The other imaging parameters were echo time, 20.7 ms; repetition time, 3000 ms; bandwidth, 3906 Hz/pixel; field of view, 22 cm; matrix size, 96 × 96; slice thickness, 5 mm. All slice positions were set on the nucleus basalis level. Acquired imaging data were applied to B0 correction for each pixel. Subjects were five healthy volunteers (five men; mean age, 23.8 years; 23-40 years). We set the region-of-interest (ROI) analysis in CEST images with B0 corrected images; the ROIs were set as thalamus, frontal, occipital, putamen, and gray matter (GM) on right and left brain hemispheres of each subject (See Fig.1). We evaluated Z-spectrum, MT ratio asymmetry (MTRasym), and MTRasym image of each subject. MTRasym was calculated as follows [5]: $${ MTR }_{ asym }=MTR\left( +\Delta \omega \right) -MTR\left( -\Delta \omega \right) =\frac { { I }_{ sat }\left( -\Delta \omega \right) -{ I }_{ sat }\left( +\Delta \omega \right) }{ { I }_{ 0 } } ,$$where Isat and I0 are the imaging signal intensities measured with MT pulses at each frequency and at -10ppm frequency (no MT effect was observed), respectively, and ∆ω is frequency offset. Dunn's multiple comparison tests were used to determine the significance of each brain region. Then, a P value of <0.01 was considered statistically significant.Results & Discussions
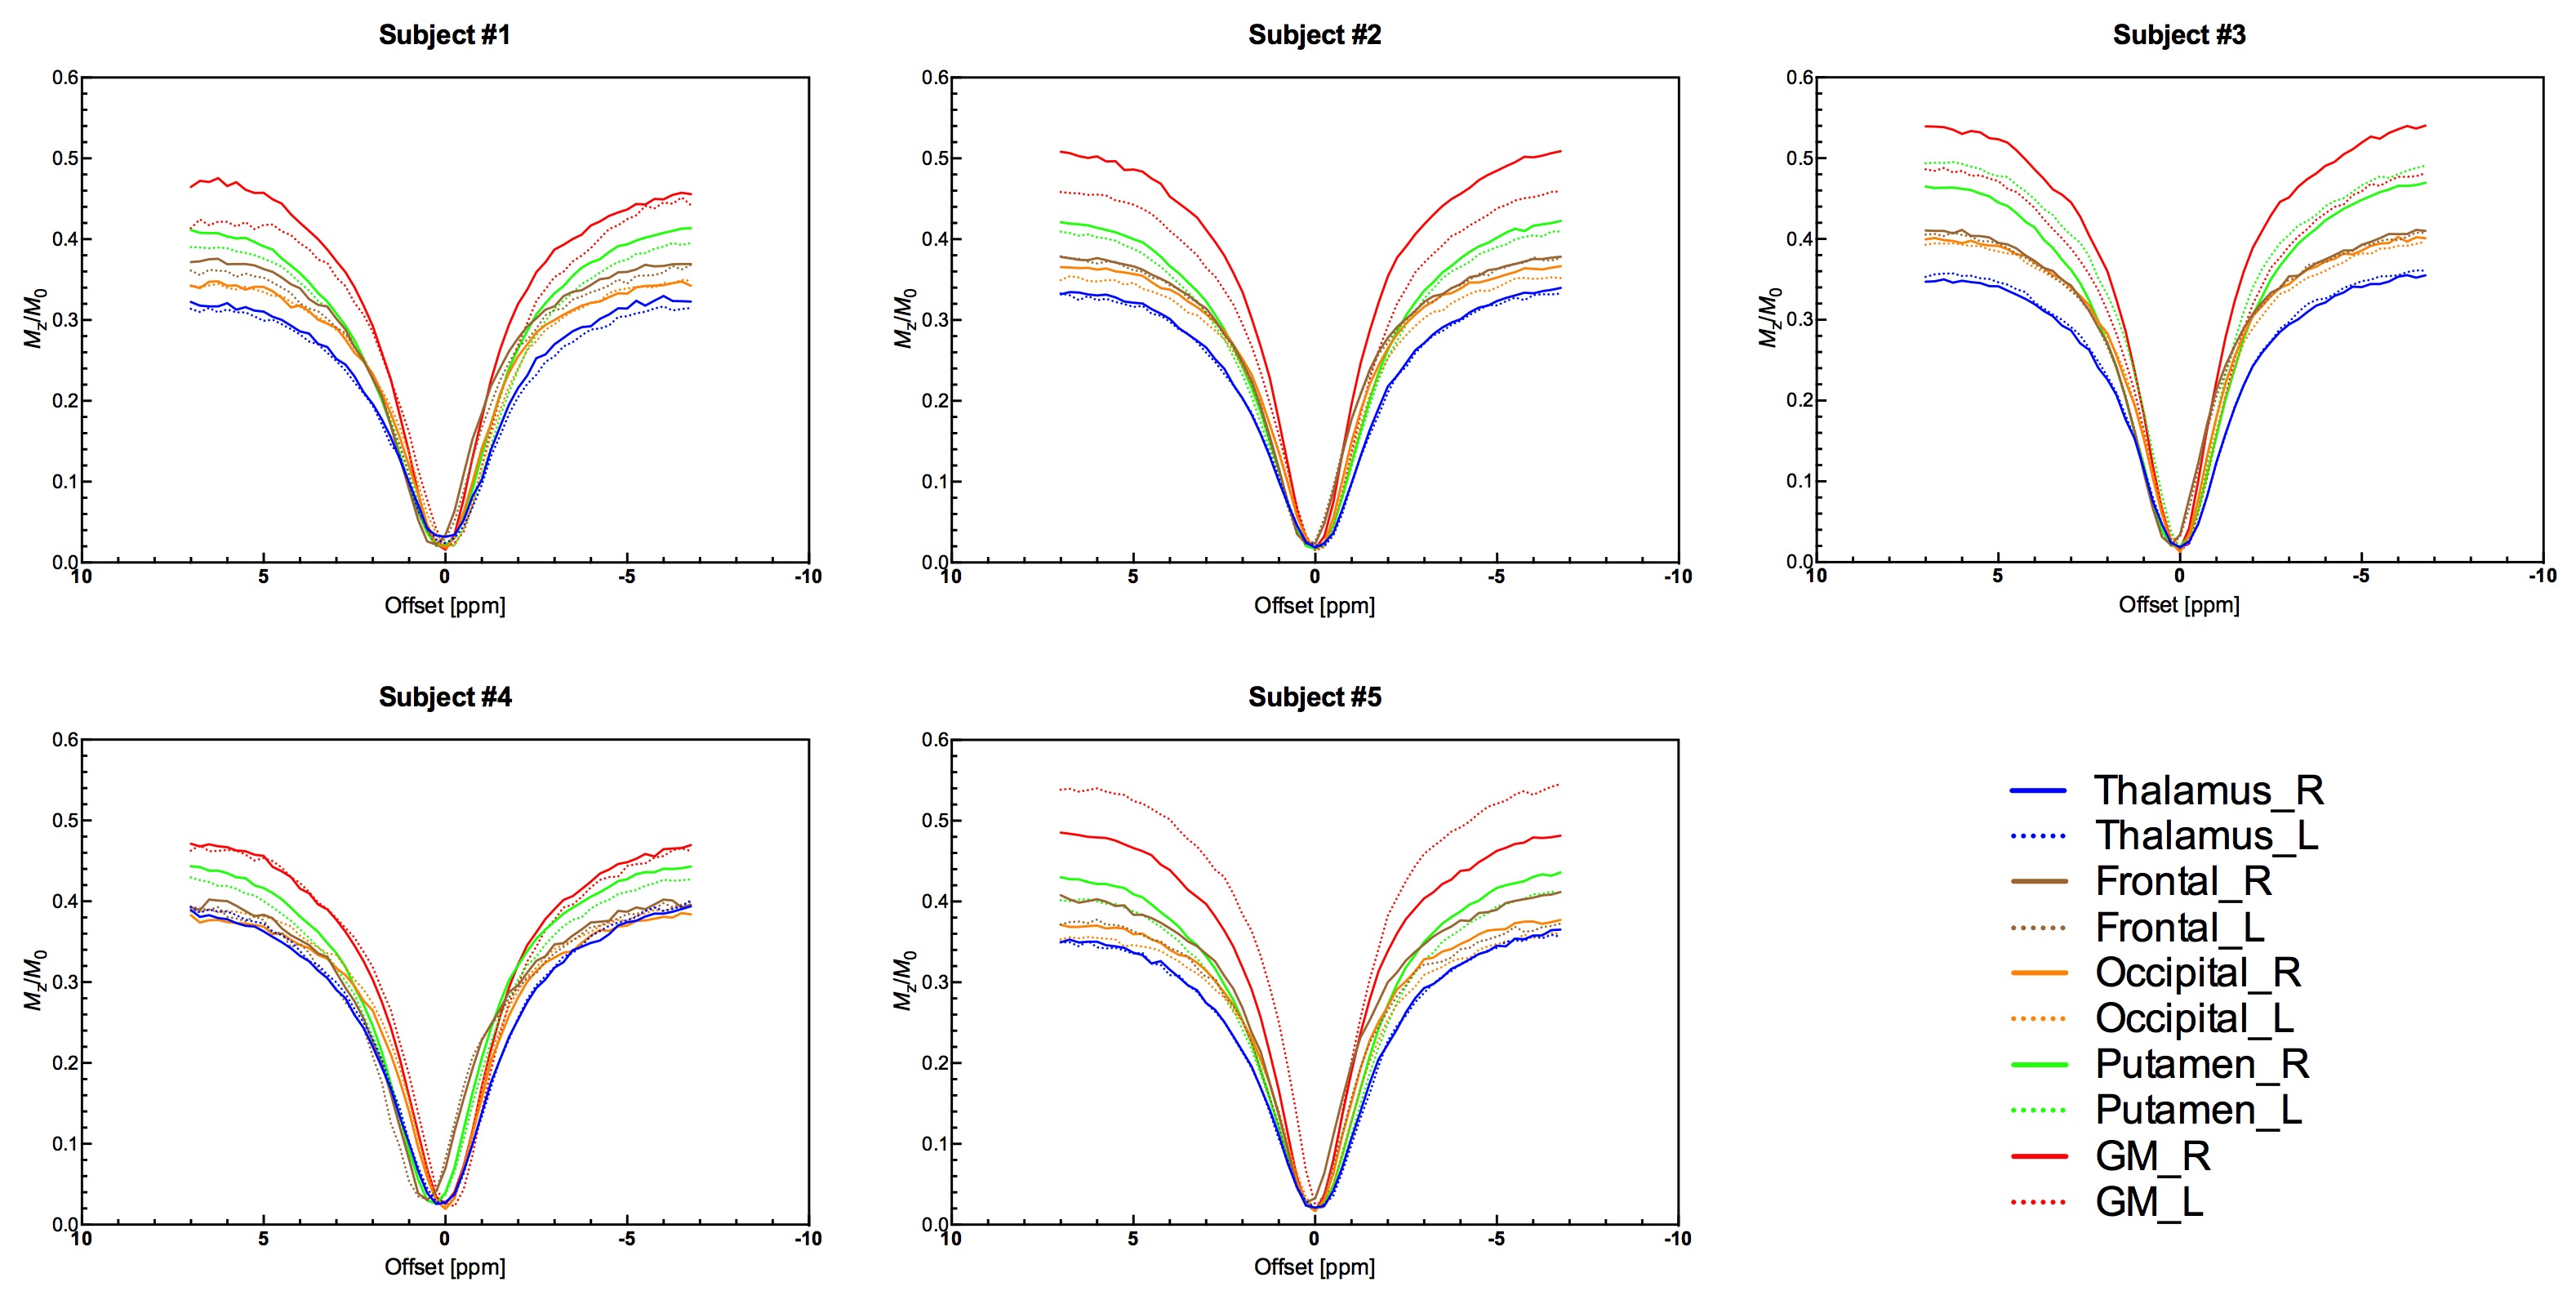
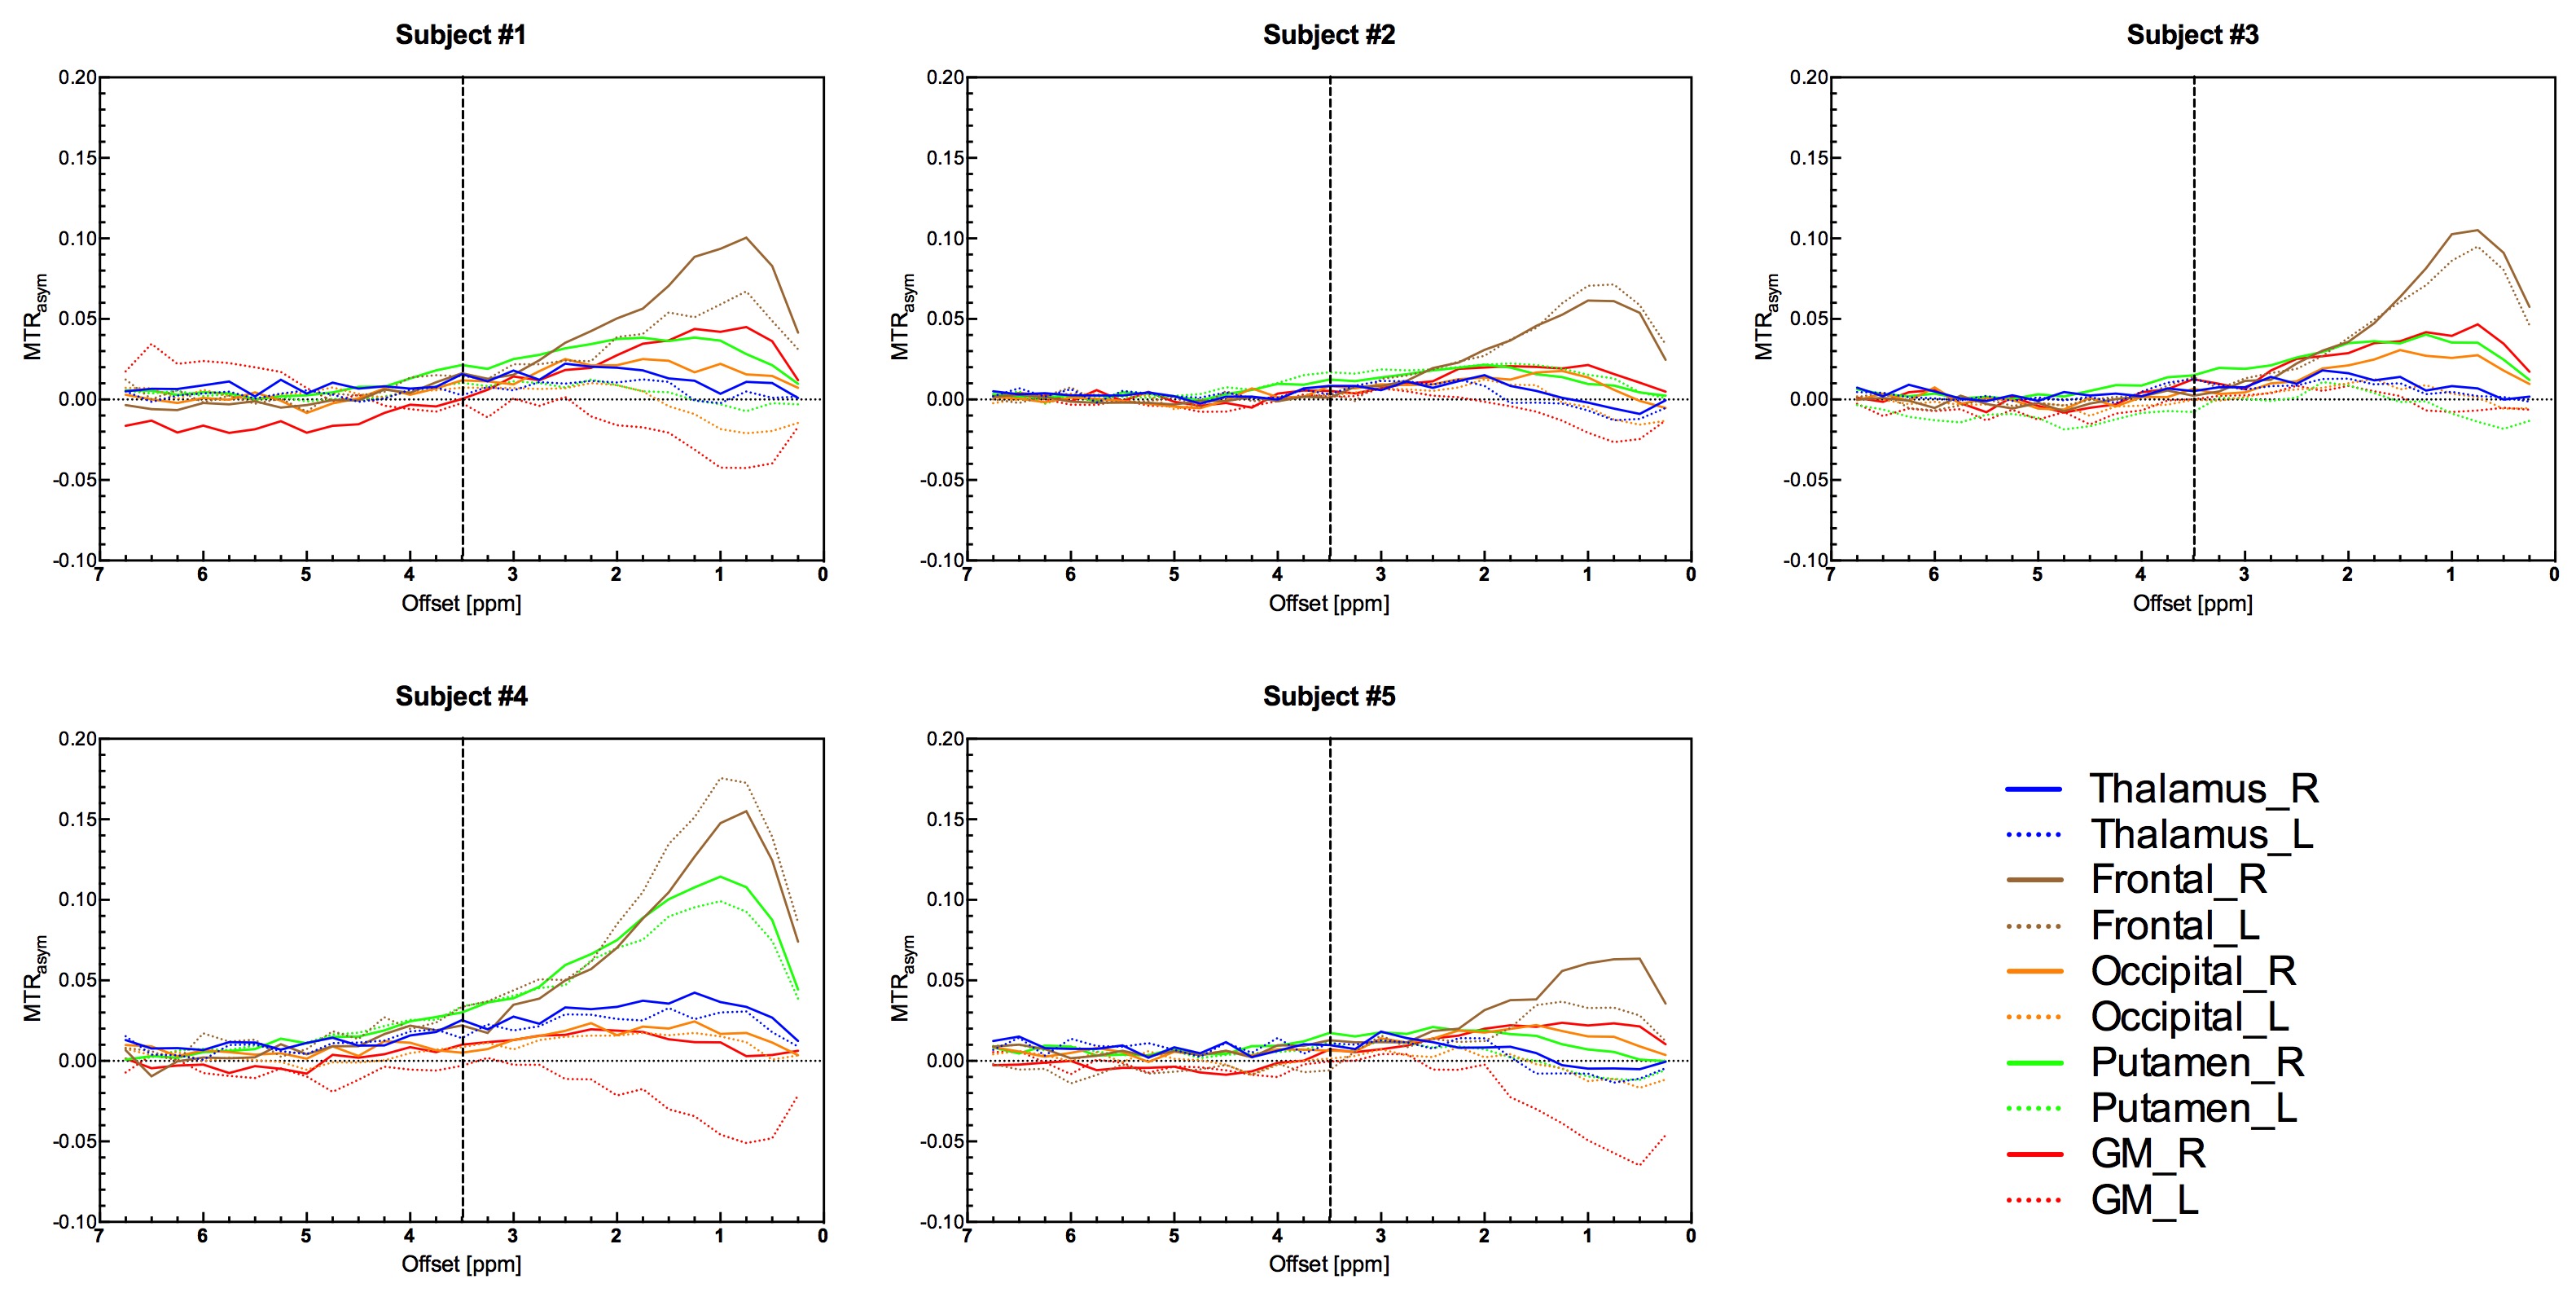
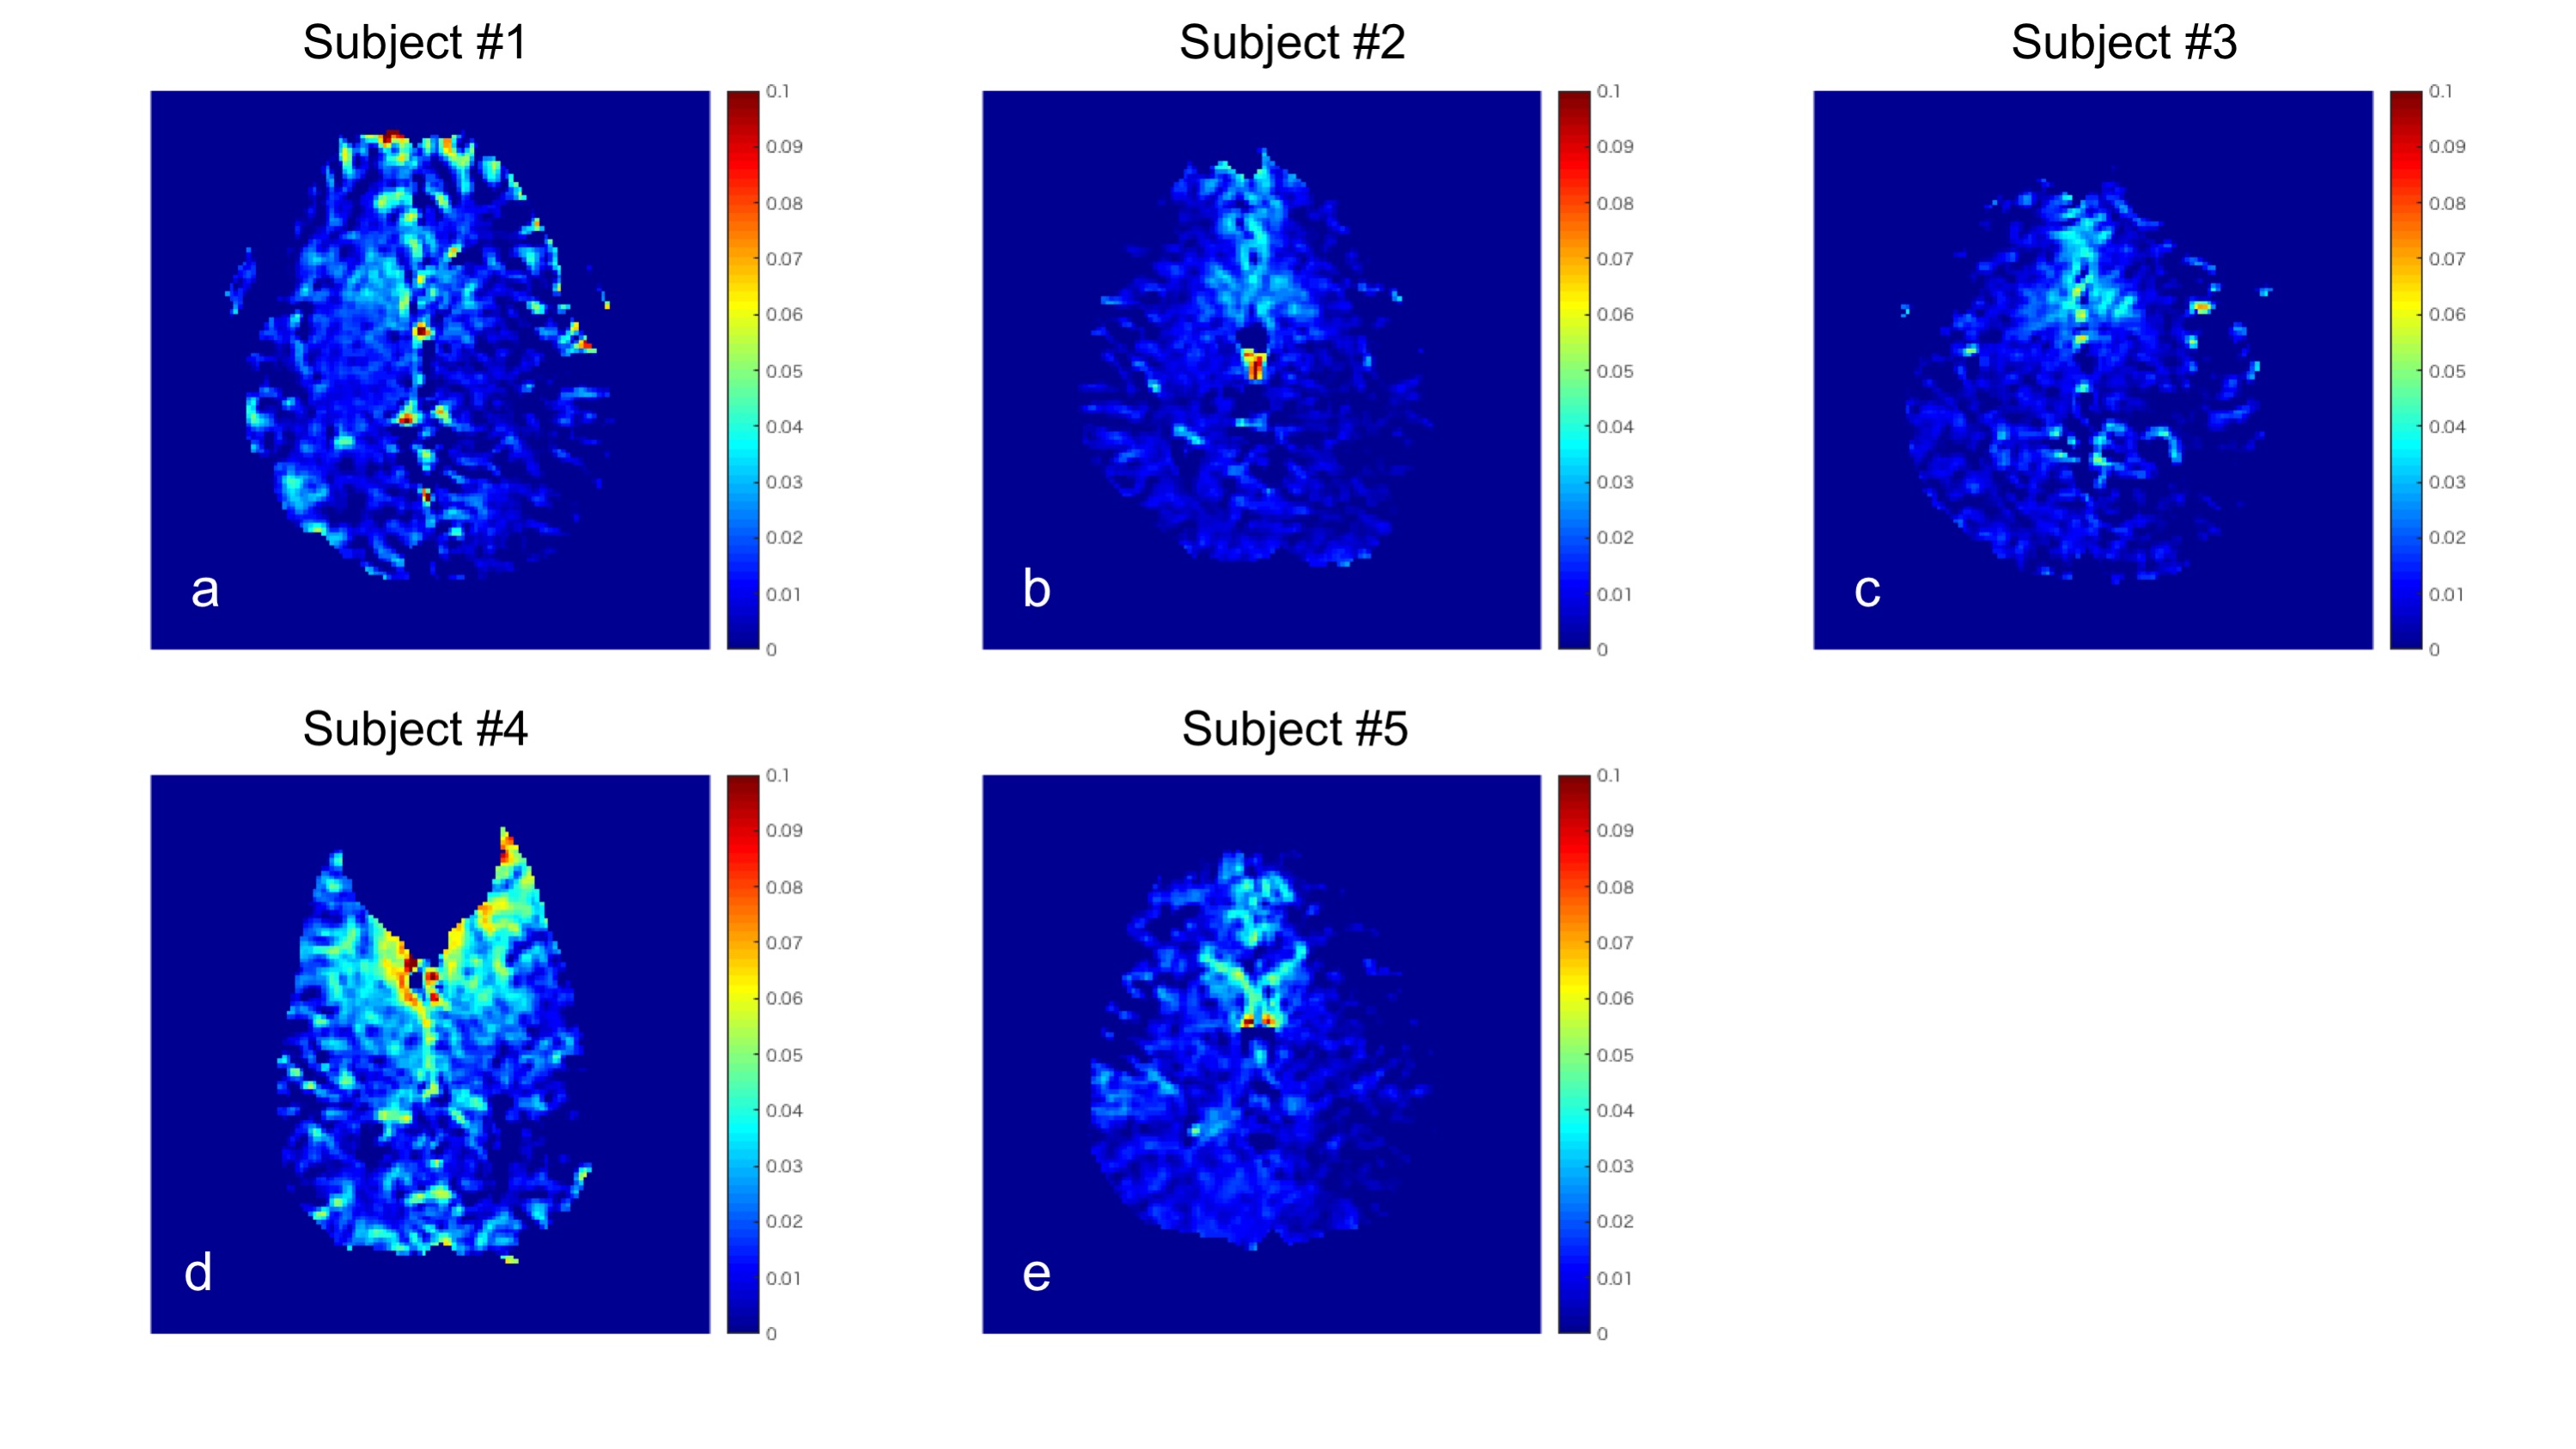
Figure 2 shows Z-spectrums for each subject. Figure 3 shows the relationship between MTRasym curves for each subject. Figure 4 shows MTRasym images at offset frequency 3.0-4.0 ppm for each subject. Figure 5 shows mean MTRasym values at 3.5 ppm for each brain region. There was no significant difference in mean MTRasym values among each brain region (P > 0.01 for all). We will discuss the significance of having a baseline of the CEST effect for healthy volunteers. For result shown in Fig. 4, differences of MTRasym at 3.5 ppm among brain regions and/or to left and right regions were not observed; it is reasonable to hypothesize that APT has only a slight effect on the normal brain. That is to say, abnormal lesions in the brain will lead to CEST signal change because the CEST effect has no dependency on brain region and left-right hemispheres. However, because subject #4 had a susceptibility artifact caused by his implanted tooth, the CEST signals were high around the loss region (Fig. 4d). In this case, the baseline CEST effect may be useless.Conclusion
CEST effects for normal brain tissue had no dependency on region and/or left-right hemispheres. Moreover, the definition of baseline for CEST imaging make it possible to obtain more detailed information for abnormal tissue and metabolism.Acknowledgements
No acknowledgement found.References
[1] Zhou J, Zhu H, Lim M, et al. Three-dimensional amide proton transfer MR imaging of gliomas: Initial experience and comparison with gadolinium enhancement. J Magn Reson Imaging. 2013;38(5):1119-28.
[2] Sun PZ, Murata Y, Lu J, et al. Relaxation-compensated fast multislice amide proton transfer (APT) imaging of acute ischemic stroke. Magn Reson Med. 2008;59(5):1175-82.
[3] Togao O, Yoshiura T, Keupp J, et al. Amide proton transfer imaging of adult diffuse gliomas: correlation with histopathological grades. Neuro Oncol. 2014;16(3):441-8.
[4] Schmitt B1, Zaiss M, Zhou J, et al. Optimization of pulse train presaturation for CEST imaging in clinical scanners. Magn Reson Med. 2011;65(6):1620-9.
[5] Zhou J, Payen J-F, Wilson Da, et al. Using the amide proton signals of intracellular proteins and peptides to detect pH effects in MRI. Nature medicine 2003; 9:1085-90.
Figures