4642
The influence of mild hypercapnia on brain intracellular pH, phosphate metabolites and cerebral blood flow a multinuclear (1H/31P) MR study at 7T.1University of Sheffield, Sheffield, United Kingdom
Synopsis
Permissive hypercapnia is commonly used as vasodilatory challenge in clinical applications and basic research. During fMRI experiments continuous exposure to mild (3-10%) CO2 can be applied to derive stimulus induced changes in the cerebral rate of oxygen consumption (CMRO2) by measuring cerebral blood flow and blood oxygenation dependent (BOLD) signal. Previous data from anesthetized primate during hypercapnia suggested increase in CBF are accompanied by decreases in neuronal activity. In this context, using multinuclear (31P/1H) and multi-parametric MR we show that mild exposure to hypercapnia elevates regional CBF, and can cause marginal but consistent drop in intracellular pH of rat brain, despite constant [ADP ~25-35µM] and [ATP ~3-2.4mM] to that of resting brain. Our findings support the view that unspecific drop in brain pH may likely elevate regional CBF, thereby sustain oxygen supply-to-demand ratio in rat brain.
Introduction
Roy and Sherrington first proposed that cerebral blood flow was regulated to meet the requirements of metabolism (1). However, understanding relationship between regional cerebral blood flow (neurovascular coupling), oxygen supply, and energy metabolism in response to mild hypercapnia remains challenging in patients suffering from progressive neurovascular diseases and in healthy subjects. The use of animal experiments are necessary to resolve the impact of mild hypercapnia on brain intracellular pH, high energy phosphate metabolites and cerebral blood flow (2-4). Here we propose a combination of multinuclear (31P/1H) and multi-parametric MR experiments for delineating mechanisms associated with neurovascular and metabolic demands of brain during mild hypercapnia. We find consistent decrease in PCr/Pi, β-ATP/Pi, γ-ATP/pi ratios and intracellular brain pH, and suggest these parameters can be useful as a potential biomarker for monitoring the onset and progression of permissive hypercapnia in clinics.Method
We study effects of (10% CO2) induced hypercapnia on brain of adult (female-Hooded Lister) rats (weighing 240-340mg). Animals were prepared for MRI experiments as described before (4). A series of 31P MRS, T2*, and ASL (FAIR-EPI) were acquired at 7T (Bruker, Biospec, 30cm horizontal bore). MR data analyses were carried out using Bruker image and spectra processing toolboxes in complement with Matlab, JMRUI and GraphPad.Results and Discussions
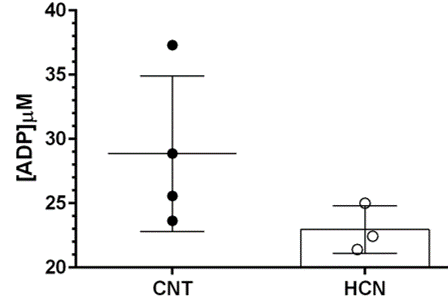
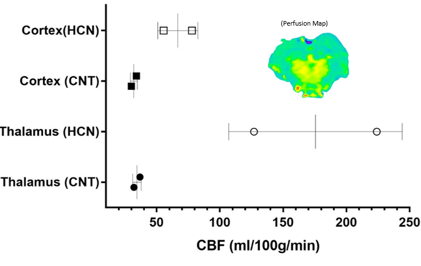
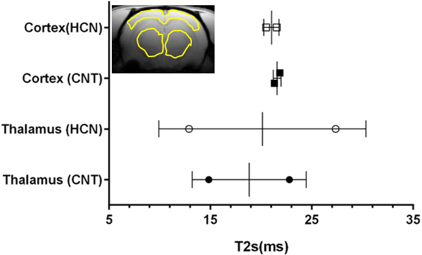
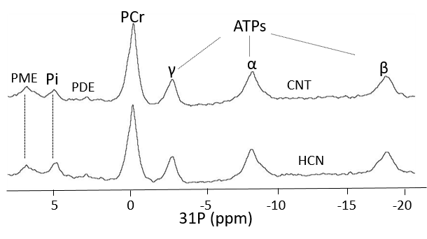
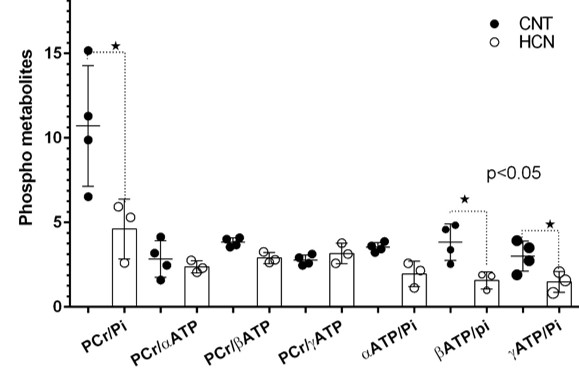
The characteristic fully relaxed rat brain 31P spectra taken during rest (control) and mild hypercapnia (HCN) (10% CO2) were acquired (see Figure 1). All high energy metabolite peaks visible in the spectra were labelled as described before (5). The changes in metabolite ratios of PCr/Pi, PCr/ATPs, and ATPs/Pi were derived as described before (5) (see Figure 2). From the 31P s analyses pf 31P spectra we show significant drop in PCr/Pi, β-ATP/Pi and γ-ATP/Pi during hypercapnia (HCN) (p<0.05), total ATP remains constant. Interestingly, marginal but consistent drop in intracellular pH (p<0.05) were derived as described before (5) (see Figure 3). However, no significant changes were observed in the peak areas of PME or β-ATP. Interestingly, we show minimal variations in free [ADP] levels in two conditions, rest (CNT) and hypercapnia (HCN) (see Figure 4). Using ASL we show elevation in regional cerebral blood flow (rCBF) in the thalamus and cortex during hypercapnia (see Figure 6). However, T2* values in the cortex during hypercapnia remain consistently similar (see Figure 7), suggesting minimal differences in available oxygen reserves in the cortex.Conclusion
Our studies suggest that an elevation of partial pressure of CO2 (pCO2) due to hypercapnia increases CBF in the thalamus and cortex of rat brain. This can be explained by an unspecific but consistent drop in the brain pH. Furthermore, our results in the living rat support the view that brain (intracellular) pH regulation during mild hypercapnia likely require time dependent processes in the order of minutes. One such process is transmembrane ion transport, which is known to be associated with pH changes in neural tissue (6).Acknowledgements
References
1. Roy, C. S., and Sherrington, C. S. (1890) On the Regulation of the Blood-supply of the Brain. The Journal of physiology 11, 85-158 117
2. Zappe, A. C., Uludag, K., and Logothetis, N. K. (2008) Direct measurement of oxygen extraction with fMRI using 6% CO2 inhalation. Magnetic resonance imaging 26, 961-967
3. Zappe, A. C., Uludag, K., Oeltermann, A., Ugurbil, K., and Logothetis, N. K. (2008) The influence of moderate hypercapnia on neural activity in the anesthetized nonhuman primate. Cerebral cortex 18, 2666-2673
4. Kennerley, A. J., Harris, S., Bruyns-Haylett, M., Boorman, L., Zheng, Y., Jones, M., and Berwick, J. (2012) Early and late stimulus-evoked cortical hemodynamic responses provide insight into the neurogenic nature of neurovascular coupling. Journal of cerebral blood flow and metabolism : official journal of the International Society of Cerebral Blood Flow and Metabolism 32, 468-480
5. Nishimura, M., Johnson, D. C., Hitzig, B. M., Okunieff, P., and Kazemi, H. (1989) Effects of hypercapnia on brain pHi and phosphate metabolite regulation by 31P-NMR. Journal of applied physiology 66, 2181-2188
6. Thomas, R. C. (1974) Intracellular pH of snail neurones measured with a new pH-sensitive glass mirco-electrode. The Journal of physiology 238, 159-180
Figures

Cerebral pH in a separate set of rats during hypercapnia 10% CO2 (HCN=3) and rest (CNT=4). Cerebral pH values were derived from pi and PCr chemical shift differences as described before (5). Consistent drop in the cerebral pH can be seen in response to mild hypercapnia (10% CO2).