4639
Proton Spectroscopic Imaging of Secondary Progressive Multiple Sclerosis in the MS-SMART trial1Centre for Clinical Brain Sciences, University of Edinburgh, Edinburgh, United Kingdom, 2Centre for Cardiovascular Sciences, University of Edinburgh, Edinburgh, United Kingdom, 3Clinical Research Imaging Centre, University of Edinburgh, Edinburgh, United Kingdom, 4Queen Square Multiple Sclerosis Centre, Department of Neuroinflammation, UCL Institute of Neurology, University College London, London, United Kingdom, 5Dental Translational and Clinical Research Unit, School of Dentistry, Faculty of Medicine and Health, University of Leeds, Leeds, United Kingdom, 6Department of Neurology, Barts and the London NHS Trust, London, United Kingdom, 7UCL Institute of Neurology, Queen Square MS Centre, University College London, London, United Kingdom, 8Department of Brain and Behavioural Sciences, University of Pavia, Pavia, Italy, 9Brain MRI 3T Mondino Research Center, C. Mondino National Neurological Institute, Pavia, Italy, 10Edinburgh Clinical Trials Unit, Usher Institute of Population Health Sciences and Informatics, University of Edinburgh, Edinburgh, United Kingdom, 11Division of Health Sciences, University of Warwick, United Kingdom, 12Institute for Science and Technology in Medicine, Keele University, United Kingdom, 13Academic Department of Neuroscience, Royal Hallamshire Hospital, Sheffield, United Kingdom
Synopsis
1H MR Spectroscopy yields metabolic information and has proved to be a useful addition to structural imaging in neurological diseases. We applied short-TE Spectroscopic Imaging combined with linear modelling with respect to brain tissue type in a homogeneous cohort of 42 patients with Secondary Progressive Multiple Sclerosis. Metabolite levels were significantly different in lesions compared with normal appearing tissues, suggesting axonal damage (reduced NAA) and increased glial activity (increased myo-inositol) yet relatively stable lesions (reduced Glx).
Introduction
Multiple Sclerosis (MS) is a disabling neurological disease affecting some 2.5 million people worldwide (www.mstrust.org.uk). There are no proven treatments for the progressive stage of MS, during which disability accumulates irreversibly. In clinical trials of potential disease modifying therapies the standard outcome measure is disability score. In imaging studies, lesion load and brain atrophy are widely used biomarkers. More advanced MRI methods enable estimation of myelin status through white matter connectivity and magnetisation transfer imaging1. Complementary information on neuronal integrity is available from 1H MR spectroscopic studies of brain metabolites. In particular, N-acetyl aspartate (NAA) is regarded as a neuronal marker, choline is associated with cell membrane turnover, and myo-inositol (mI) is associated with glial activity. In this work we applied spectroscopic imaging (MRSI) with a short echo-time (short-TE) to investigate metabolite levels in normal appearing tissue and lesions in a cohort of patients with secondary progressive multiple sclerosis (SPMS).
Methods
42 patients (age 55±8; 29 F) with SPMS (EDSS score 6±0.7) were recruited as part of a multicentre study of disease modifying therapies. At baseline, the patients underwent MRI examination at 3T (Siemens Verio), including T1w, T2w and FLAIR scans and proton semi-LASER MRSI2 with TR/TE of 2000/43ms. A single slice of 12×12 1mL voxels was prescribed on the T2w image immediately above the lateral ventricles, parallel to the AC-PC line. The structural scans were segmented to generate tissue probability maps for CSF, GM, WM and lesions within each spectroscopic voxel (Fig 1). Voxels judged to have poor quality spectra (e.g. with distorted baselines) were discarded. Spectroscopic data were analysed in LCModel3. The concentrations (in Institutional Units) and ratios of the metabolites NAA, choline, creatine, myo-inositol and Glx (glutamate + glutamine) were subjected to linear modelling in SPSS. Voxels were regarded as independent measurements with tissue probabilities as fixed effects and subjects as random effects.
Results
A total of 4160 spectroscopic voxels were located wholly in brain tissue and passed the visual test of spectral quality. Representative fitted spectra are shown in Fig 2. Tissue probabilities averaged across all subjects were GM 31%, WM 56% and lesions 3%, with the balance being CSF. No difference was found between creatine levels in different tissue types, and so here we report metabolite ratios with respect to creatine as an ‘internal standard’4. The principal findings (all p<0.05) (Fig 3) were that NAA/creatine was higher in WM than GM (1.60±0.02 vs 1.49±0.02) and substantially lower in lesions (1.15±0.05); Cho/Cre was higher in WM (0.28±0.005) and lesions (0.31±0.01) than in GM (0.21±0.005); myoInositol/creatine was higher in WM than GM (0.41±0.01 vs 0.34±0.01), and substantially higher in lesions (0.61±0.02); Glx/creatine was higher in GM than WM (1.31±0.02 vs 1.23±0.02) and substantially less in lesions (1.05±0.05). EDSS was not correlated with any per-patient metabolite measures, probably because of the narrow range of EDSS scores in this cohort.
Discussion
Short-TE MRSI coupled with tissue segmentation enabled measurement of brain metabolites in normal appearing GM and WM and lesions in this homogeneous cohort of patients with SPMS. The relative metabolite levels between GM and WM are consistent with recent reports in healthy volunteers5. Although lesions accounted for a small proportion of the included tissue (mean 3%), we were able to demonstrate significant differences in metabolite levels between lesion and normal appearing tissue. Our findings of reduced NAA and increased mI in lesions are consistent with previous reports6 and imply axonal damage and increased glial activity respectively. The higher Choline in both lesions and WM relative to GM could be interpreted in two ways: either that the lesions are not particularly active, or that disease processes are ongoing in the normal-appearing WM. Whilst others7 have found increased Glx in acute lesions but not in chronic lesions, we found a significant reduction (relative to GM and WM), suggesting that the lesions in this SPMS cohort are relatively stable. Future methodological refinements to augment the visual test of spectral quality would include use of Cramer-Rao Lower Bounds, Signal-to-Noise Ratio and/or linewidth. Absolute quantification of metabolites may also be possible. Longitudinal studies are necessary to establish the usefulness of short-TE MRSI in monitoring disease progression and treatment.
Acknowledgements
This independent research is awarded by the Efficacy and Mechanism Evaluation Programme (EME), funded by the Medical Research Council (MRC) and the Multiple Sclerosis Society (MS Society), and managed by the National Institute for Health Research (NIHR) on behalf of the MRC-NIHR partnership. Imaging (Edinburgh CRF reference E131282) was carried out at the Clinical Research Imaging Centre, Edinburgh Imaging, (www.ed.ac.uk/edinburgh-imaging), University of Edinburgh, part of the SINAPSE collaboration (www.sinapse.ac.uk). The MRSI sequence was provided by Siemens as a Works in Progress package.
References
1. Miller DH, Thompson AJ, Filippi M. Magnetic resonance studies of abnormalities in the normal appearing white matter and grey matter in multiple sclerosis. J Neurol 250; 1407-1419 (2003).
2. Sheenen TWJ, Klomp DWJ, Wijnen JP, Heerschap A. Short echo time 1H-MRSI of the human brain at 3T with minimal chemical shift displacement error using adiabatic refocusing pulses. Magn Reson Med 59; 1-6 (2008).
3. Provencher SW. Estimation of metabolite concentrations from localized in vivo proton NMR spectra. Magn Reson Med 30; 672-679 (1993).
4. Caramanos Z, DiMaio S, Narayanan S, Lapierre Y, Arnold DL. 1H-MRSI evidence for cortical gray matter pathology that is independent of cerebral white matter lesion load in patients with secondary progressive multiple sclerosis. J Neurolog Sci 282: 72-79 (2009).
5. Parikh J, Thrippleton MJ, Murray C, Armitage PA, Harris BA, Andrews PJD, Wardlaw JM, Starr JM, Deary IJ, Marshall I. Proton spectroscopic imaging of brain metabolites in basal ganglia of healthy older adults. Magn Reson Mater Phy 28; 251-257 (2015).
6. Kapeller P, Brex PA, Chard D, Dalton C, Griffin CM, McLean MA, Parker GJM, Thompson AJ, Miller DH. Quantitaive 1H MRS imaging 14 years after presenting with a clinically isolated syndrome suggestive of multiple sclerosis. Multiple Sclerosis 8; 207-210 (2002).
7. Srinivasan R, Sailasuta N, Hurd R, Pelletier D. Evidence of elevated glutamate in multiple sclerosis using magnetic resonance spectroscopy at 3T. Brain 128; 1016-1025 (2005).
Figures
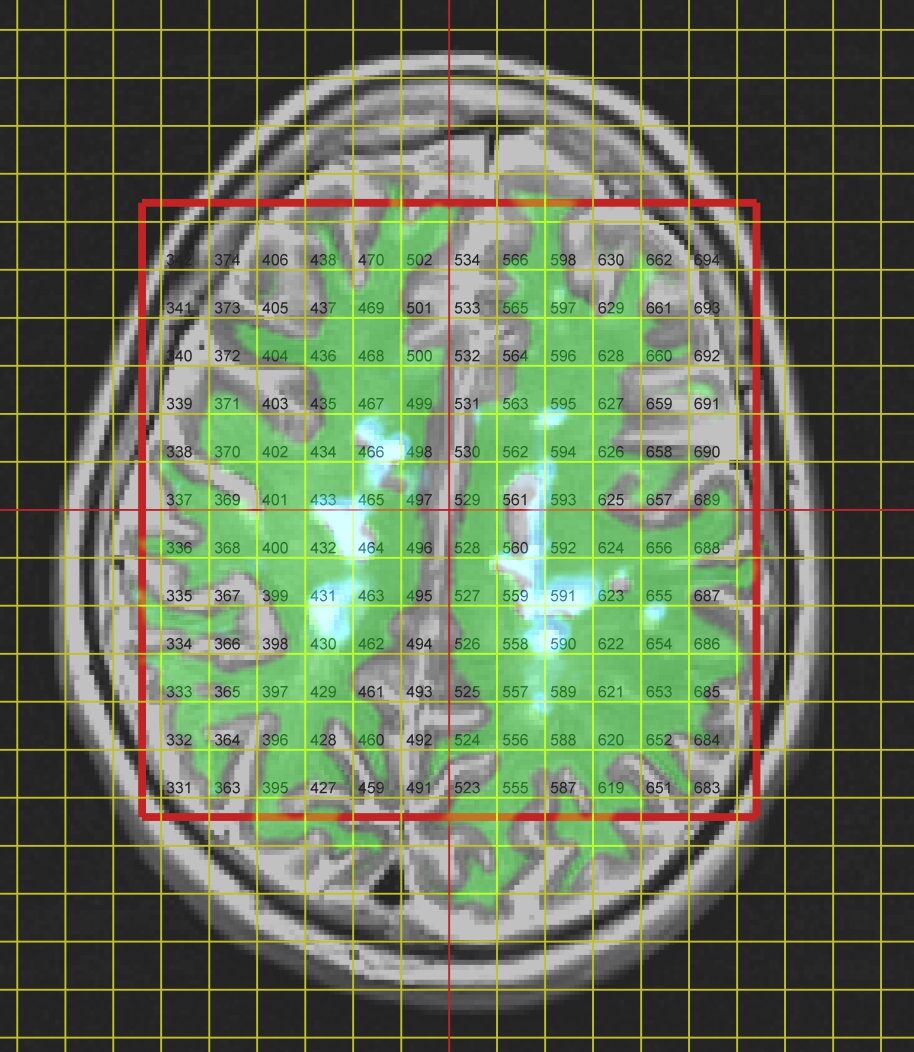
Figure 1. MRSI grid and tissue segmentations overlaid on the T2w image for a representative patient. Green indicates white matter; pale blue indicates lesions.
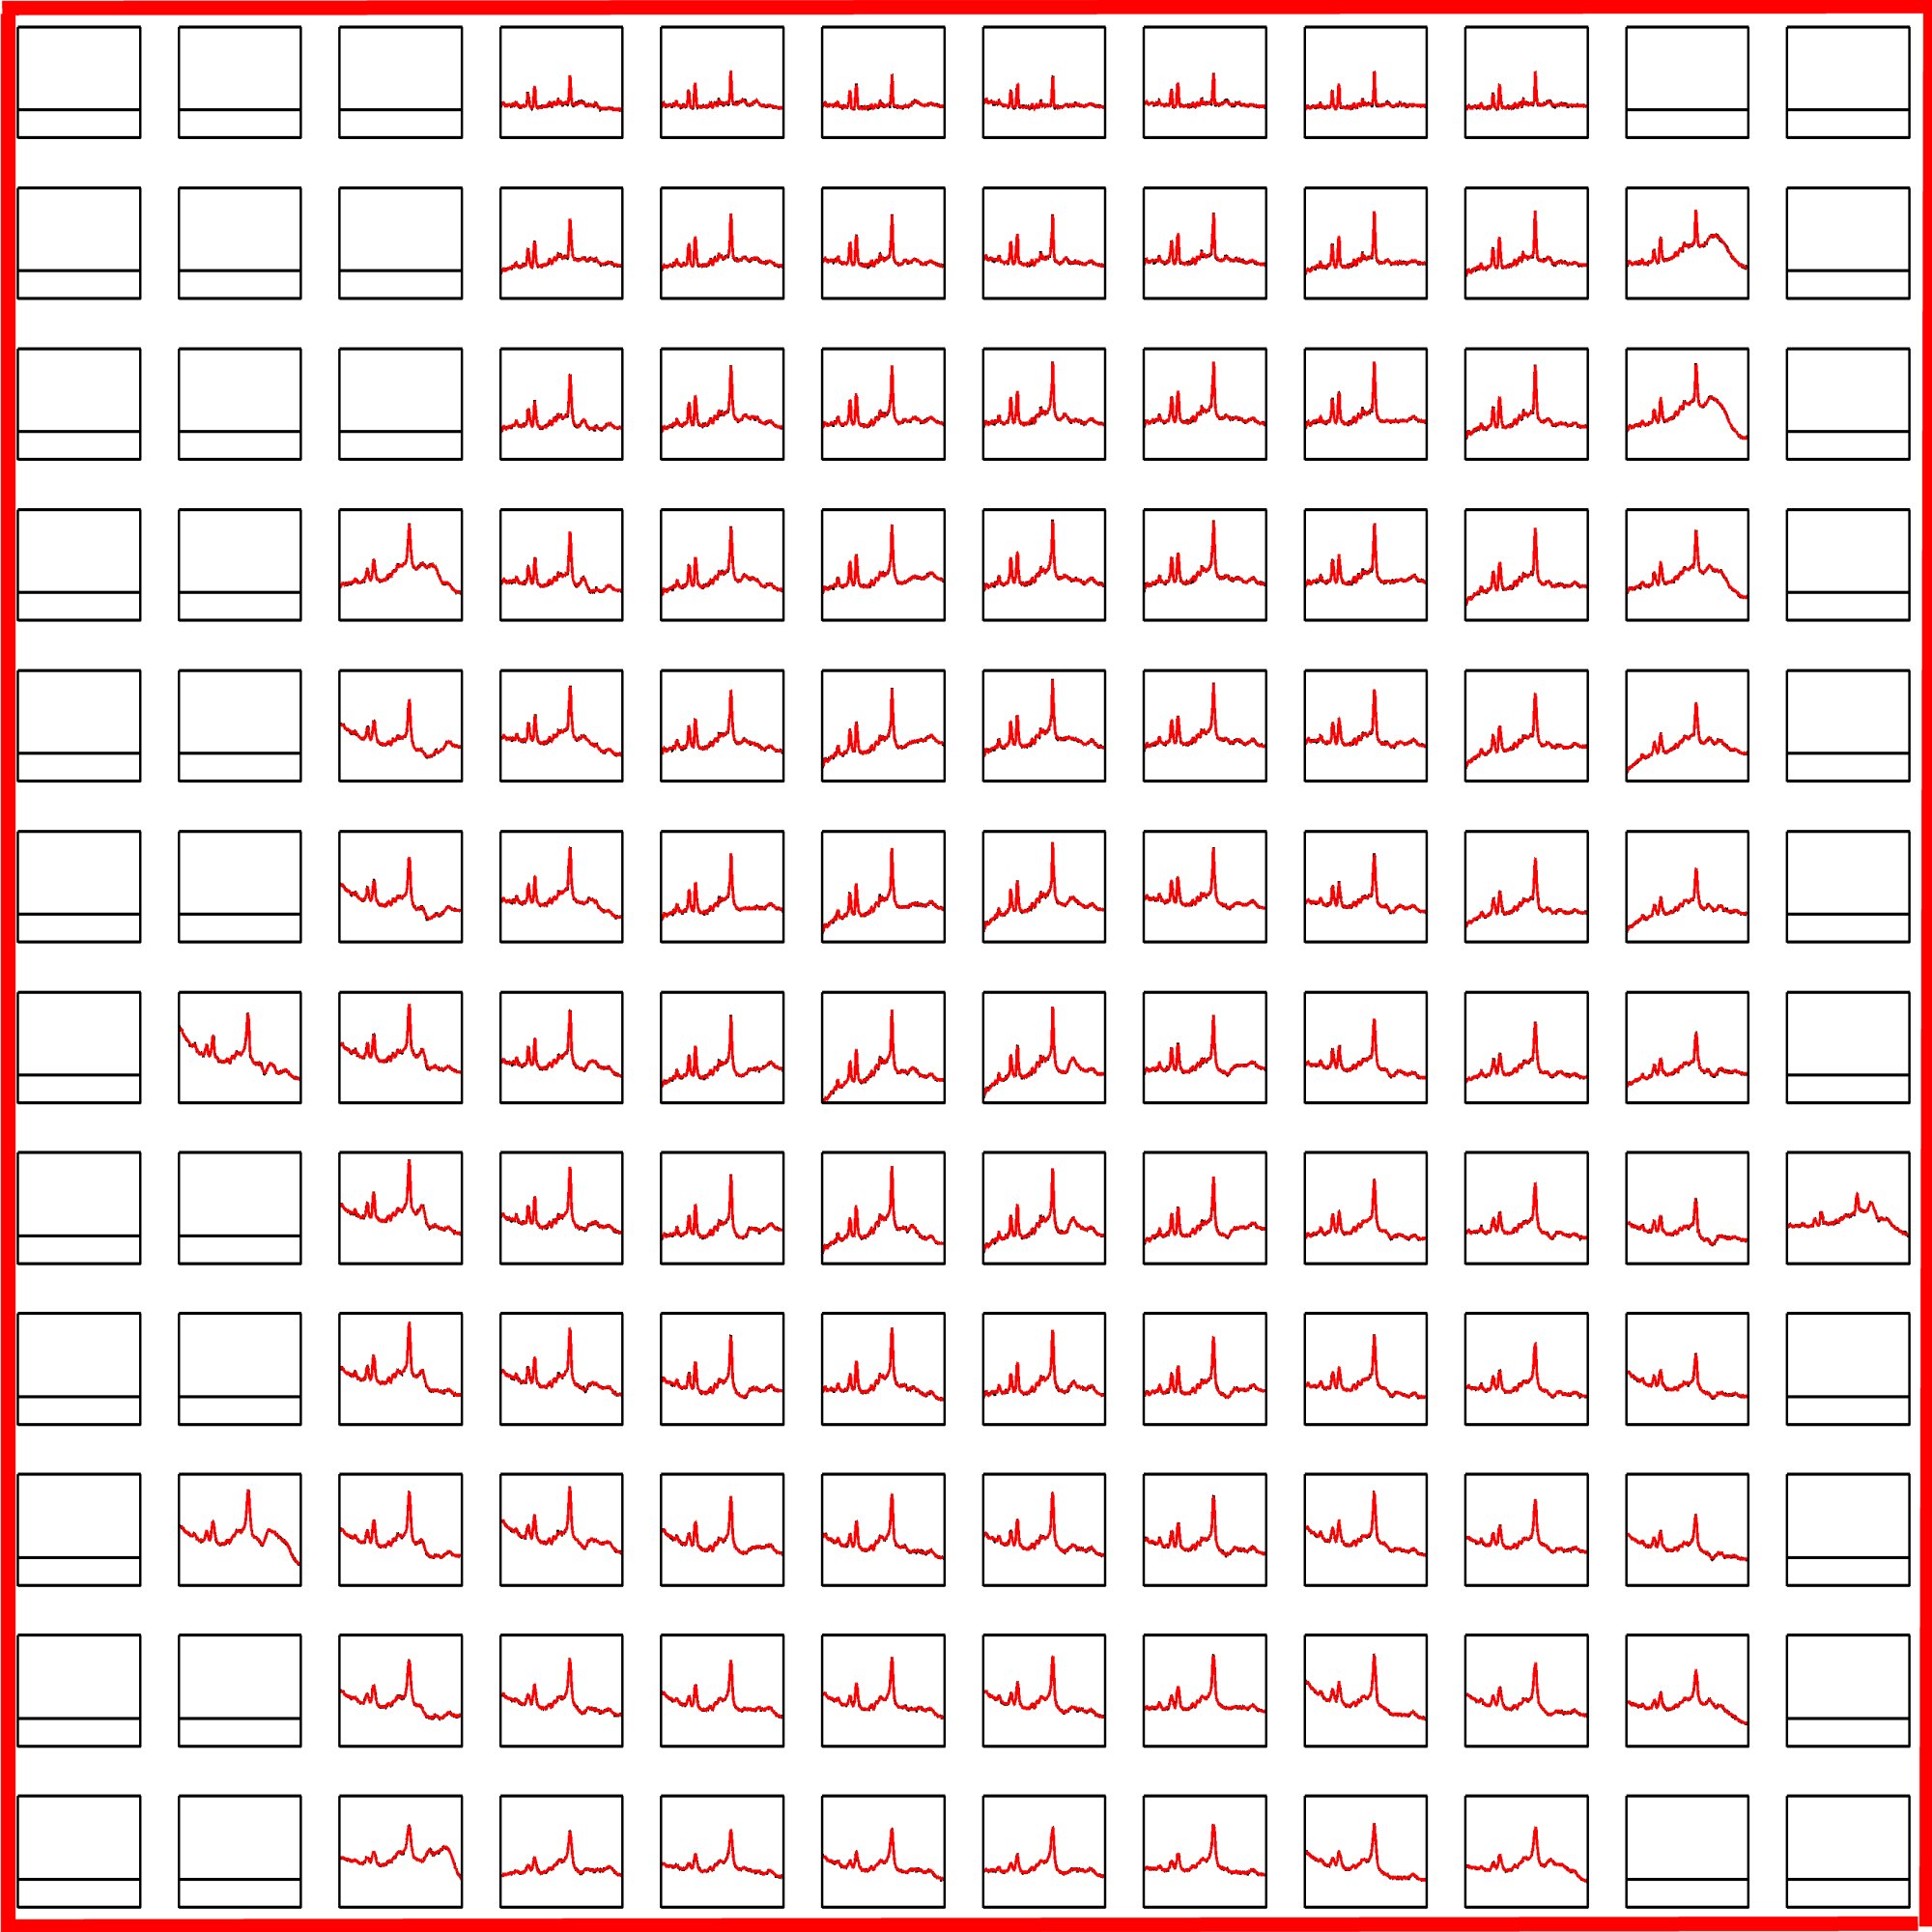
Figure 2. Spectra passing visual inspection and fitted by LCModel for the same patient as in Figure 1.
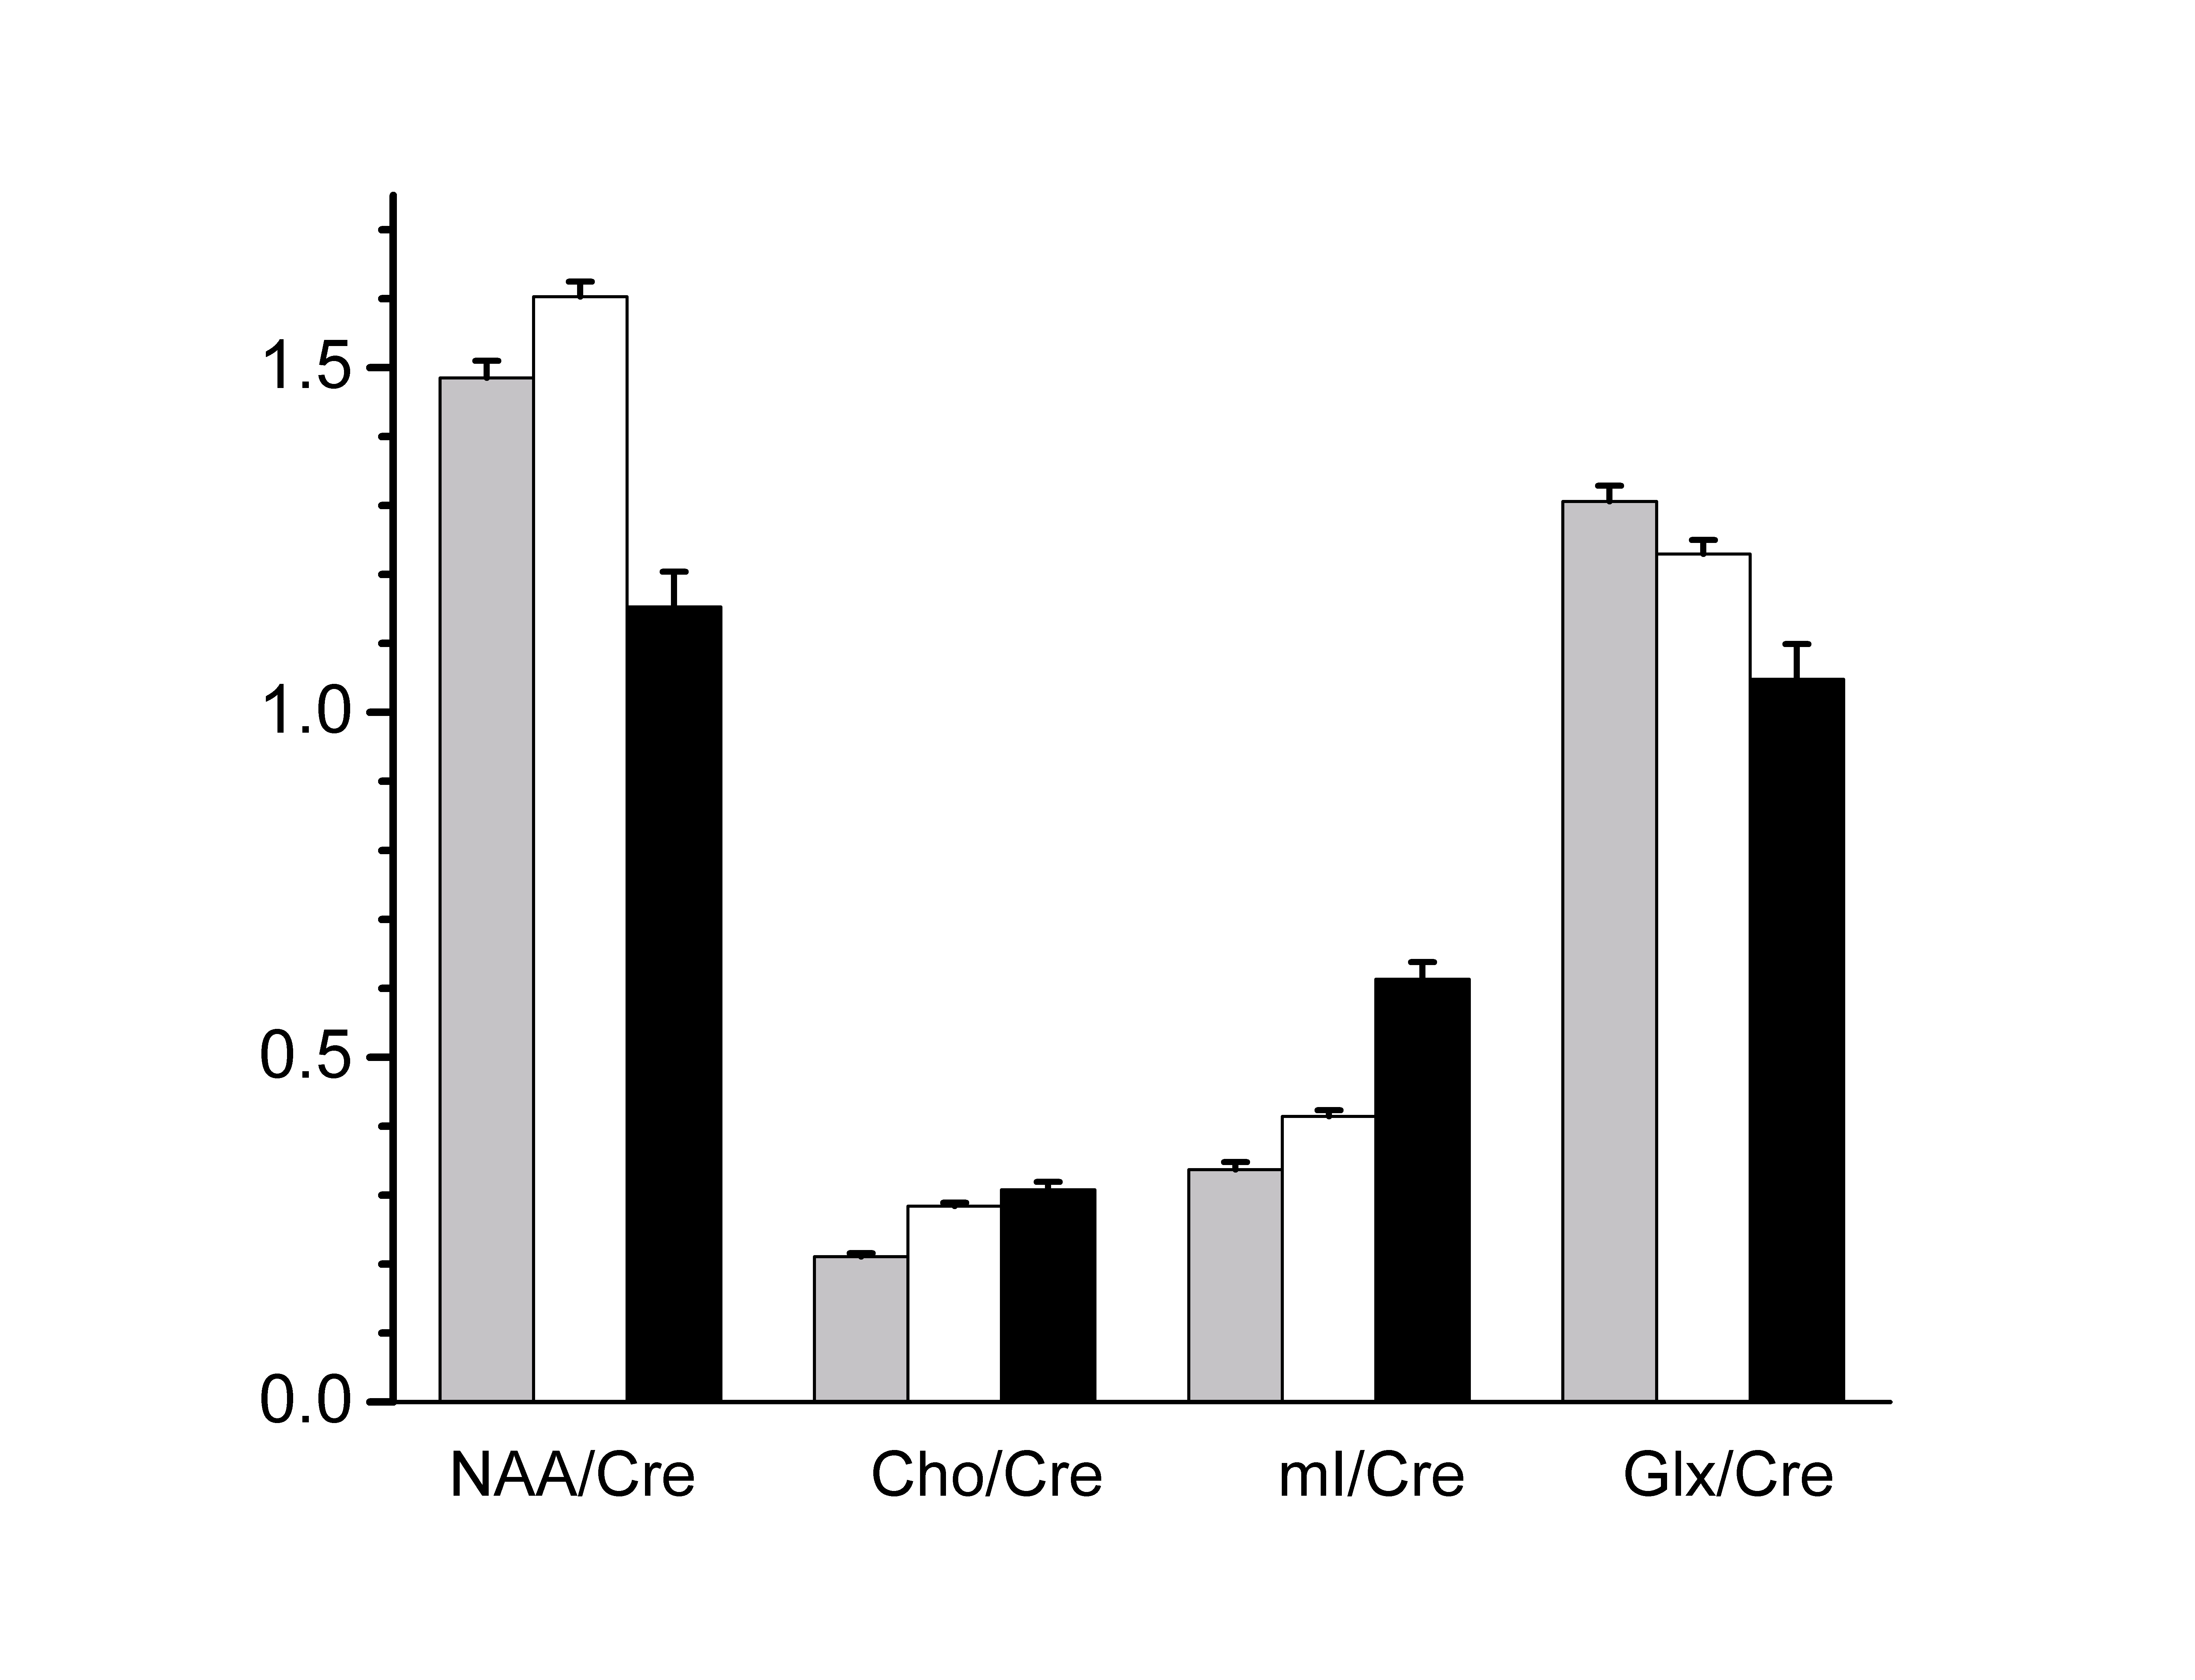
Figure 3. Principal metabolite findings (mean ± std error) with respect to tissue type. Columns are shaded grey, white and black to indicate GM, WM and Lesion respectively.