4637
The impact of inflammation on grey matter metabolism, quantified using a novel NIRS/MRI system1Radiology, University of Calgary, Cumming School of Medicine, Calgary, AB, Canada, 2Clinical Neurosciences, Unversity of Calgary, Cumming School of Medicine, Calgary, AB, Canada
Synopsis
Cerebral metabolic rate for oxygen (CMRO2) in gray matter (GM) is a sensitive marker for abnormalities in oxidative metabolism. We combined a near-infrared spectroscopy (NIRS) system with 9.4.T MRI to quantify regional CMRO2 in the experimental autoimmune encephalomyelitis (EAE) mouse model of multiple sclerosis. Increases in CMRO2 were seen in EAE mice and positive inflammation (CFA) controls at day 35 post-induction when compared to naïve controls. In addition, EAE and CFA mice showed increased CMRO2 from day 14 to 35. These data indicate that inflammation alone, not necessarily linked to a white matter autoimmune disease, could cause abnormal CMRO2 in GM.
Purpose
Multiple sclerosis (MS) is an inflammatory, neurodegenerative disease, and is traditionally considered a disease of white matter. However, later stages of the disease present with increasing cognitive and physical disability, which is best explained by grey matter damage and atrophy (1-5). This grey matter atrophy has been shown to correlate with changes in oxidative metabolism in the cerebral grey matter (6). This atrophy is also seen in the experimental autoimmune encephalomyelitis (EAE) model of MS (7). Our aim was to measure cerebral metabolic rate for oxygen (CMRO2) in the EAE model of MS. To achieve this, we developed a multimodal imaging system comprised of near-infrared spectroscopy (NIRS) and arterial spin-labelling magnetic resonance imaging (ASL-MRI).Methods
EAE was induced in female C57BL/6 mice via subcutaneous injection of myelin oligodendrocyte glycoprotein (MOG), Complete Freund’s Adjuvant (CFA) and intraperitoneal injection of B. pertussis toxin (8). 48 female C57BL/6 mice were full EAE, while 18 were used as positive controls (‘CFA controls’ - given all injections except MOG) and 10 were naïve controls.
Animals were monitored daily to day 14 (peak disease), and day 35 (long term). Mice were anesthetized with 3% isofluorane, 30% O2 and 67% N2, and maintained with 1.5% isofluorane. Animals were spontaneously ventilated and monitored for core temperature. An oximeter was used for arterial saturation, Sa, while NIRS and ASL measurements were performed simultaneously in the MRI.
The Fick principle was used to calculate CMRO2, resulting in the following equation:
$$CMRO_2 = 54.58(\mu mol\cdot g^{-1}) \times CBF \times (S_a - S_v) \times [tHb],$$
where CBF = cerebral blood flow, Sa is arterial oxygen saturation, Sv is venous oxygen saturation and [tHb] is the total concentration of hemoglobin in the blood.
A 9.4T Bruker MRI scanner was used with a 35mm birdcage coil. A CASL-HASTE sequence was used. TE/TR=2.66/3000ms, 128x128 matrix, 0.23mm x 0.23mm x 1mm voxel size, time-resolution=380s and CBF was calculated as per Detre et al. (9). T1 maps were generated with a RARE-VTR sequence, TE=10ms, TR=100, 500, 1000, 3000 and 7500ms.
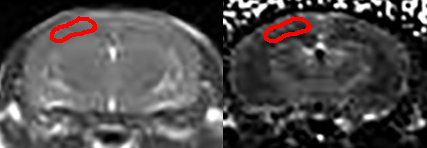
A broadband light source was used to generate NIR photons. Fibre optics were used to transmit light and receive attenuated light—which was transmitted to a spectrograph. Custom Matlab software was used for data analysis. The path through which the NIR photons traversed tissue was determined with NIRFAST,(10) a photon transport modelling software package. This data was then used to determine the region of interest for MR image analysis (Figure 1).
The attenuation spectrum was analysed with the second differential method to determine absolute deoxyhemoglobin (dHb) concentration (11). Total hemoglobin [tHb] was determined by first using a 30s hypoxia pulse, where hemoglobin was converted to deoxyhemoglobin. The full study was analyzed post-hoc to quantify oxyhemoglobin (oxyHb) and dHb, which is then used to calculate a mean capillary saturation Sc. We assume a 75%-25% split between venous and arterial sampling, giving the formula $$$S_a - S_c = \frac{3}{4} (S_a - S_v)$$$.
Results
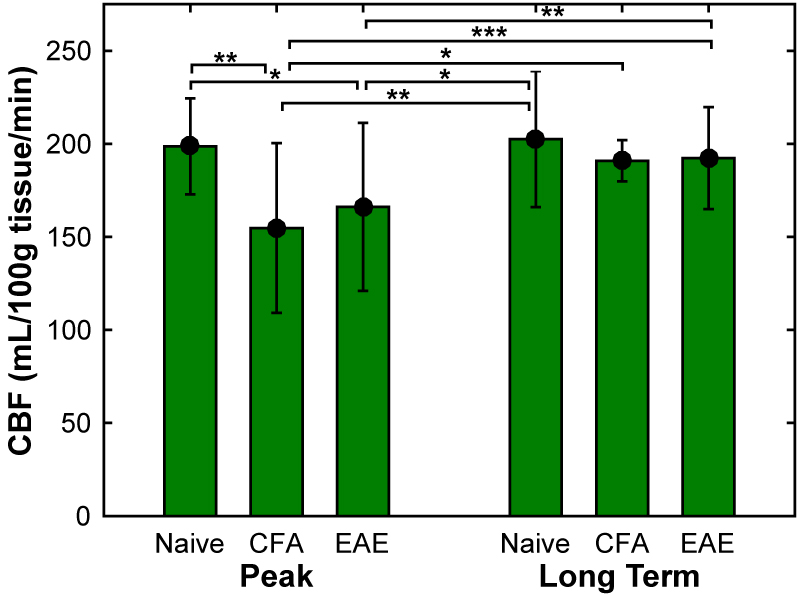
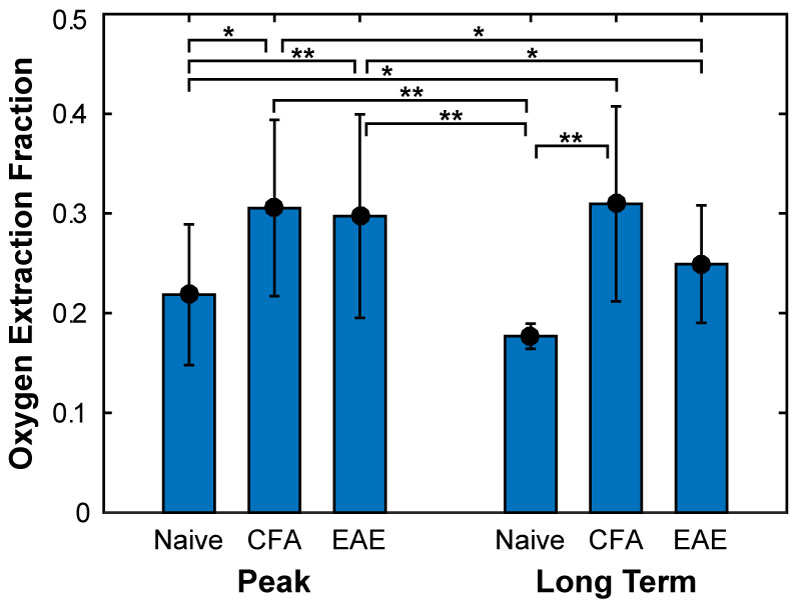
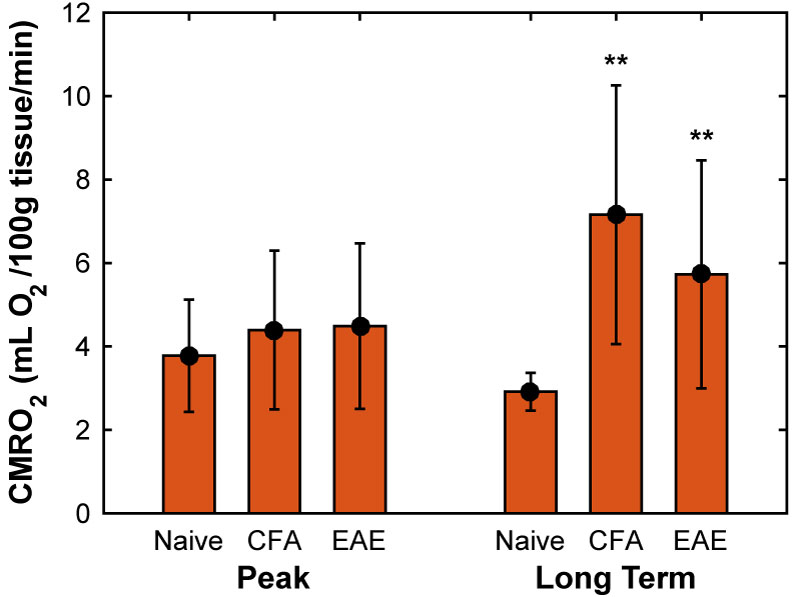
CBF was found to be significantly reduced in both CFA and EAE mice at day 14-20 (Figure 2), with values of 155 ± 46 and 166 ± 45 mL/100g tissue/min, respectively, whereas naïve mice had a CBF of 199 ± 26 mL/100g tissue/min. In addition, oxygen extraction fraction (OEF) was found to be significantly increased at days 14-20 (Figure 3), in both CFA (0.30 ± 0.09) and EAE mice (0.30 ± 0.10) when compared to naïve mice (0.22 ± 0.07) and in CFA mice (0.31 ± 0.1) at days 35-42 when compared to naïve mice (0.18 ± 0.01). CMRO2 was similar between CFA controls and EAE mice at days 14 and day 35 (Figure 4), but was significantly larger than naïve controls at day 35: 7.2 ± 3.1 and 5.7 ± 2.7 for CFA and EAE mice, respectively, vs. 2.9 ± 0.5 mL O2/100g tissue/min for naïve mice.
Discussion
The combination of reduced perfusion and increased OEF in both CFA and EAE mice at peak is consistent with a hypoxic tissue environment. This is interesting as this is also the time point at which neurological disability reaches its maximum. In addition, the increased metabolic rate in both CFA and EAE mice at long term indicates that oxidative metabolism may be increased not because of WM damage, but due to the downstream effects of general systemic inflammation.Conclusion
We show how, by combination of MRI and NIRS one can obtain simultaneous data from GM about tissue oxygenation, CBF and CMRO2. Non-specific inflammation may increase hypoxia in brain and cause increased CMRO2.Acknowledgements
The authors would like to thank Dave Rushforth and Tad Foniok for their unerring guidance and support in all things MRI.References
1. Fisher E, Lee J-C, Nakamura K, Rudick RA. Gray matter atrophy in multiple sclerosis: A longitudinal study. Annals of Neurology. 2008 2008;64(3):255-65.
2. Amato MP, Portaccio E, Goretti B, et al. Association of neocortical volume changes with cognitive deterioration in relapsing-remitting multiple sclerosis. Arch Neurol. 2007 Aug;64(8):1157-61.
3. Amato MP, Bartolozzi ML, Zipoli V, et al. Neocortical volume decrease in relapsing-remitting MS patients with mild cognitive impairment. Neurology. 2004 Jul 13;63(1):89-93.
4. Houtchens MK, Benedict RH, Killiany R, et al. Thalamic atrophy and cognition in multiple sclerosis. Neurology. 2007 Sep 18;69(12):1213-23.
5. Fisniku LK, Chard DT, Jackson JS, et al. Gray matter atrophy is related to long-term disability in multiple sclerosis. Ann Neurol. 2008 Sep;64(3):247-54.
6. Brooks DJ, Leenders KL, Head G, Marshall J, Legg NJ, Jones T. Studies on regional cerebral oxygen utilisation and cognitive function in multiple sclerosis. J Neurol Neurosurg Psychiatr. 1984 1984/11//;47(11):1182-91.
7. MacKenzie-Graham A, Rinek GA, Avedisian A, et al. Cortical atrophy in experimental autoimmune encephalomyelitis: in vivo imaging. NeuroImage. 2012 2012/03//;60(1):95-104.
8. Agrawal SM, Silva C, Wang J, Tong JP, Yong VW. A novel anti-EMMPRIN function-blocking antibody reduces T cell proliferation and neurotoxicity: relevance to multiple sclerosis. Journal of neuroinflammation. 2012;9:64.
9. Detre JA, Zhang W, Roberts DA, et al. Tissue specific perfusion imaging using arterial spin labeling. NMR Biomed. 1994 1994/03/01/;7(1-2):75-82.
10. Dehghani H, Eames ME, Yalavarthy PK, et al. Near infrared optical tomography using NIRFAST: Algorithm for numerical model and image reconstruction. Communications in numerical methods in engineering. 2008 2008/08/15/;25:711-32.
11. Matcher SJ, Cooper CE. Absolute quantification of deoxyhaemoglobin concentration in tissue near infrared spectroscopy. Physics in medicine and biology. 1994 1994/08//;39(8):1295-312.
Figures