4633
2-deoxy-D-glucose-conjugated magnetonanoparticles (2DG-MNP) uptake as a measure of metabolic activity in glioblastoma murine model1preclinical imaging, Vienna Biocenter Core Facilities, Vienna, Austria, 2Radiology, University of California, Los Angeles, CA, United States
Synopsis
In the current study we tested if accumulation of non-radioactive 2-deoxy-D-glucose (2DG)-conjugated magnetonanoparticles (2DG-MNP) can be used as a measure of metabolic activity in glioblastoma. To quantify 2DG-MNP uptake across brain ΔR2 maps are proposed. The difference in R2 relaxation rates prior to and at different times following 2DG- or unlabeled (plain) MNP administration represents ΔR2. Significant changes in ΔR2 between brain and glioblastoma, reflecting increased metabolic rate of glioblastoma were found for glucose labeled MNP and not for plain-MNP. Our results suggest that 2DG-MNP have potential to be utilized in metabolic imaging as non-radioactive 2-18[F]-fluoro-deoxy-D-glucose analogue.
Introduction
Currently, there are no non-radioactive markers available that can be used to track glucose uptake in glioma and potentially discriminate tumor regions based on their metabolic activity. In this study we tested if uptake and accumulation of 2-deoxy-D-glucose-conjugated magnetonanoparticles1,2 (2DG-MNP) could be utilized to differentiate metabolically active tumor area from necrosis. Orthotopic murine model of human U87 high-grade glioma was used. Unlabeled magnetonanoparticles (plain-MNP) were used as control.Methods
Immuno-compromised NOD-scid mice (6-8 weeks old) were used for all experiments. Each mouse (N=6) was injected intracranially (using stereotaxic surgery) with 105 U87 glioma cells. Mice were first imaged using plain-MNP (iv injected) at 21 days following glioblastoma injection and then again the next day using 2DG-MNP. MR imaging was performed on a 7T Bruker system (Ettlingen, Germany). A multi-spin echo (TR/TE 2000/7.26-101.64 ms, 14 echoes, 782 μm2 resolution, 1 mm slice thickness, 2 NAX) and multi-gradient echo (TR/TE = 1500/3.88-71.01 ms, 12 echoes, 782 μm2 in-plane resolution, 1 mm slice thickness, 2 NAX) sequences were used to quantify transverse relaxation time (T2) and T2*. For each mouse, multi-spin echo and multi-gradient echo images were acquired prior to (0 min), and then subsequently at 15, 30, 60, 90 and 120 minutes post magnetoparticles injection. ImageJ (plugin by Karl Schmidt) was used to calculate T2 and T2*. Relaxation rates R2 and R2* were calculated as R2=1/T2 and R2*=1/T2*. To aid visualization and to quantify R2 changes prior to and following administration of 2DG- or plain-MNP, R2 subtraction maps (ΔR2) were generated for different time points. At the end of the MRI studies, mice were sacrificed and tissue was processed for histology and CD31 staining. Statistical analysis was performed using repeated measures ANOVA with Holm-Sidak post-hoc test, where P-value<0.01 was considered significant.Results
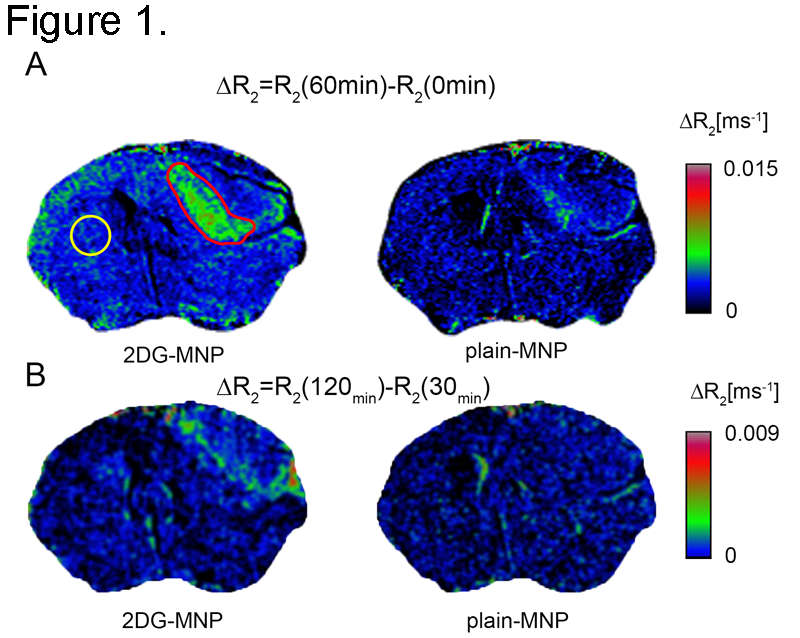
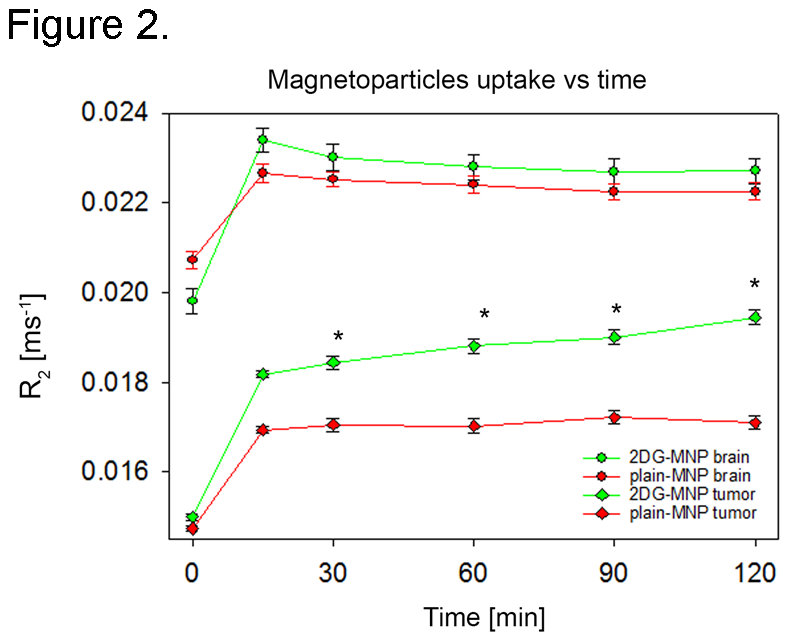
Even though R2*-quantification could potentially provide superior sensitivity to changes in R2* rates, R2*-weighted images were degraded by susceptibility artifacts adjacent to the ear cavities and other osseous and air-containing structures leading to high variations in R2*-values across the brain especially on pre-contrast images. Therefore, 2DG-MNP and plain-MNP uptake characterization was done using R2-quantification. When mice were injected with 2DG-MNP, we found significantly increased R2 values within the U87 xenografts (Fig 1A, outlined in red) vs normal brain (Fig 1A, yellow circle) at 30, 60, 90 and 120 min post injection (ANOVA, P<0.01), Fig 2. In contrast, when mice were injected with plain-MNP there were no significant changes in R2-relaxation rates between glioblastoma and normal brain tissues, Fig. 2. These results are supporting glioblastoma specific uptake associated with the 2DG-labeled particles. To rule out the possibility that increased 2DG-MNP uptake was simply due to greater accumulation within the tumor vasculature, we generated ΔR2-maps by subtracting R2-maps at 30 min and 120 min following 2DG-MNP or plain-MNP injections, Fig. 1 C. Subtraction maps R2(120min)-R2(30min) showed additional progressive accumulation of 2DG-MNP within glioblastoma, whereas this was not observed for plain-MNP, Fig. 1 C. These findings suggest that tumor tissue uptake, rather than vascular accumulation, is responsible for the increase in R2 values seen after 2DG-MNP injection. Histopathological evaluation confirmed that increased R2-relaxation rates were restricted to glioblastoma with viable tumor cells, and not the necrotic region (black arrow) Fig 3 B. Staining for endothelial cell marker, CD31, revealed vessels in the area that did not exhibit increase in R2-relaxation rate, arguing the increase in R2 is due to enhanced metabolism and not increase in vascular density, Fig 3 B.Discussion
We demonstrated that 2DG-MNP are useful in distinguishing viable glioblastoma from necrosis (as confirmed by histology, Fig 3 B), despite homogeneous appearance on T2-weighted image, Fig. 3A. Furthermore, increase in R2 relaxation rates limited to glioblastoma sub region, is strongly supporting the use of 2DG-MNP particles as a marker of metabolic activity. Although beyond the scope of this study, more precise quantification of 2DG-MNP uptake would be possible by correlating R2 values with the tissue iron content. Preclinical evaluation of 2DG-MNP is ongoing.Conclusion
2DG-MNP contrast agent in combination with ΔR2 maps can be utilized for non-radioactive glucose metabolic imaging in glioblastoma models.Acknowledgements
No acknowledgement found.References
1. Akhtari M, et al. Functionalized magnetonanoparticles for MRI diagnosis and localization in epilepsy. Epilepsia. 2008;49(8):1419-1430.
2. Akhtari M, et al. Functionalized magnetonanoparticles in visualization of intracranial tumors on MRI. Mol Imaging Biol. Jun 2012;15(3):299-306.
Figures