4632
Measurement of Blood-Brain Barrier Permeability using Dynamic Contrast-Enhanced Magnetic Resonance Imaging with Reduced Scan Time1Center for Advanced Imaging Innovation and Research, Radiology, New York University School of Medicine, New York, NY, United States
Synopsis
The purpose of this study is to investigate the feasibility of reducing the scan time while maintaining the sensitivity to BBB permeability changes. We propose a new model, extended Patlak model (EPL), where plasma flow is added to the Patlak model. The numerical simulation and in vivo mouse data in this study suggest that the proposed EPL model can be used to measure BBB permeability change with DCE-MRI scan time of 10 min or less.
PURPOSE
Dynamic contrast enhanced (DCE)-MRI has been identified as an effective tool for non-invasive measure of blood-brain barrier (BBB) disruption in many brain disorders such as brain tumor, stroke, and multiple sclerosis.1 However, the inherently low permeability of the BBB and its subtle changes require a long scan time, around 20-30 minutes, which is often not clinically practicable. The purpose of this study is to investigate the feasibility of reducing the scan time while maintaining the sensitivity to the BBB permeability change.METHODS
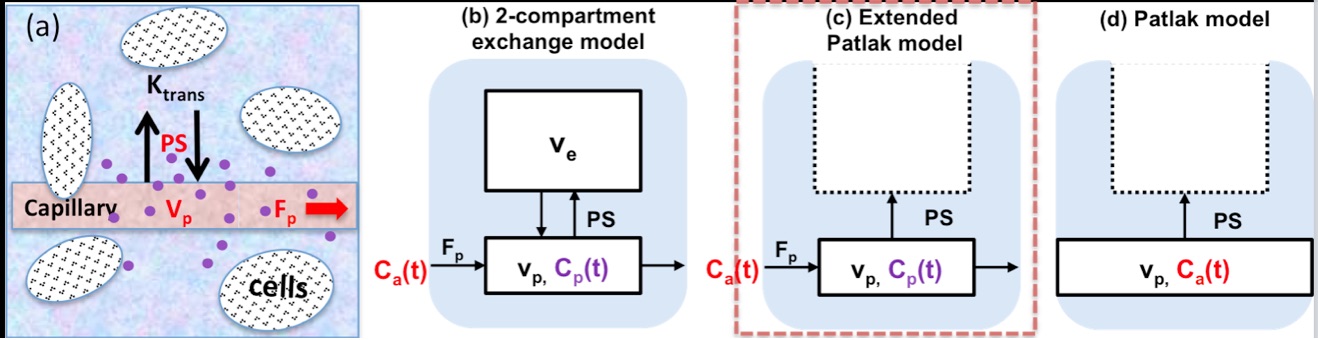
Contrast Kinetic Modeling: Figure 1a is a simplified version of tissue microcirculation environment, which is often modeled as a 2-compartment exchange model (2CXM)2 (Fig.1b). In case of brain tissue with or without dementia or Alzheimer’s disease, it has been shown that the transfer rate of contrast agent into the interstitial space is mainly determined by the low level of vascular permeability-surface area product (PS), such that the Patlak model3 (Fig.1d) is often used assuming that the reverse flow of the contrast agent is negligible. However, it is worthwhile recognizing another important assumption used in the Patlak model regarding the arterial input function (AIF); the contrast agent concentration in the capillary bed is same as that of the artery. This assumption can be valid if the Patlak model analysis is performed mainly using the later part of the time-concentration-curve in a relatively long scan (> 20min) where the effect of vascular space becomes small. That is where the linearized Patlak graphical analysis is also used. However, when the scan duration is in the order of 10 min or less, this assumption no longer holds true and PS can be overestimated as the estimation process tries to use PS to describe the vascular contribution. In this study, we propose a new model, extended Patlak model (EPL) (Fig.1c), where the capillary compartment is included as in the 2CXM.
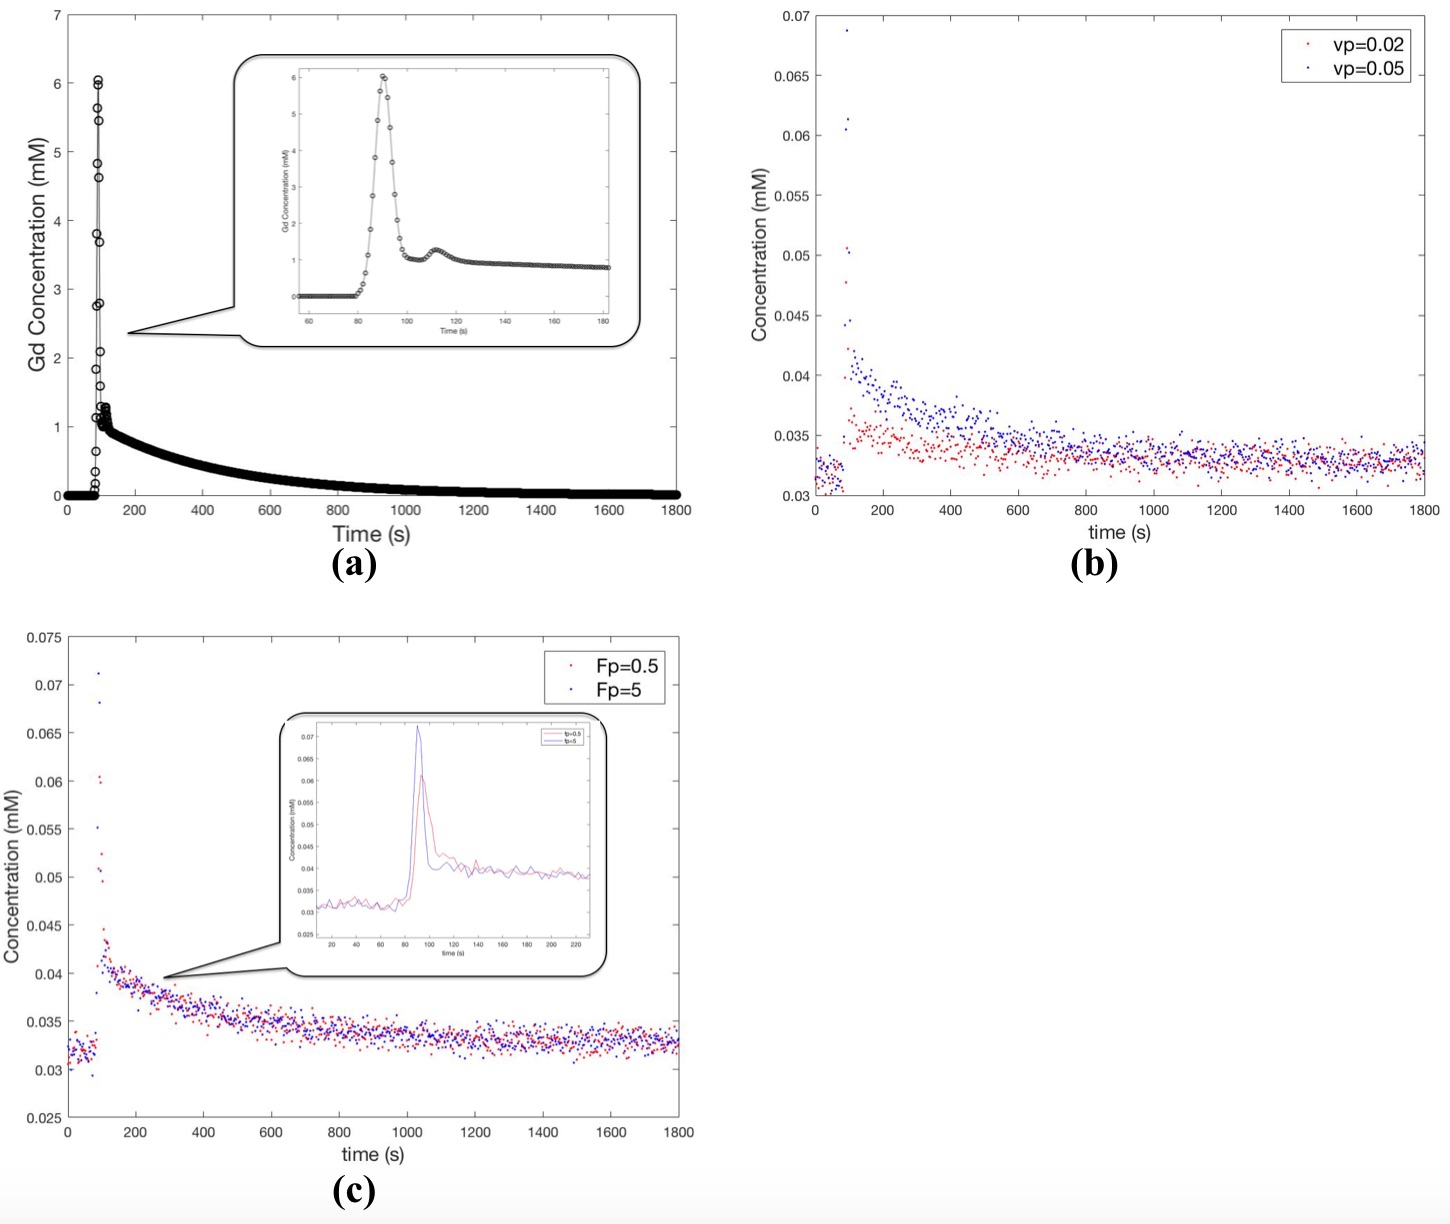
Simulation study: A numerical simulation study was conducted to assess the feasibility of using the EPL model with a reduced scan time. A population based arterial input function (AIF)4 used in this study is shown in Figure 2a. Lesion data were generated using 2CXM with temporal resolution of 3 s/frame. Assuming the data is only in the real channel, Gaussian noise was added to both real and imaginary channels. The standard deviation of the Gaussian noise was 2.5% of the baseline prior to contrast injection (Fig.2b). In order to demonstrate the efficacy of the proposed EPL model with shorter scanning time, two different sets of lesion data were generated for scan durations of 10 minutes and 30 minutes, respectively. Plasma volume fraction (Vp) was varied from 0.02 to 0.05 (Fig.2b), in order to assess its influence on PS estimation. Likewise, plasma flow (Fp) was varied from 0.5 to 5 (Fig.2c). Statistics of PS estimates were generated from lesion data with 50 different noises for each set of parameters.
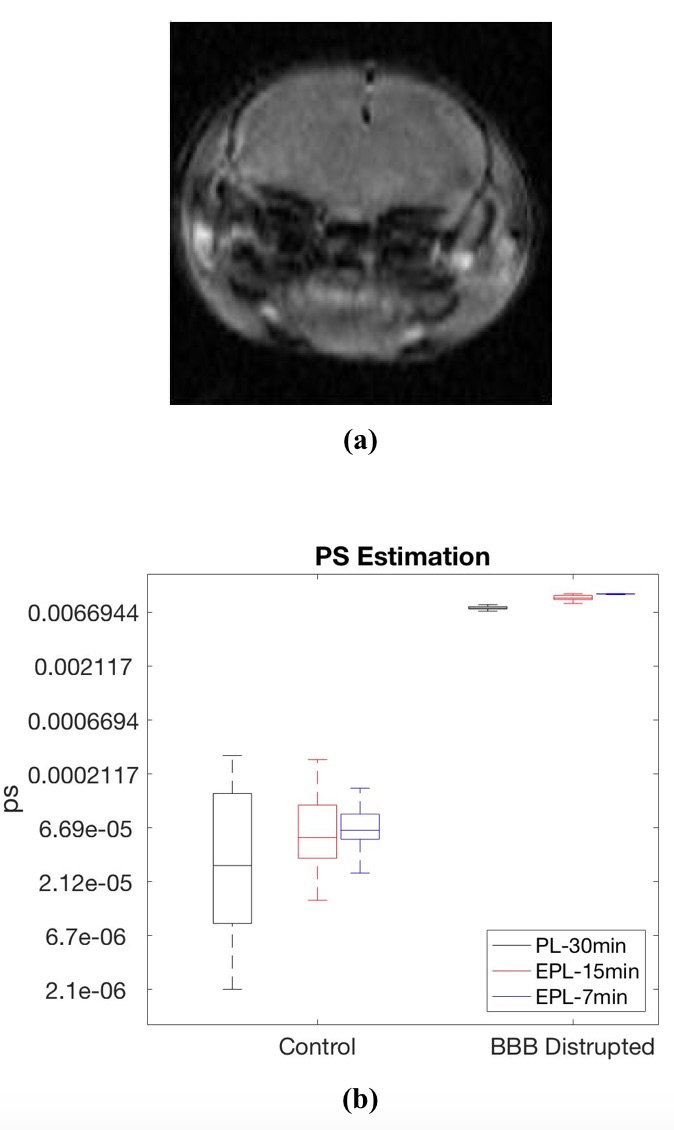
In vivo mouse study: Four 8-wk-old C57BL/6 mice were scanned using a 7T horizontal bore magnet with a volume transmit and receive coil. Prior to MRI, two mice were injected with 50 mL of ultrasound contrast agent followed by sonication of the head area with 1 MHz pulsed ultrasound at 20% duty cycle for 2 minutes to open BBB. A 3D dual-echo GRE sequence was used with TR=11.4, TE= 2.33 and 6.33 ms, image matrix = 100x100x9, and resolution = 0.15x0.15x1 mm3. This sequence was run to acquire 360 3D images for 30 min. Temporal resolution was 5s. A bolus of 10 mM Gd-DTPA in saline, corresponding to dose 0.1 mmol/kg, was injected through a tail vein catheter, starting 1 min after the acquisition of pre-contrast images.
RESULTS
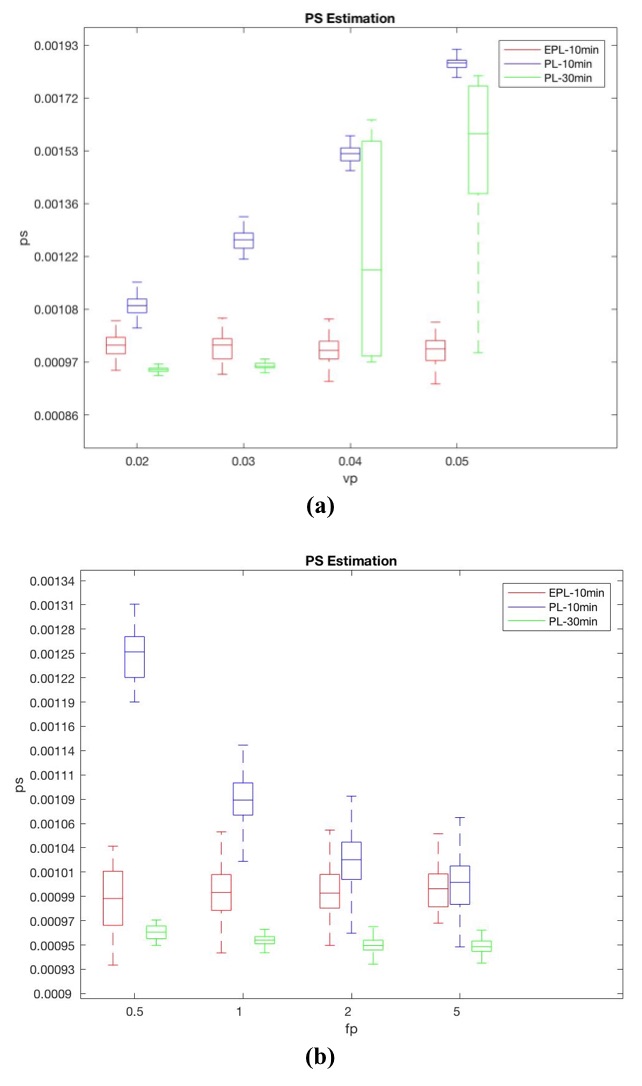
Figure 3a shows the influence of Vp on the PS estimates. Vp does not make noticeable changes in the PS estimated using the EPL model with 10 min data or the PL model with 30 min. However, The PS-estimated using the PL-model with the first 10 min data shows substantial changes depending on Vp. Similarly, the influence of Fp on the PS estimation (Fig.3b) is biggest with the PL-10min case. Figure 4 shows that the increased BBB permeability by sonication is detected by the PS measured by the PL with 30 min scan data and EPL with 7 or 15 min data.DISCUSSION AND CONCLUSION
The numerical simulation and in vivo mouse data in this study suggest that the proposed EPL model can be used to measure PS with DCE-MRI scan time of 10 min or less.Acknowledgements
NIH R01CA160620References
1. Heye AK, Culling RD, Valdes Hernandez Mdel C, Thrippleton MJ, Wardlaw JM. Assessment of blood-brain barrier disruption using dynamic contrast-enhanced MRI. A systematic review. NeuroImage Clinical. 2014;6:262-74. doi: 10.1016/j.nicl.2014.09.002. PubMed PMID: 25379439; PubMed Central PMCID: PMC4215461.
2. Brix G, Kiessling F, Lucht R, Darai S, Wasser K, Delorme S, Griebel J. Microcirculation and microvasculature in breast tumors: pharmacokinetic analysis of dynamic MR image series. Magnetic resonance in medicine. 2004;52(2):420-9. doi: 10.1002/mrm.20161. PubMed PMID: 15282828.
3. Patlak CS, Blasberg RG, Fenstermacher JD. Graphical evaluation of blood-to-brain transfer constants from multiple-time uptake data. J Cereb Blood Flow Metab. 1983;3(1):1-7. doi: 10.1038/jcbfm.1983.1. PubMed PMID: 6822610.
4. Parker GJ, Roberts C, Macdonald A, Buonaccorsi GA, Cheung S, Buckley DL, Jackson A, Watson Y, Davies K, Jayson GC. Experimentally-derived functional form for a population-averaged high-temporal-resolution arterial input function for dynamic contrast-enhanced MRI. Magnetic resonance in medicine. 2006;56(5):993-1000. doi: 10.1002/mrm.21066. PubMed PMID: 17036301.
Figures