4631
BRAIN PARENCHYMAL VOLUME CHANGES AFTER ANEURYSMAL SUBARACHNOID HEMORRHAGE1Department of Radiology, University Medical Center Utrecht, Utrecht, Netherlands, 2Department of Neurology and Neurosurgery, Brain Center Rudolf Magnus, University Medical Center Utrecht, Netherlands
Synopsis
Aneurysmal Subarachnoid Hemorrhage (aSAH) accounts for only 5% of all strokes, but it is a disabling disease because of the cognitive deficits that occur in many survivors. We hypothesize these deficits to be caused by an accelerated brain atrophy process that develops after the event. To investigate this hypothesis, we evaluated brain volume changes in aSAH patients over time.
Introduction
Aneurysmal Subarachnoid Hemorrhage (aSAH) is a devastating disease with an estimated case fatality rate of 50% at 6 months.1 Survivors are affected by long-term cognitive deficits. These deficits are thought to be caused by cerebral damage. One of the hypothesized mechanisms leading to cerebral damage is early brain injury (EBI). Although the exact pathophysiological mechanisms behind EBI have not been established, some evidence shows that after aSAH the extravasation of blood leads to an acute rise in the intracranial pressure (ICP) closely followed by cerebral blood flow decrease.2 A combination of these factors, plus still unknown pathways, results in a global cerebral injury which may cause diffuse neuronal loss. We hypothesize this to manifest itself as an accelerated process of brain atrophy.
The purpose of this study was to investigate this hypothesis by evaluating brain volume changes on MRI after aSAH using automated segmentation.
Methods
This study was approved by our institutional review board. Ninety-nine patients with confirmed aSAH were prospectively included. The inclusion criteria were as follows; (1) endovascular treatment of the aneurysm, (2) an MRI performed in sub-acute phase (<21 days after aSAH, MRI1), in chronic phase (~6 months after aSAH, MRI2) and optionally in late chronic phase (~18 months after aSAH, MRI3). As part of the imaging protocol, a T2 fluid-attenuated inversion recovery (FLAIR) sequence was performed. Scan parameters of the T2-FLAIR sequence were as follows: TR/TI/TE=10000/2800/120ms, voxel size: 0.4x0.4x4mm3, 1 mm inter-slice gap. Scans were acquired on either a 1.5 or 3T Philips system (Philips, Best, The Netherlands).
Statistical parametric mapping (SPM, version 12)3 was used to obtain brain parenchymal volume. When necessary focal lesions were segmented by the lesion prediction algorithm (LPA) as implemented in the LST toolbox version 2.0.15 (www.statistical-modelling.de/lst.html) for SPM.4
Statistical analysis was performed using SPSS (IBM SPSS Statistics for Windows, Version 24.0. Armonk, NY: IBM Corp); the percentage of brain parenchymal volume loss from the first to the second scan, from the first to the third scan and from the second to the third scan was evaluated and statistical significance was tested using a paired t-test.
Results
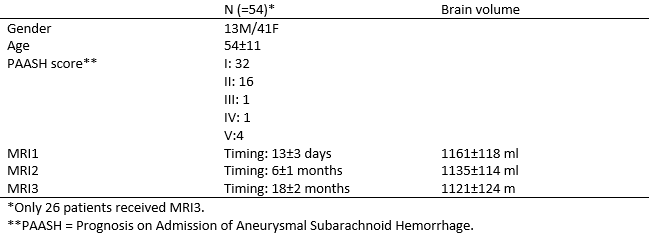
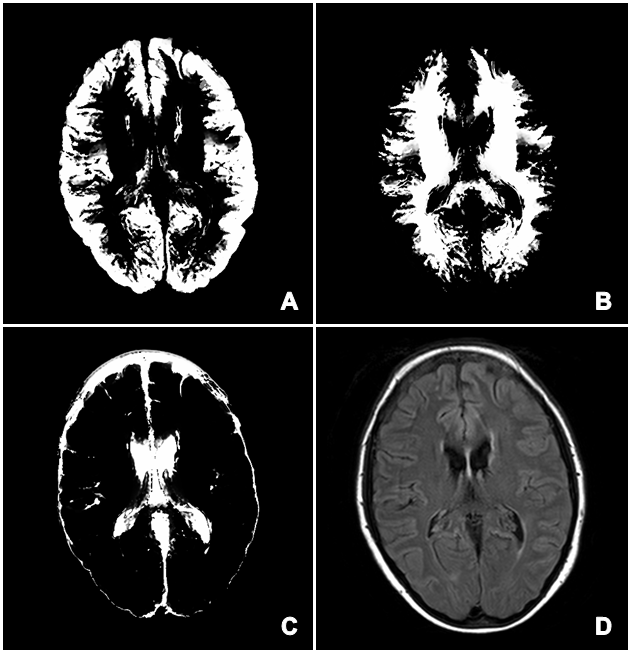
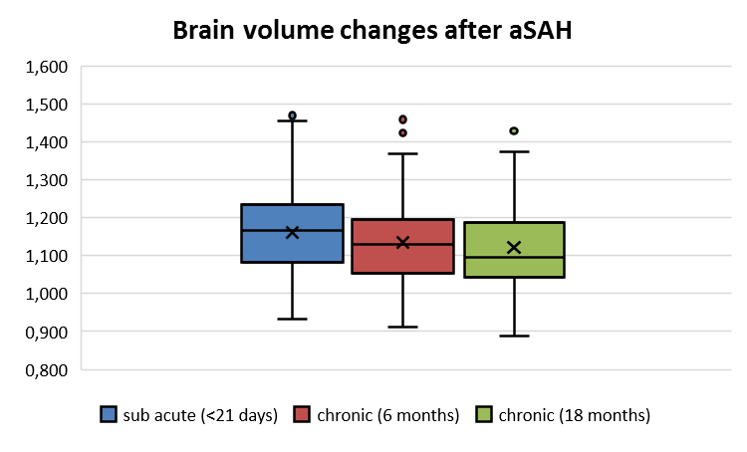
Of the 99 patients included in the study, 54 patients had a good quality of image segmentation and were included in the analysis. An illustrative case of brain volume segmentation is shown in Figure 1. Baseline characteristics of these patients are given in Table 1. At MRI1 the mean (±SD) brain volume was 1161±118ml . The mean brain volume decreased to 1135±114ml at MRI2. The mean volume difference between MRI1 and MRI2 was 26±29ml, which reflects a 2.22% of brain volume loss observed over approximately 6 months (p < 0.001).
Of the 54 patients with MRI1 and MRI2, 34 had MRI3 with good quality image segmentation in 26 of these patients. Mean brain volume at MRI3 was 1121±124ml. The mean volume difference between the first and the third MRI scan was 37±35ml, which reflects a 3.41% of brain volume loss observed over approximately 18 months (p < 0.001). Considering MRI2 and MRI3, the mean brain volume difference was 12±23ml, which means an additional 1.21% brain volume loss observed between approximately 6 and 18 months after aSAH (p < 0.01). Changes in brain volume are represented in Figure 2.
Discussion and conclusion
Data from this study demonstrates that patients after aSAH experience a consistent brain volume loss at a higher rate than normal age-related atrophy (0.18% per annum).5 The brain volume loss was shown to be most pronounced in the first 6 months after aSAH but continued beyond this time frame. Ongoing brain volume loss after 6 months proves that it is not only the initial brain edema which causes an apparent brain volume loss in the first few months after aSAH, but that there is also a real pathophysiological process going on. Thereby our data supports the EBI hypothesis of neuronal loss initiated from ictus on.
We are still pursuing further evidence for this finding by comparing our data to the data of aneurysm-treated non-SAH patients. Overall, our study provides support for the development and administration of neuroprotective agents in the chronic phase after aSAH.
Acknowledgements
No acknowledgement found.References
1. Smith M, Citerio G. What's new in subarachnoid hemorrhage. Intensive Care Med. 2014.
2. Cahill WJ, Calvert JH, Zhang JH. Mechanisms of early brain injury after subarachnoid hemorrhage. J. Cereb. Blood Flow Metab. 2006.
3. Friston KJ, Ashburner J, Kiebel S, Nichols T, Penny WD. Statistical parametric mapping?: the analysis of funtional brain images. Elsevier/Academic Press; 2007.
4. Schmidt PQ, Gaser C, Arsic M, Buck D, Förschler A, Berthele A, Hoshi M, Ilg R, Schmid VJ, Zimmer C, Hemmer B, Mühlau M. An automated tool for detection of FLAIR-hyperintense white-matter lesions in 2 Multiple Sclerosis. 2011.
5. Raz N, Rodrigue KM. Differential aging of the brain: Patterns, cognitive correlates and modifiers. Neurosci. Biobehav. Rev. 2006.
Figures