4629
Quantitative Susceptibility Mapping of Intracranial Hemorrhage: Time Evolution and Comparison to CT1Radiology, University of Calgary, Calgary, AB, Canada, 2Biomedical Engineering, University of Alberta, Edmonton, AB, Canada, 3Radiology and Diagnostic Imaging, University of Alberta, Edmonton, AB, Canada, 4Division of Neurology, Department of Medicine, University of Alberta, Edmonton, AB, Canada
Synopsis
To follow the time evolution of intracranial hemorrhage (ICH) using quantitative susceptibility mapping (QSM) and compare to CT. Twenty ICH patients were followed using a clinical MRI protocol typically performed on day 2, 7 and 30. The ICH areas and mean values were compared between the CT and QSM on 18 patients (average 1.7 days apart). Time evolution of ICH was also investigated by QSM. In conclusion, QSM can be used to measure the size of ICH and track susceptibility evolution of the blood degradation products, providing a means to track iron evolution.
Purpose
Intracranial hemorrhage (ICH) is a devastating disease with no known therapy. Iron in ICH evolves rapidly through different stages 1. Tracking iron evolution of ICH may help monitor disease progression and the efficacy of future iron-removing therapies. ICHs are highly concentrated with paramagnetic forms of heme iron, and an advanced ICH-QSM reconstruction method makes it possible to measure the susceptibility changes of ICH 2. A recent study compared ICH susceptibility differences at various stages from different patients 3. However, longitudinal study of QSM in the same ICH subjects has yet to be performed. Thus the purpose of our study is to track ICH evolution with QSM and also to compare QSM to CT among the same ICH subjects.Methods
Twenty patients (9 male, 11 female; age: 71 ± 13 years) diagnosed with ICH based on day 0 or day 1 CT were followed using a clinical MRI protocol typically performed on day 2, 7 or 30 (15 patients had day 2 MRI; 9 patients had day 7 MRI; 7 patients had day 30 MRI; 8 patients had MRI on multiple days). QSM was reconstructed from the GRE raw phase images (1.5 T, TE/TR 40/49 ms, resolution 0.72 x 0.72 x 1.9 mm3, 320 x 256 x 72 matrix), using the superposed dipole inversion method for ICH-QSM, which reduces streaking artifacts and improves the accuracy of QSM reconstruction 2. Standard T1, T2 and FLAIR were also included.
Comparisons were made between CT and QSM for both ICH area (size) and signal intensity. CT images were interpolated and registered with day 2 GRE magnitude images using the Elastix software. To track the susceptibility evolution of ICH longitudinally, GRE magnitude images from follow-up scans (i.e. day 7, day 30) were also registered to day 2 MRI using FLIRT software. The 2D hemorrhage regions-of-interest were drawn independently on the registered CT, GRE magnitude and QSM slice of the largest ICH region for each subject.
Results
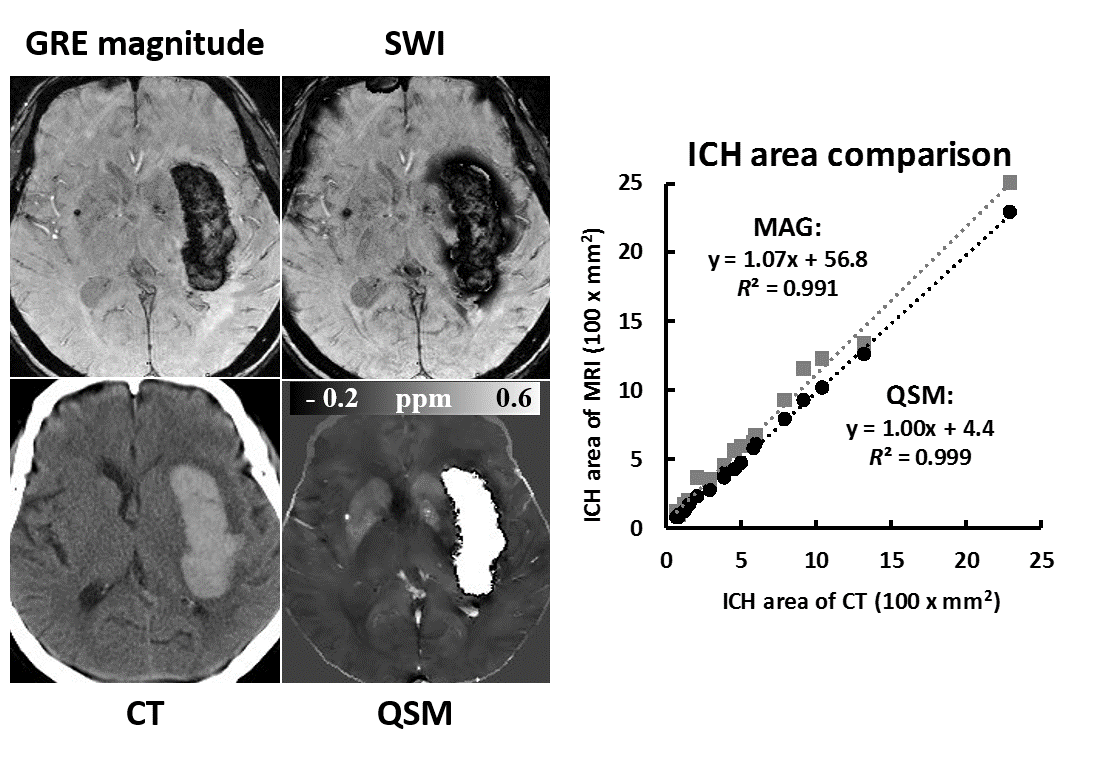
CT, GRE magnitude, SWI and QSM of one large hemorrhage are shown in Fig. 1. Hyperintense ICH areas on CT and QSM correspond well with each other, while magnitude images and SWI show heterogeneity within ICH. For the ICH area measurement, high linear correlations were found for both magnitude (R2=0.991) and QSM (R2=0.999) comparing to CT. A slope of 1.07 for GRE magnitude indicates overestimation of ICH size as compared to CT and QSM.
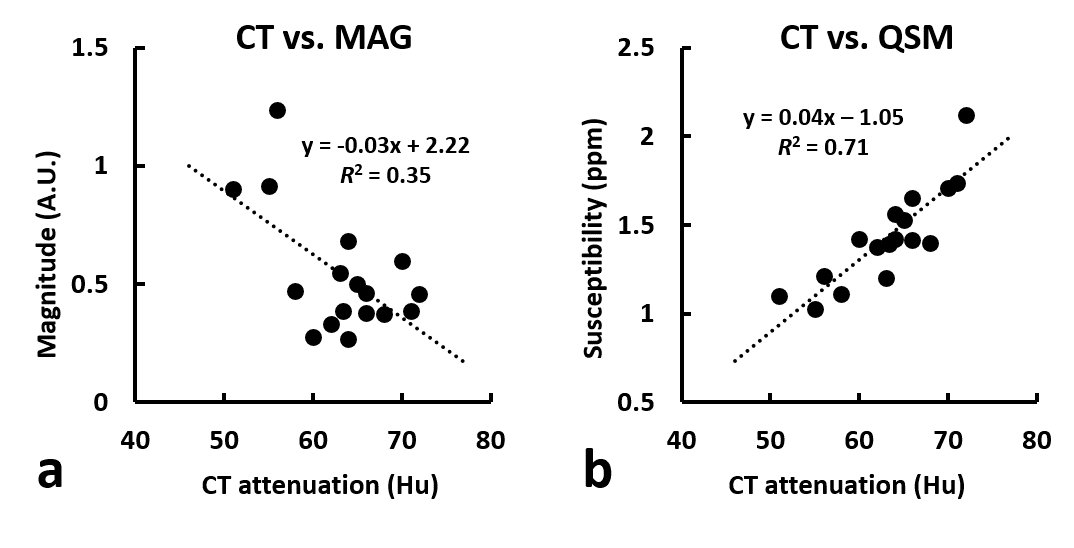
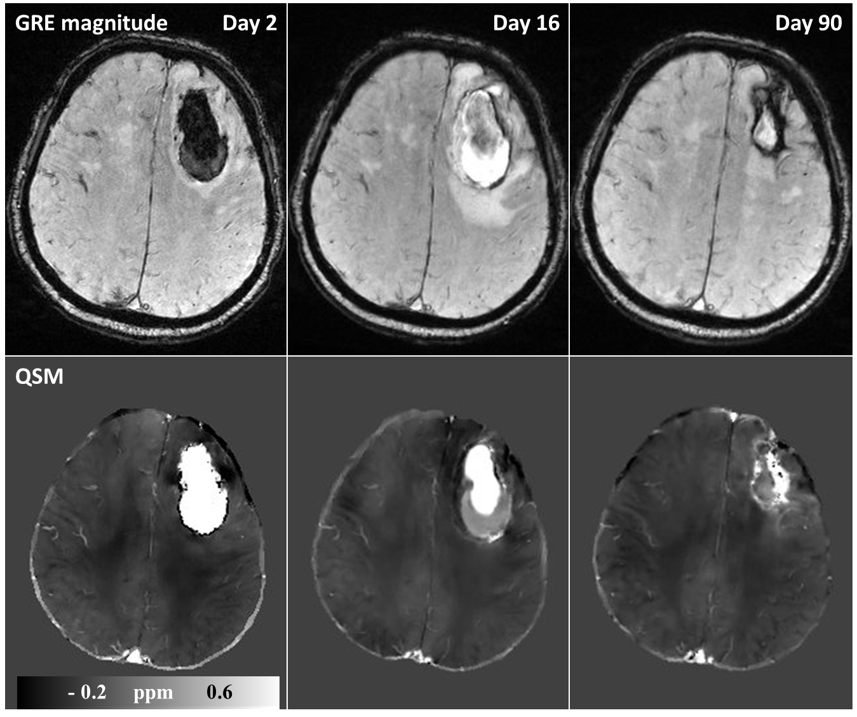
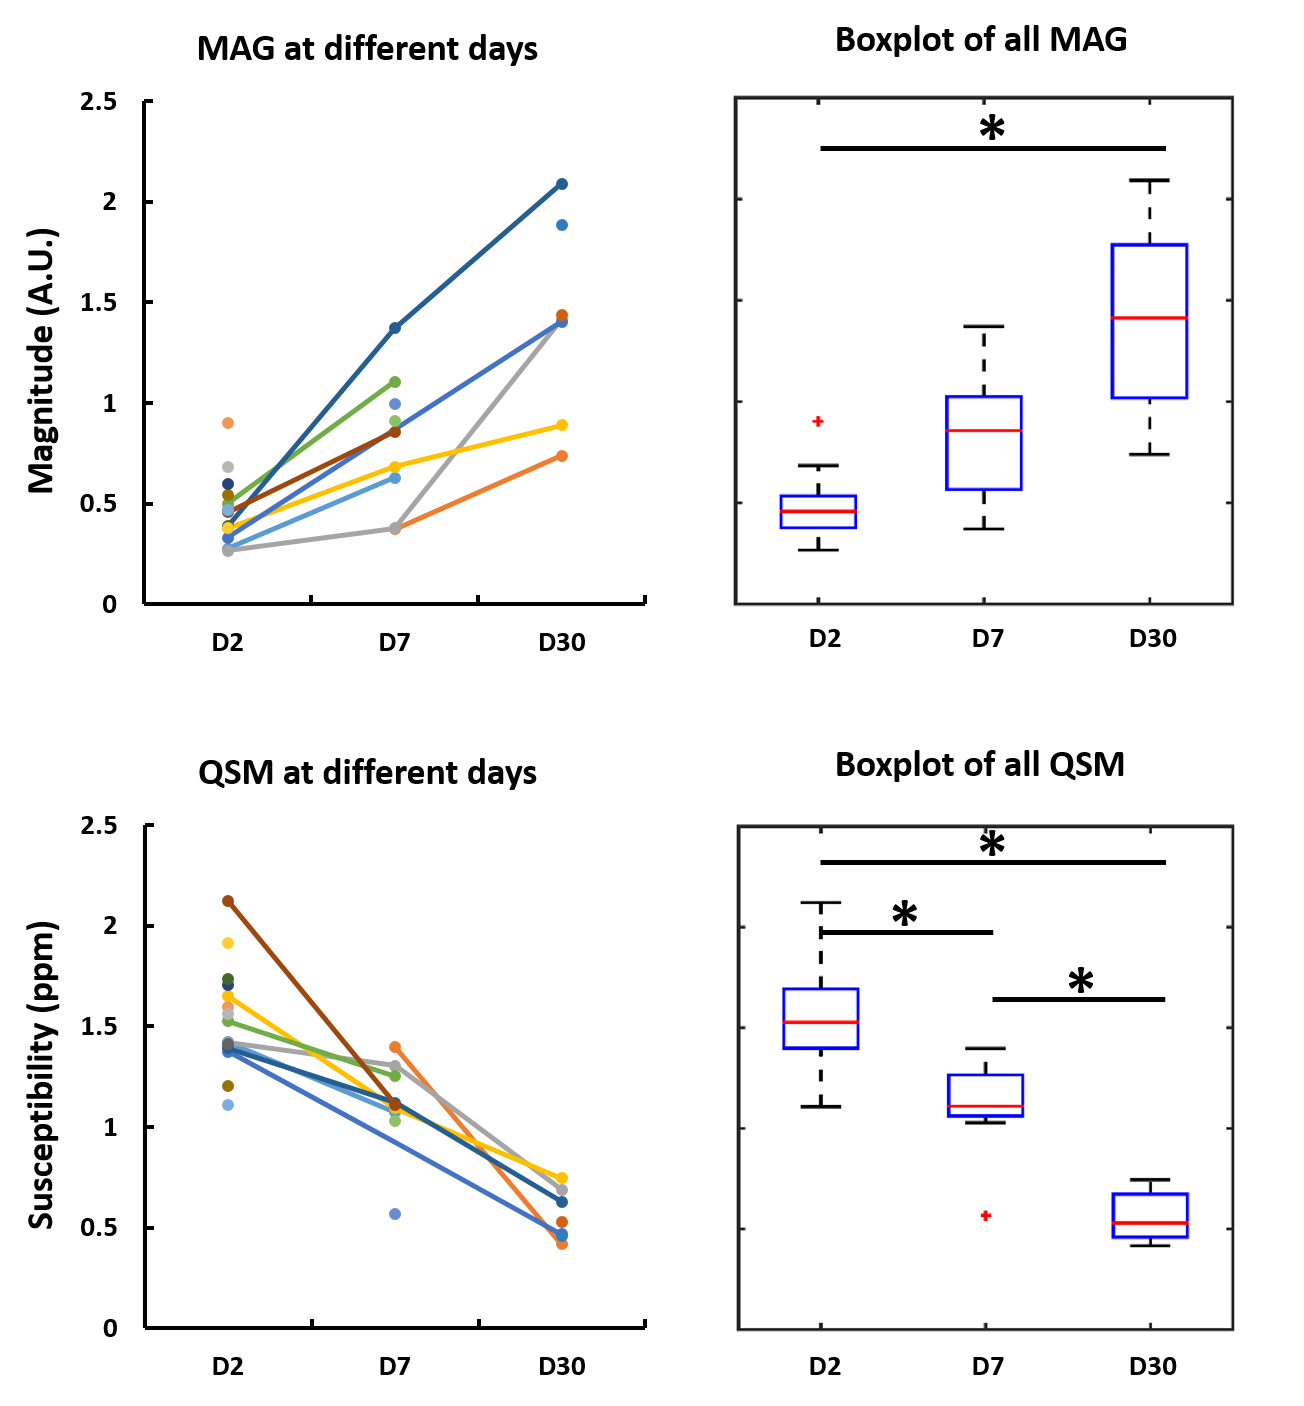
Figure 2 compares the average CT attenuation coefficients with GRE magnitude intensities and susceptibilities. In general, magnitude intensity decreases while susceptibility increases with CT attenuation. A poor linear correlation was found between CT and magnitude intensity (R2 = 0.35), while a good correlation was found between CT and QSM (R2 = 0.71). GRE magnitude and QSM from earliest to latest days for one patient are displayed in Fig. 3. ICH on GRE magnitude changes from hypointense to hyperintense from day 2 to day 16, while susceptibility decreases significantly at the bottom portion of the hemorrhage on day 16. On day 90, the hemorrhage size decreases significantly, with hypo- and hyperintense rims on magnitude and QSM respectively. GRE magnitude intensities and susceptibilities of ICH from day 2, 7 and 30 are compared in Fig. 4. Overall, magnitude intensity increases while susceptibility decreases from day 2 to day 30. For ICH magnitude intensity, significant difference was found only between day 2 and day 30 (P < 10-6). While for susceptibility measurements, significant differences were found between day 2 and day 7 (P < 5x10⁻⁴), day 7 and day 30 (P < 5x10⁻⁵), as well as day 2 to day 30 (P < 10-8).Discussion and conclusion
The SWI sequence is usually included in clinical stroke protocols to detect microbleeds. However, both GRE magnitude and SWI suffer from blooming artifacts, which may cause overestimation of the ICH size. QSM is a more robust method for ICH size measurement 4. The mean susceptibility of ICH correlates well with mean CT attenuation while magnitude correlates poorly with CT, suggesting QSM has better specificity to iron content in ICH. QSM of ICH evolves with the disease stage in a gradual and continuous manner, unlike magnitude-weighted images where signal may alternate rapidly due to rapid changes in T1 and T2 properties. QSM enables quantitative tracking of ICH evolution.
In conclusion, QSM of ICH had a good correlation with CT attenuation, providing similar information to a CT scan within an MRI exam. QSM enabled longitudinal tracking of susceptibility evolution of ICH, which may provide a new means to track ICH progression and effects of future therapeutic interventions.
Acknowledgements
Canadian Institutes of Health Research
Alberta Innovates: Health Solutions
References
1. Bradley WG Jr. MR appearance of hemorrhage in the brain. Radiology. 1993 Oct;189(1):15-26.
2. Sun H, Kate M, Gioia LC, Emery DJ, Butcher K, Wilman AH. Quantitative susceptibility mapping using a superposed dipole inversion method: Application to intracranial hemorrhage. Magn Reson Med. 2016 Sep;76(3):781-91.
3. Chang S, Zhang J, Liu T, Tsiouris AJ, Shou J, Nguyen T, Leifer D, Wang Y, Kovanlikaya I. Quantitative Susceptibility Mapping of Intracerebral Hemorrhages at Various Stages. J Magn Reson Imaging. 2016 Aug;44(2):420-5.
4. Wang S, Lou M, Liu T, Cui D, Chen X, Wang Y. Hematoma volume measurement ingradient echo MRI using quantitative susceptibility mapping. Stroke. 2013Aug;44(8):2315-7.
Figures