4625
Assessment of cerebral perfusion changes in asymptomatic internal carotid artery stenosis using multi-parametric arterial spin-labeling MRI1Medical Imaging, National Taiwan University Hospital, Taipei, Taiwan, 2Neurology, National Taiwan University Hospital, Taipei, Taiwan, 3Graduate Institute of Biomedical Electronics and Bioinformatics, National Taiwan University, Taipei, Taiwan, 4Radiology, Cathay General Hospital, Taipei, Taiwan, 5Graduate Institute of Oncology, National Taiwan University, Taipei, Taiwan, 6Graduate Institute of Clinical Medicine, National Taiwan University, Taipei, Taiwan
Synopsis
Internal carotid artery stenosis (ICAS) has been identified as a risk factor of ischemic stroke, with altered flow velocity and narrowed lumen commonly assessed by ultrasonography and angiography. However, hemodynamic change/compensation in microvasculature cannot be ruled out before symptoms. In this study, we investigated cerebral perfusion changes in asymptomatic ICAS by simultaneously assessing cerebral blood flow (CBF), arterial transit time (ATT), and flow territory, derived from arterial spin-labeling (ASL) MRI. Our data suggest that ATT and flow territory may be better predictors of high-grade unilateral ICA stenosis (≥70 %) than CBF in asymptomatic patients.
Introduction
Internal carotid artery stenosis (ICAS) has been identified as a risk factor of ischemic stroke 1,2, with altered flow velocity and narrowed lumen commonly assessed by ultrasonography and angiography. However, hemodynamic change/compensation in microvasculature cannot be ruled out before symptoms. It remains unclear whether or to what extent cerebral perfusion changes exist in asymptomatic ICAS. In this study, we investigated the changes by simultaneously assessing cerebral blood flow (CBF), arterial transit time (ATT), and flow territory, derived from arterial spin-labeling (ASL) MRI.Materials and Methods
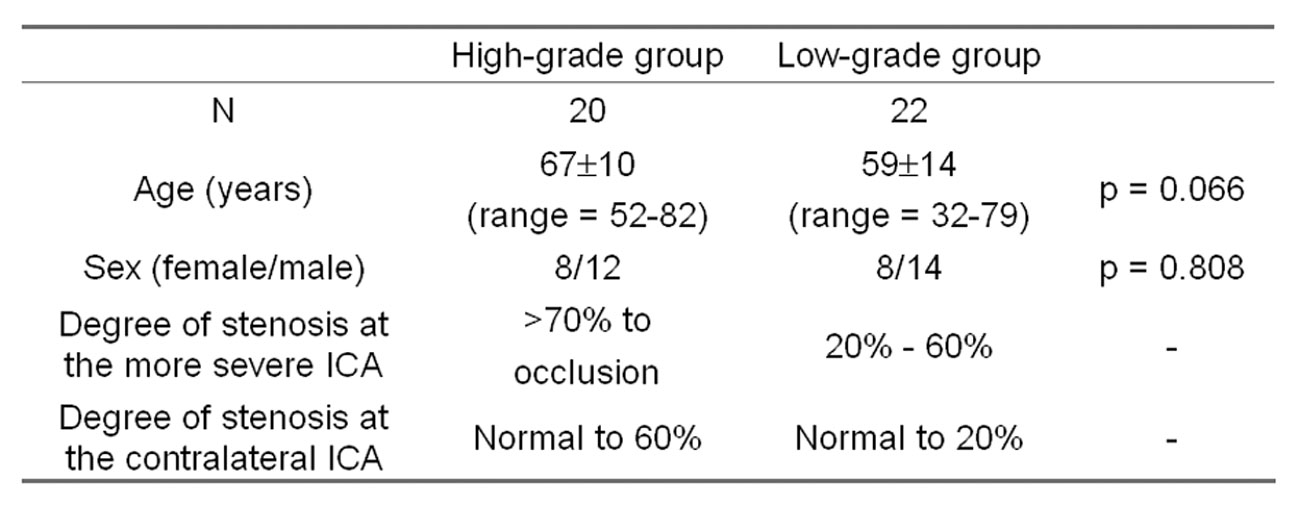
The institutional review board approved this study. Forty-two asymptomatic ICAS patients (all with adequate flow amount in the vertebral arteries (VA)) were recruited and divided into two groups according to ultrasonographic diagnosis: high-grade group for ≥70% stenosis and low-grade group for <70% stenosis. Grouping and demographics are summarized in Table 1. All participants provided written informed consent when recruited.
All MR imaging was performed on a 3-Tesla clinical system (Tim Trio, Siemens). Imaging protocol included fluid attenuated inversion recovery (FLAIR), T2-weighted turbo spin echo, T1-weighted imaging, and time-of-flight imaging. For ASL imaging, pseudo-continuous labeling 3,4 was employed, followed by single-shot gradient-echo echo-planar readout (TE = 13 ms, in-plane matrix = 64x64, 16 slices, slice thickness = 5 mm). For CBF measurement, TR = 5 s, labeling duration (τ) = 2 s, post-labeling delay (PLD) = 2000 ms, and 30 repetitions were obtained. For ATT measurement, TR = 4 s, τ = 1 s, and PLD was varied in separate scans (200, 500, 800, 1100, 1400, 1700, and 2000 ms; 10 repetitions for each PLD). For flow territory mapping, TR = 5 s, τ = 2 s, PLD = 2000 ms, and 4 steps of harmonic encoding 5 (8 repetitions for each step).
Image processing and analysis were performed using custom-designed
programs and Statistical Parametric Mapping (http://www.fil.ion.ucl.ac.uk/spm/)
in MATLAB (The MathWorks Inc., Natick,
MA, USA).
ASL images were realigned to remove head motion during the scan and corrected
for spatial variation of receiver sensitivity 6.
CBF and ATT were calculated based on the model reviewed previously 7.
Flow territory was estimated using independent component analysis and fuzzy
clustering, which yielded for each voxel membership levels of flow territories
(left ICA, right ICA, and VA). Existence of asymmetric changes
in CBF, ATT, and flow territory were assessed independently by two raters with
difference resolved by consensus.
Results
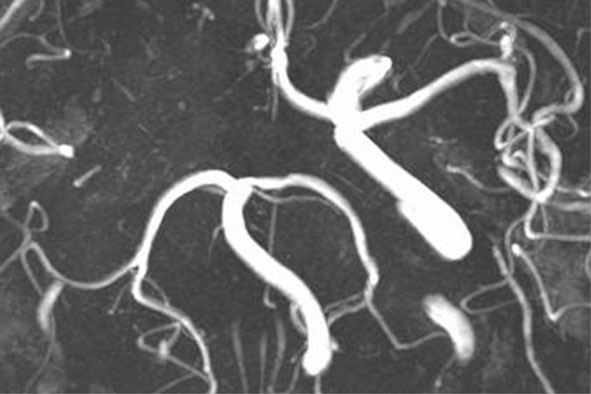
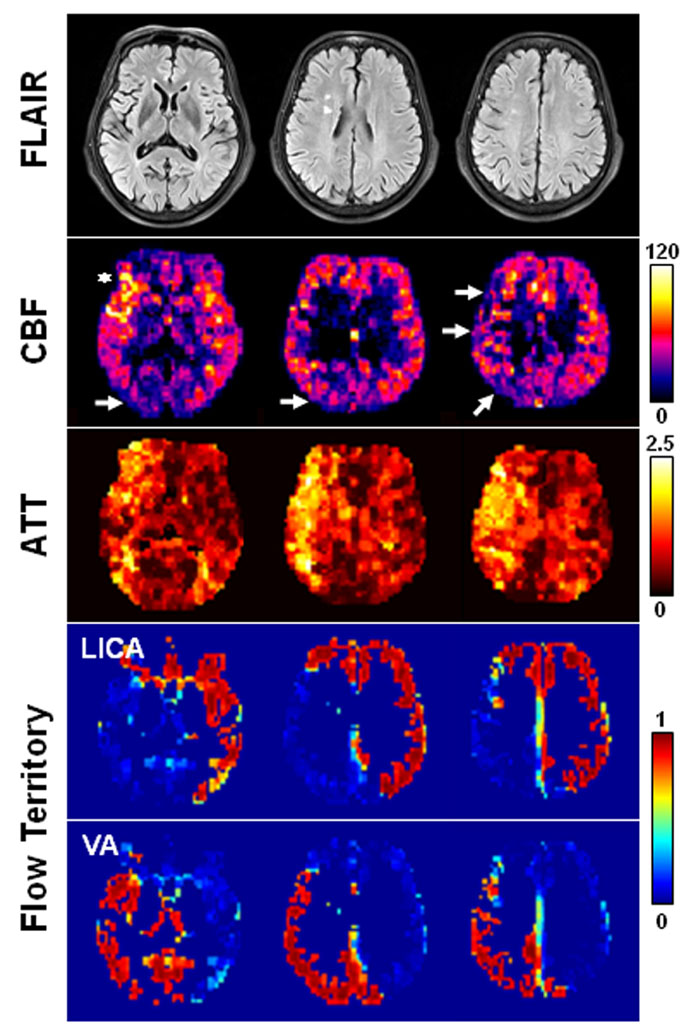
Figure 1 shows a high-grade patient in whom the right ICA was occluded and the left ICA had a mild stenosis (30-50%). No flow territory of right ICA was extractable. The left ICA supplies the left cerebrum including the MCA (middle cerebral artery) and ACA (anterior cerebral artery) territories and also the right anterior and medial frontal lobe which corresponds to a larger than normal right ACA territory. In addition to the occipital areas, the VA flow also supports the right posterior frontal and temporo-parietal area. Increased ATT is found in the right temporal area and parietal area. CBF is slightly decreased in the right parieto-occipital area (indicated by arrows) and intravascular hyperintensity is noted in the right MCA (indicated by asterisk), suggesting prolonged transit time.
Fisher's exact test indicates that the high-grade group tends to have a higher frequency in asymmetric ATT (p < 10-3) and asymmetric flow territory (p < 10-3) as compared to the low-grade group. The between-group difference in CBF asymmetry is marginal (p = 0.062). Logistic regression further reveals that hemispherical asymmetry in ATT or flow territory is associated with the existence of high-grade ICA stenosis (odds ratio = 11.8 and 21.2, respectively), whereas hemispherical asymmetry in CBF is not.
Discussion
Although CBF has been used to assess ischemic stroke and help demarcating penumbra 8, our data indicate that CBF provides marginal predictive value for asymptomatic low-grade ICA stenosis, presumably because the overall blood flow is relatively well-preserved in these patients. However, the preservation of CBF may involve hemodynamic changes as manifested in ATT increase and/or altered route of blood supply. As compared to low-grade patients, high-grade patients are more likely to have altered flow territory (odds ratio = 21.2) and prolonged ATT (odds ratio = 11.8).
In conclusion, ASL MR imaging enables contrast-material-free and simultaneous measurement of CBF, ATT, and flow territory. Our data suggest that ATT and flow territory may be better predictors of high-grade unilateral ICA stenosis (≥70 %) than CBF in asymptomatic patients.
Acknowledgements
This work was supported by Ministry of Science and Technology, Taiwan (grants: 102-2221-E-002-219, 103-2420-H-002-006-MY2, 104-2221-E-002-088, and 105-2314-B-002-094-MY3).References
1. Jungquist G, Nilsson B, Ostberg H, et al. Carotid artery blood flow velocity related to transient ischemic attack and stroke in a population study of 69-year-old men. Stroke. 1989;20(10):1327-1330.
2. Heijenbrok-Kal MH, Nederkoorn PJ, Buskens E, et al. Diagnostic performance of duplex ultrasound in patients suspected of carotid artery disease: the ipsilateral versus contralateral artery. Stroke. 2005;36(10):2105-2109.
3. Garcia DM, de Bazelaire C, Alsop D. Pseudo-continuous flow driven adiabatic inversion for arterial spin labeling. Proc Intl Soc Magn Reson Med. 2005;13:37.
4. Wu WC, Fernandez-Seara M, Detre JA, et al. A theoretical and experimental investigation of the tagging efficiency of pseudocontinuous arterial spin labeling. Magn Reson Med. 2007;58(5):1020-1027.
5. Wu WC. Mapping cerebral blood flow territories using harmonic encoding pseudocontinuous arterial spin labeling, fuzzy clustering, and independent component analysis. Proc Intl Soc Magn Reson Med. 2011:295.
6. Wu WC, Jiang SF, Yang SC, et al. Pseudocontinuous arterial spin labeling perfusion magnetic resonance imaging--a normative study of reproducibility in the human brain. Neuroimage. 2011;56(3):1244-1250.
7. Wu WC, St Lawrence KS, Licht DJ, et al. Quantification issues in arterial spin labeling perfusion magnetic resonance imaging. Top Magn Reson Imaging. 2010;21(2):65-73.
8. Schlaug G, Benfield, A, Baird AE, et al. The ischemic penumbra: operationally defined by diffusion and perfusion MRI. NEUROLOGY 1999;53:1528-1537.
Figures