4624
Decreased borderzone perfusion is related to brain parenchymal volume loss after subarachnoid hemorrhage1Department of Radiology, University Medical Center Utrecht, Utrecht, Netherlands, 2Danish Research Centre for Magnetic Resonance, Copenhagen University Hospital Hvidovre, Denmark, 3Department of Neurology and Neurosurgery, Brain Center Rudolf Magnus, University Medical Center Utrecht, Netherlands
Synopsis
Brain injury after aneurysmal subarachnoid hemorrhage (aSAH) has been linked to cerebral hypoperfusion in the acute and subacute disease stage. The areas most prone to hypoperfusion are the borderzone regions. In this study we obtained cerebral blood flow measurements in the subacute stage after aSAH, and longitudinal volumetric data. We found a moderate correlation between the ratio of borderzone/whole-brain perfusion and percentage brain volume loss. Thereby, perfusion in the watershed areas in the subacute stage could identify patients at a higher risk for future brain parenchymal volume loss. Consequently, increasing perfusion in these regions could be a future therapeutic target.
Background
Aneurysmal subarachnoid hemorrhage (aSAH) is associated with poor outcome: 40% of survivors remain functionally dependent.1 The possible causes of brain injury and long term impairment after aSAH are fourfold: the event itself, aneurysm treatment, Early Brain Injury (EBI) in the acute stage and Delayed Cerebral Ischemia (DCI) in the subacute stage. Both EBI and DCI have been linked to decreased cerebral perfusion.2-4 In ischemic stroke types, it has been shown that the areas most prone to hypoperfusion are the borderzone (watershed) regions located at the distal end of cerebral artery branches.5 As such, the perfusion within those areas is a sensitive marker to identify individuals with perfusion impairment who are, consequently, at risk for brain damage. In this study we hypothesize that a similar perfusion impairment in borderzone regions may be related to brain damage in patients with aSAH, and that it is a potential future therapeutic target.Purpose
The aim of this study was to investigate the relation between borderzone-perfusion and brain parenchymal volume loss after aSAH.Methods
Study protocol
This prospective, longitudinal study was approved by the review board of our institution. Thirty-seven patients with confirmed aneurysmal subarachnoid hemorrhage were enrolled in the study (Table 1). The first MRI scan (MRI1) was performed at a median of 14 (IQR 11-15, range 6-17) days after ictus. Follow-up imaging (MRI2 and MRI3) was performed at 6 (IQR 6-6, range 6-7) and at 19 (IQR 18-19, range 17-21) months after ictus.
Imaging protocol
The imaging protocol included a pseudocontinuous ASL (pCASL) sequence, a T2-fluid-attenuated inversion recovery (T2-FLAIR) sequence and a diffusion-weighted imaging (DWI) sequence. The scan parameters of the pCASL sequence were voxel size 3x3x7mm3, FOV 240x119x240mm3, TR/TE: 4000/14ms, and label duration 1650ms. A multislice echo planar imaging (EPI) readout was used with a 1525-2160ms postlabel delay. The imaging parameters of the T2-FLAIR sequence were TR/IT/TE = 10000/2800/120ms, voxel size 0.4x0.4x4mm3, 1 mm inter-slice gap), and those of the DWI sequence were TR/TE 3015/68ms, b-factors = 2(0 and 1000s/mm2), voxel size 0.5x0.5x4mm3, 1mm slice gap).
Image Analysis
To obtain quantitative perfusion maps, the obtained ASL images were processed using IDL 6.1 for Windows (ITT Visual Information Solutions, Boulder, C.O., U.S.A.). The quantitative perfusion maps were aligned to Montreal Neurological Institute (MNI) space. A whole-brain and borderzone-area mask were applied to obtain the mean global CBF, and the mean CBF in the borderzone areas. To minimize intersubject perfusion variability, the ratio of borderzone /global perfusion was calculated.
To obtain brain volume measurements, brain segmentation was performed in Statistical Parametric Mapping (SPM12)6 on the T2-FLAIR images. When necessary, lesions were segmented with the lesion prediction algorithm as implemented in the Lesion Segmentation Tool (LST) version 2.0.15 (www.statistical-modelling.de/lst.html) for SPM prior to brain segmentation.
Lesion occurrence was assessed on the T2-FLAIR and DWI images by an experienced neuroradiologist who was blinded for patient information.
Statistical analysis (Spearman correlation) was carried out with R (R Foundation for Statistical Computing, Vienna, Austria).
Results
Table 2 presents the following MRI results: CBF values, brain volume loss and lesion occurrence. Two illustrative cases can be found in Figure 1.
In the group of patients with at least 1 follow-up MR scan (MRI2) (n = 37), we found a correlation of ρ = -.41 (p=.012) between borderzone/global CBF ratio and relative brain volume loss between MRI1 and MRI2 (Figure 2). In the group of patients with at least 2 follow-up MR scans (MRI2, MRI3) (n = 20), we found a correlation of ρ = -.47 (p=.037) between borderzone/global CBF ratio and relative brain volume loss between MRI1 and MRI3 (Figure 2). No correlation was found between global CBF at MRI1 and brain volume loss between any of the time points.
Patients with low borderzone/global CBF ratios did not show a higher prevalence of lesions in the borderzone regions compared to patients with higher ratios, which indicates that the finding is not due to lesion presence in the borderzone regions.
Discussion and Conclusion
In this cohort of patients with a relatively good clinical status, we found a moderate correlation between the ratio of borderzone/global perfusion and percentage brain volume loss. Thereby, perfusion in the borderzone regions in the subacute stage could identify patients at a higher risk for future brain parenchymal volume loss. In addition, we demonstrated that whole brain CBF does not hold the same prognostic value. Hypoperfusion in the borderzone regions is a symptom of underlying perfusion deficits, such as longer arterial transit times.7, 8 Consequently, increasing perfusion in these regions could be a future therapeutic target.Acknowledgements
This work was supported by the Netherlands Organization for Scientific Research (NWO) under grant n° 91712322 (JH), the European Research Council under grant agreements n° 637024 (JH).References
1. Zacharia
BE, Hickman ZL, Grobelny BT, DeRosa P, Kotchetkov I, Ducruet AF, et al.
Epidemiology of aneurysmal subarachnoid hemorrhage. Neurosurg Clin N Am. 2010;21:221-233.
2. Cahill
J, Calvert JW, Zhang JH. Mechanisms of early brain injury after subarachnoid
hemorrhage. J Cereb Blood Flow Metab.
2006;26:1341-1353.
3. Dankbaar
JW, Rijsdijk M, van der Schaaf IC, Velthuis BK, Wermer MJ, Rinkel GJ.
Relationship between vasospasm, cerebral perfusion, and delayed cerebral
ischemia after aneurysmal subarachnoid hemorrhage. Neuroradiology. 2009;51:813-819.
4. Marbacher
S, Neuschmelting V, Andereggen L, Widmer HR, von Gunten M, Takala J, et al.
Early brain injury linearly correlates with reduction in cerebral perfusion
pressure during the hyperacute phase of subarachnoid hemorrhage. Intensive Care Med Exp. 2014;2:30.
5. Zaharchuk
G, Olivot JM, Fischbein NJ, Bammer R, Straka M, Kleinman JT, et al. Arterial
spin labeling imaging findings in transient ischemic attack patients:
Comparison with diffusion- and bolus perfusion-weighted imaging. Cerebrovasc Dis. 2012;34:221-228.
6. Ashburner
J, Barnes G, Chen C, Daunizeau J, Flandin G, Friston K, et al. Spm12 manual.
2014.
7. Zaharchuk
G, Bammer R, Straka M, Shankaranarayan A, Alsop DC, Fischbein NJ, et al.
Arterial spin-label imaging in patients with normal bolus perfusion-weighted mr
imaging findings: Pilot identification of the borderzone sign. Radiology. 2009;252:797-807.
8. Hendrikse J, Petersen ET, van Laar PJ, Golay X. Cerebral
border zones between distal end branches of intracranial arteries: Mr imaging. Radiology. 2008;246:572-580.
Figures
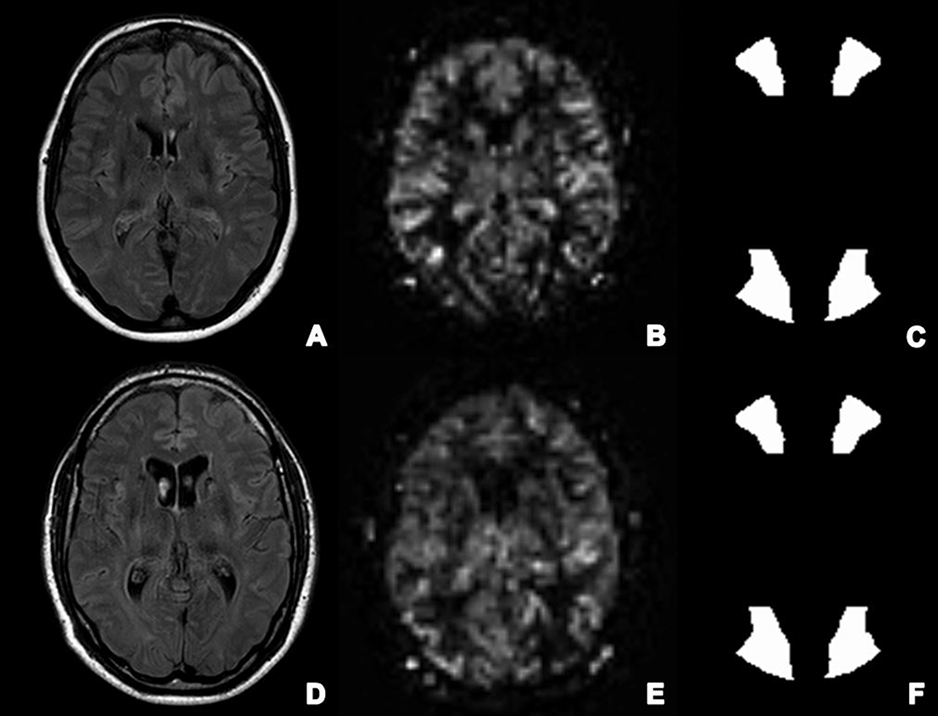
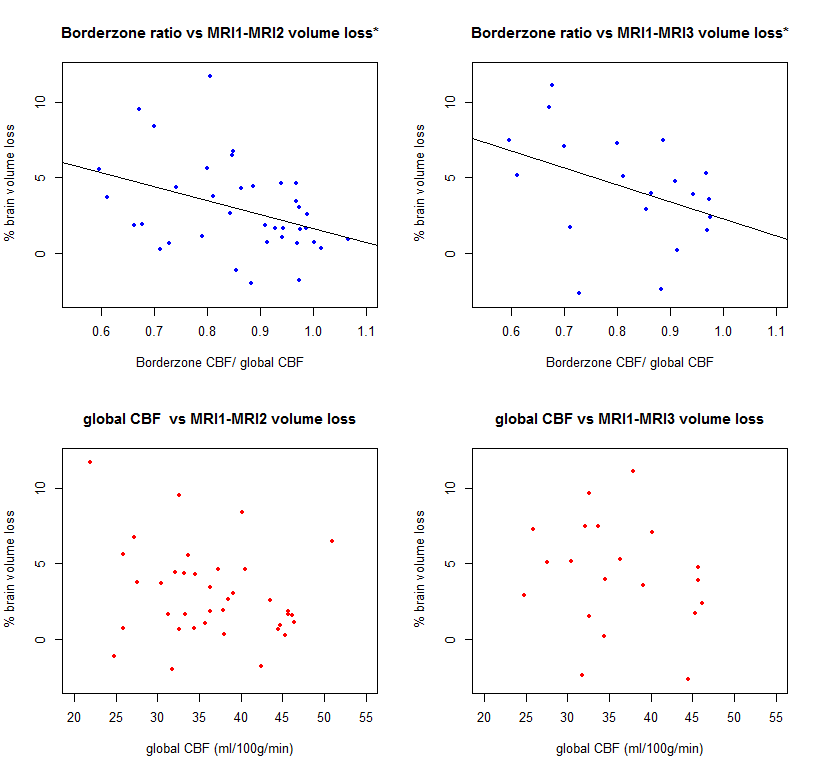
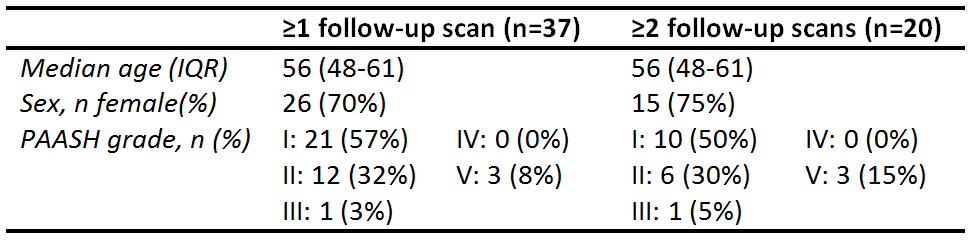
Table 1. Patient characteristics at admission. PAASH =Prognosis on Admission of Aneurysmal Subarachnoid Hemorrhage.
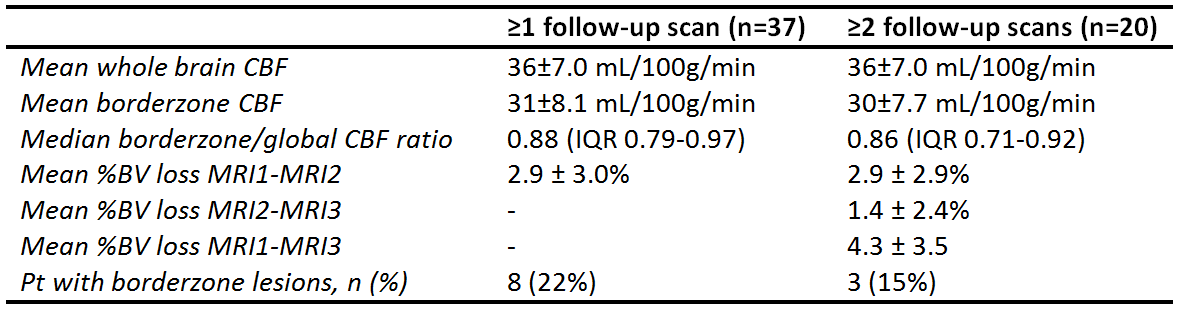
Table 2. Lesion characteristics at MRI1, MRI2 and MRI3. CBF = Cerebral Blood Flow; BV = Brain Volume; Pt = patients; DWI = Diffusion Weighted Imaging.