4622
Correlating clinical outcome with voxel-based quantitative multiparametric MRI analysis in chronic ischemic stroke1U836, Inserm, Grenoble, France, 2Université Grenoble Alpes, Grenoble Institut des Neurosciences, Grenoble, France, 3Grenoble University Hospital, Grenoble, France
Synopsis
Predicting clinical outcome following stroke remains a challenge for magnetic resonance imaging (MRI). In this study, we acquired longitudinally (3 sessions) multiparametric MRI data sets including diffusion-weighted and perfusion-weighted images of 30 patients with chronic ischemic stroke. All of the diffusion and perfusion MRI parameters were analyzed by the classic whole-lesion approach and the parametric response map (PRM), a voxel-based post-processing approach at each time point. The results emphasized the superiority of the PRM over the whole-lesion approach for the prediction of long-term outcome based on early MRI data.
Introduction
Stroke is a major cause of death and long-term handicap in the western world. An early evaluation of the long-term clinical outcome is highly desirable to guide the development of therapeutic strategies. Multiparametric MRI (e.g. diffusion-weighted imaging and Perfusion-weighted imaging) can provide multiple information on stroke evolution. Furthermore, this large amount of information may be quantitatively evaluated using parametric maps. For a given parametric map, the intralesional characteristics are summarized by a mean value of all the pixels in a manually-defined region of interest (ROI). This analysis approach may easily masks focal changes within the lesion leading to a loss of important details which reflect the actual evolution of stroke. To improve the prediction of long-term clinical outcome based on diffusion and perfusion MRI sequences, measures within the lesion can be refined by using a voxel-wise analytic approach such as parametric response map analysis (PRM), which uses longitudinal MRI maps co-registered in time. The goal of this study was to compare the potential of the PRM analysis with that of the classical mean, whole ROI, analysis, to predict long-term outcome of stroke patients.Methods
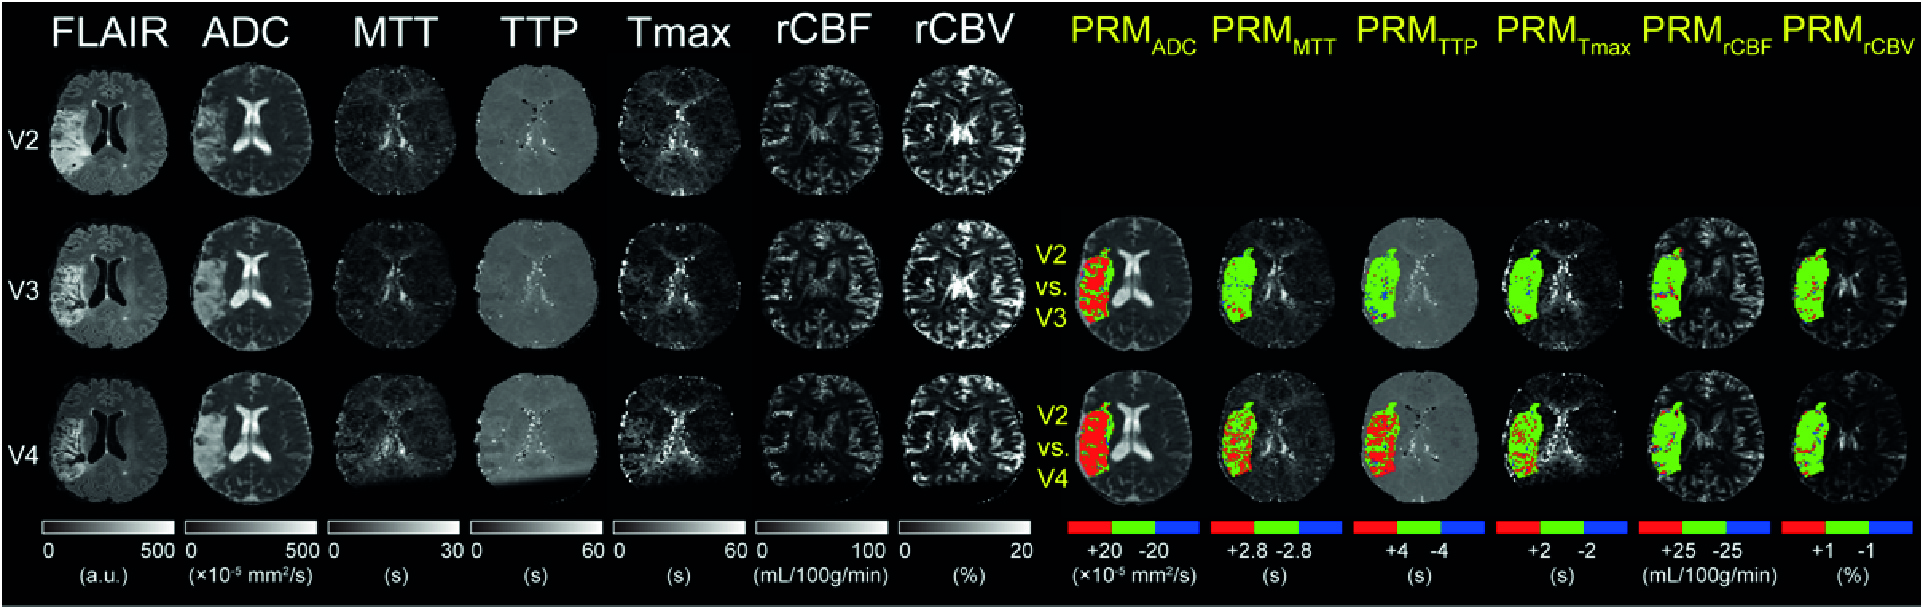
Thirty patients with chronic stroke (either hemisphere) from August 2010 were selected. The study was approved by the local Ethics Committee and patients were included after providing a written informed consent. One MRI session was composed as follow: FLAIR, diffusion (ADC) and dynamic contrast-susceptibility (DSC) imaging. DCS-MRI was performed following an intravenous administration of bolus of gadolinium using a EPI sequence. Patients underwent 4 MRI sessions at 1, 2, and 3 months after the stroke (denoted V2, V3, and V4, respectively). The relative cerebral blood volume (rCBV), blood flow (rCBF), mean transit time (MTT), time-to-peak (TTP) and time-max (Tmax) were computed as described previously (2). All images were co-registered to FLAIR images acquired during the first MR session using a fully automated algorithm (SPM12; Matlab). Then, the stroke lesions were manually contoured on FLAIR images by a neuroradiologist. Then, 2 post-processing approaches were evaluated on every parametric maps to quantify stroke evolution: i) whole-lesion mean approach and ii) a PRM analysis. Briefly, and taking rCBV as example, PRM was performed by: calculating the difference in the rCBV values of each voxel within the lesion at V3 and V4 with respect to V2 values, applying a confidence interval (CI, determined for each parameter of contralateral tissue), marking in red voxels with a difference above that CI, in blue voxels below that CI, and in green voxels within that CI. Voxels were summed by type (red, blue, green) to obtain stroke volume fractions that showed significantly increased (PRMrCBV+: red), significantly decreased (PRMrCBV-: blue), and unchanged (PRMrCBV0: green) rCBV values over time (1). The same analyses were performed for ADC, rCBF, MTT, TTP and Tmax maps. Severity of neurological deficit on admission was assessed by NIHSS, and functional deficit measured by mRS 5 months post stroke (V5). ROC curve analysis was applied to define the most predictive parameter for the clinical outcome.Results
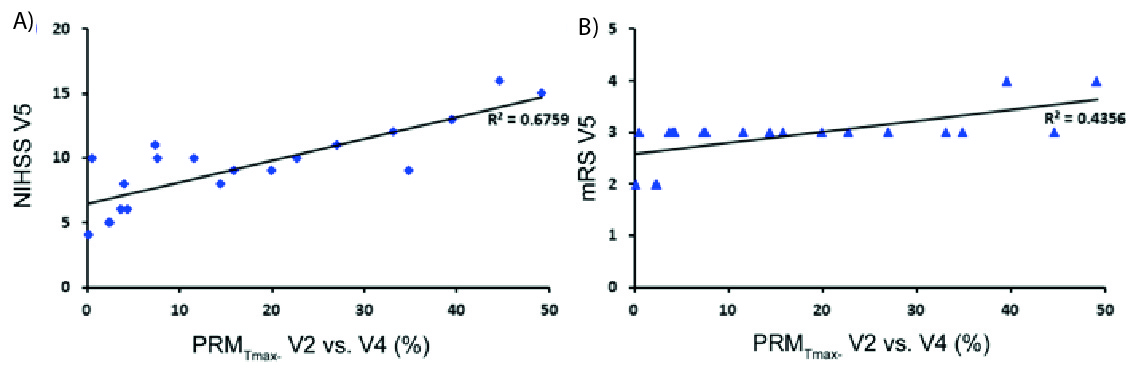
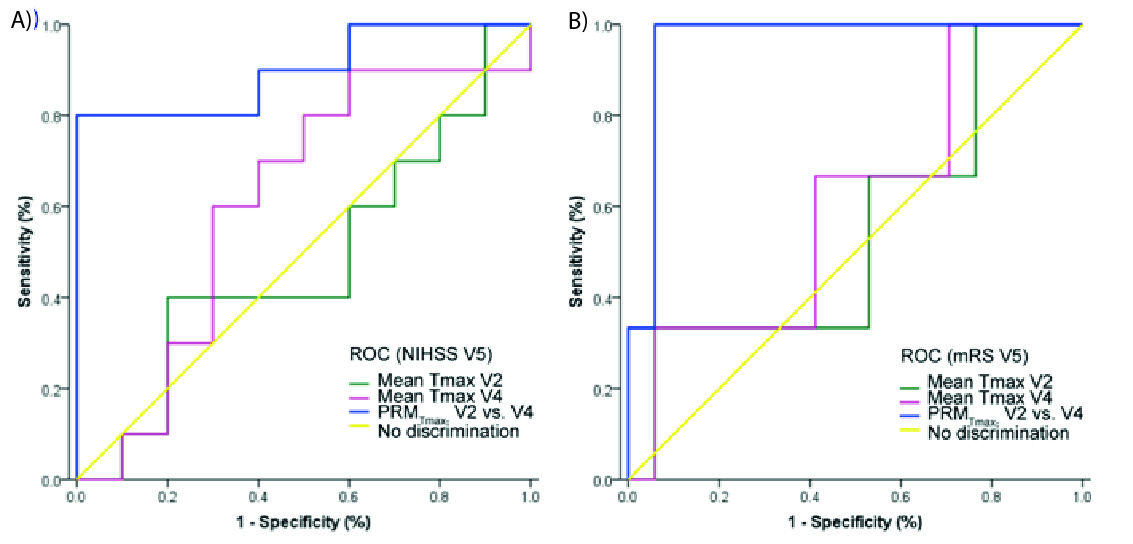
One representative patient is presented in fig 1. Among all the metric tested, PRM analysis using the Tmax was the most significant predictor of patient outcome. The Tmax changes estimated by both whole-lesion approach and PRM are illustrated by scatter plot versus both NIHSS and mRS at a later time point (Fig.2). The mean change of Tmax value at each early time point was not correlated with the NIHSS or mRS at V5, whereas the PRMTmax- at V4 was correlated with both NIHSS and mRS at V5 (Fig.2). The ROC curves indicated that PRMTmax- at V4 can predict both NIHSS and mRS at V5 and be superior to the mean Tmax value at V2 and V4 respectively. For the prediction of NIHSS at V5, the PRMTmax- had the largest AUC (0.900, p = 0.002) and the sensitivity and specificity were 0.80 and 0.98 respectively using the cutoff of 8.8 (Fig.3). For the prediction of mRS at V5, the PRMTmax- had the largest AUC (0.961;p = 0.013) and the sensitivity and specificity were 0.98 and 0.94 respectively using the cutoff of 3.1 (Fig.3).Conclusions
The results revealed the correlation between clinical prognosis (based on NIHSS and mRS) and MRI metrics and emphasized the superiority of the PRM over the whole-lesion approach for the prediction of long-term outcome, which suggested that complementary information for the predictive assessment of post-stroke outcome can be obtained by the PRM analysis. Moreover, PRM highlight areas within the lesion were changes occur. This could prove useful to guide rehabilitation and the evaluation of stroke therapies.Acknowledgements
Grenoble MRI facility IRMaGe was partly funded by the French program "Investissement d’Avenir” run by the "Agence Nationale pour la Recherche"; Grant "Infrastructure d’avenir en Biologie Santé" - ANR-11-INBS-0006. The clinical program was sponsored by the PHRC ISIS and HERMES.References
1. Galbán CJ, Chenevert TL, Meyer CR, Tsien C, Lawrence TS, Hamstra DA, et al. The parametric response map is an imaging biomarker for early cancer treatment outcome. Nat Med. 2009;15(5):572-6.
2. Bouvier J, Detante O, Tahon F, Attye A, Perret T, Chechin D, et al. Reduced CMRO(2) and cerebrovascular reserve in patients with severe intracranial arterial stenosis: a combined multiparametric qBOLD oxygenation and BOLD fMRI study. Human brain mapping. 2015;36(2):695-706. Epub 2014/10/14.
Figures