4619
Correlation of microstructure differences in diffusion MRI scans with Fugl-Meyer assessment scores in stroke subjects1Biomedical Engineering, University of Utah, Salt Lake City, UT, United States, 2Radiology and Imaging Sciences, University of Utah, 3Occupational Therapy, University of Utah, Salt Lake City, UT, United States, 4Neurology, University of Utah, 5Radiology and Imaging Sciences, Biomedical Engineering, University of Utah, Salt Lake City, UT, United States
Synopsis
Improved characterization of brain microstructure is important for image-based methods for diagnosing stroke. We explored the extent to which microstructural maps including Fractional Anisotropy (FA), Generalized Fractional Anisotropy (GFA), and Neurite Orientation Dispersion Density Index (NODDI) detect ipsilateral and contralateral differences in stroke patients as a measure of stroke severity. The difference between hemispheres was correlated with Fugl-Meyer Assessment motor function scores and the results of 16 patient scans reported. Results suggest that the Orientation Dispersion Index (ODI) contains information that could be clinically useful in understanding stroke recovery.
Purpose
Understanding microstructure differences could be important in the diagnosis and prognosis of stroke. We seek to understand whether certain methods of computing microstructure maps yield information that can be used to predict stroke outcomes. In particular, we wanted to understand whether diffusion spectrum imaging (DSI) based NODDI models could potentially have more sensitivity to microstructure damage following stroke than standard diffusion tensor imaging (DTI) methods such as FA and GFA. Determining the correlation between an image-based measure of severity and clinical motor assessments is a positive step towards image-based stroke prognosis for motor ischemic stroke.Methods
Acquisition and Clinical Assessment of Stroke Severity
16 data sets of motor ischemic stroke subjects were acquired by DSI with a b-max of 4000 and 203 directions1 on a Siemens 3T Verio scanner using a 32 channel head coil. A simultaneous multi-slice blipped CAIPI sequence2 was used with a slice acceleration factor of three. The 16 scans included 9 baseline scans, 5 scans at 1 month time point, and 2 scans at 3 month time point. Following each scan, a Fugl-Meyer assessment (FM) of motor function was performed with higher scores representing better motor control. The assessment includes scores for Upper Extremity (UE) and Lower Extremity (LE) and a composite which is the sum of the two 3.Processing
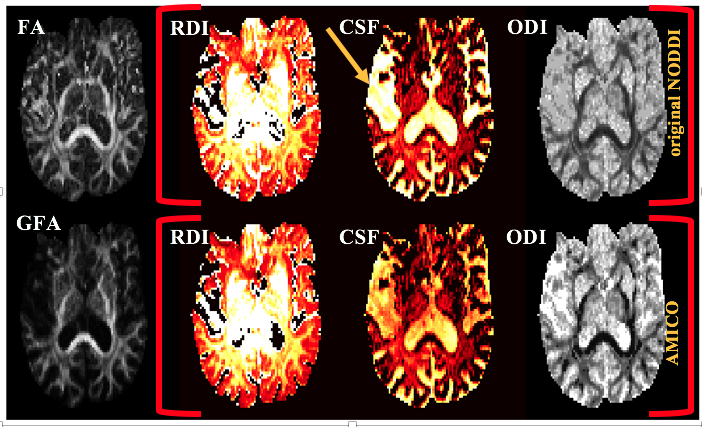
Segmentation of stroke regions was performed manually using ITK-Snap software. FA, GFA4, and two versions of NODDI maps were computed: the slower original NODDI method5,6, and the faster Accelerated Microstructure Imaging via Convex Optimization (AMICO) NODDI method7,8 (Fig 1).Analysis
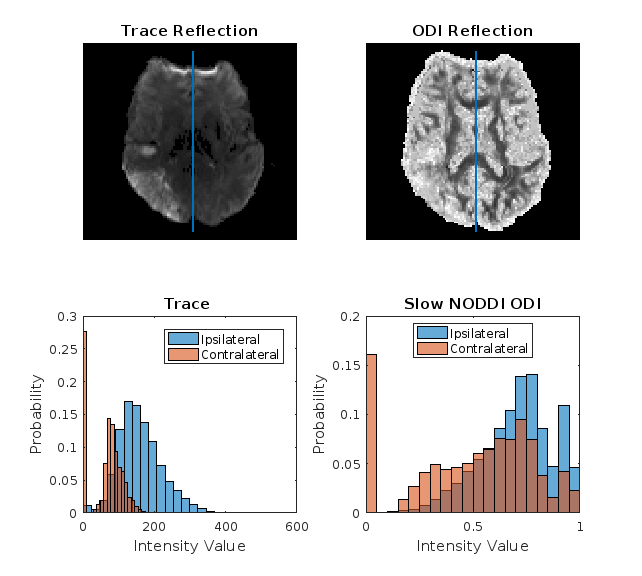
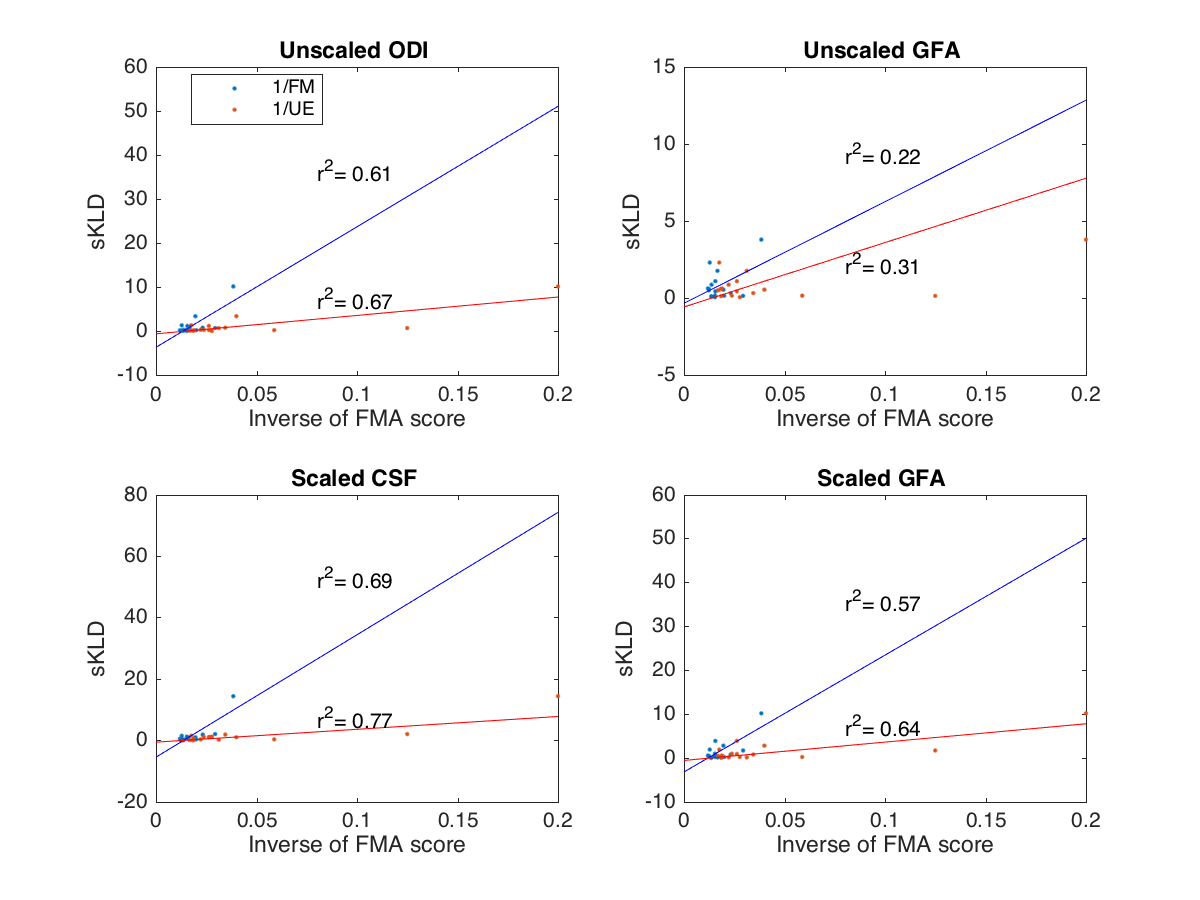
For each stroke segmentation, a reflection onto the contralateral hemisphere was calculated. The symmetric Kullback-Leibler Divergence (sKLD)9 was calculated between the ipsilateral stroke region and its contralateral reflection10 (Fig 2). The correlation coefficient was calculated for FM with the ipsilesional and contralesional means. Correlation was also found for the inverse of each FM component, 1/FM, 1/UE, and 1/LE, with the sKLD and stroke volume. Inverse FM scores provide a better relation because sKLD is non-linear measure of the distance between distributions. Lastly, the sKLD values were scaled by multiplying each sKLD by the volume of the stroke region and again correlated with 1/FM, 1/UE, and 1/LE .Results
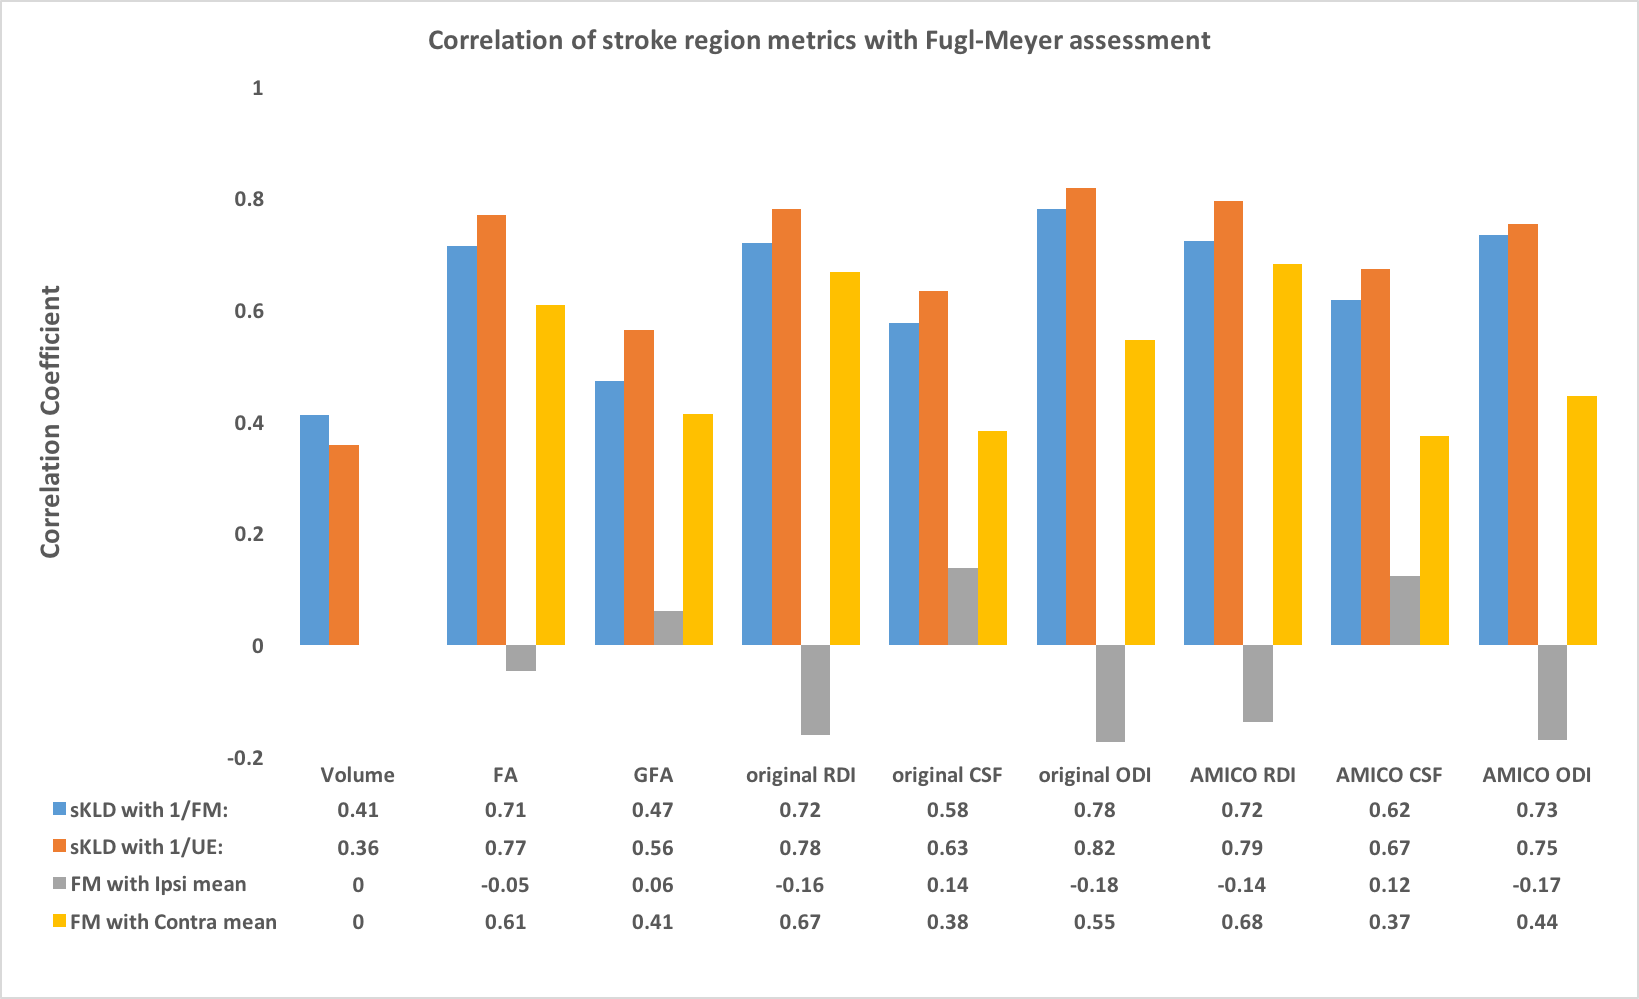
The highest correlation was found for Slow NODDI ODI sKLDs with 1/FM and 1/UE (Table 1). Consistent with the correlation results, paired t-tests for the mean value in the ipsilateral and contralateral stroke regions showed that only for the NODDI ODI maps were the mean values significantly different between hemispheres (original p=0.00089, AMICO p=0.0016). Correlation with FM for ipsilesional mean values were below 0.3, but correlation of contralesional mean values in FA and RDI was above 0.6 (Table 1). Volume-scaling sKLD values raised the correlation of GFA and CSF microstructure maps 30-60% (Fig 3).
Discussion
Unexpectedly, the highest correlation for non-volume scaled sKLDs with 1/FM and significantly different means between ipsilateral and contralateral regions, were found in the Slow ODI map. ODI is focused on the regions outside of neurons and seeks to characterize fiber directions by examining the extra-cellular space and capturing the anisotropy of these regions which is not considered in strictly white matter FA and GFA maps 5,7. This suggests, and agrees with other studies, that white matter analysis alone yields an incomplete picture11. The RDI and FA maps, had similar values for correlation with composite FM scores and UE scores. The fact that the correlation of GFA was so much lower than all the other maps, including the NODDI CSF maps, was surprising because it is supposedly an improved measure of white matter. Our findings thus far also align with the general finding by Granziera et al12,13, that contralesional means correlate with clinical assessments.Conclusion
The increase in correlation in the GFA and CSF maps after scaling by volume could be a useful tool for stroke analysis. Moreover, the relatively unchanged, and high correlation of ODI and RDI maps following volume scaling, suggest that they may be sensitive to microstructure changes following stroke not present in the other models. While volume itself is not a predictor of stroke severity14, volume scaling the sKLD had a notable effect. The approach may lead to a more sophisticated measure that takes into account differences between brain hemispheres and is sensitive to volume depending on lesion location.
This study will continue to enroll subjects and validate the results obtained thus far. Time point analysis will be done to determine whether DSI models such as NODDI better capture ipsilesional and contralesional differences, and whether these differences show trends that could be used in clinical prognosis for ischemic stroke subjects.
Acknowledgements
This work is supported by R01NS083761.References
[1] Kuo et al., Neuroimage, 41:7-18, 2008. [2] https://www.cmrr.umn.edu/multiband/ [3] Sullivan et al., Stroke 42:427-432, 2011 [4] http://fsl.fmrib.ox.ac.uk/fsl/fslwiki/ [5] Zhang et al., Neuroimage, 61:1000-16, 2012 [6] http://mig.cs.ucl.ac.uk/index.php?n=Tutorial.NODDImatlab [7] Daducci et al., Neuroimage, 105:32-44, 2015 [8] https://github.com/daducci/AMICO [9] Adluru et al., IEEE EMBC, 36:742-745, 2014 [10] https://cran.r-project.org/web/packages/entropy/index.html [11] Gauthier et al., Stroke. 39(5): 1520–1525, 2008. [12] Granziera et al., Int Soc Magn Reson Med, p. 4199, 2011. [13] Granziera et al., Neurology, vol. 79, pp. 39-46, 2012. [14] Puig, American Journal of Neuroradiology, vol. 32, no. 5, pp. 857–863, Jul. 2011.
Figures