4616
Identifying Perfusion Deficit Patterns in Unilateral Middle Cerebral Artery Stenosis Patients using Multi-Inversion Time Arterial Spin Labeling1Department of Radiology, Peking Union Medical College Hospital, Peking Union Medical College, Chinese Academy of Medical Sciences, Beijing, China, Beijing, People's Republic of China, 2Siemens Healthcare, MR Collaborations NE Asia, Beijing, China, 3Department of Neurology, Peking Union Medical College Hospital, Peking Union Medical College, Chinese Academy of Medical Sciences, Beijing, China, Beijing, People's Republic of China, 4Siemens Healthcare, ApplicationDevelopment, Erlangen, Germany
Synopsis
To investigate the perfusion pattern in patients with unilateral middle cerebral artery stenosis, a multi-inversion time pulsed arterial spin labeling technique was used to measure the cerebral blood flow and bolus arrival time (BAT). The preliminary results indicatethat patients with cerebral infarction (CI) had longer BAT than patients with transient ischemic attack (TIA). Assuming CBF valuesare corrected in the areas with BAT longer than 1300ms and combine the corrected CBF with the BAT, we can distinguish TIA and CI cases from their perfusion deficits patterns.
Purpose
Arterial spin labeling (ASL) is a noninvasive technique to assess the cerebral blood flow (CBF) and is gaining acceptance as an imaging technique for perfusion deficit evaluation in brain-vascular diseases. A previous study reported that ASL with multi-inversion times (mTI) canmeasure cerebral blood flow and classify different grades of gliomas more accurately than with a standard single-inversion time [1]. In this preliminary study, we aimed to evaluate the utility of parameters obtained from mTI-ASL in measuring perfusion conditions in patients with unilateral middle cerebral artery stenosis and investigated the specific perfusion deficit patterns of patients with transient ischemic attack (TIA) and cerebral infarction (CI).Methods
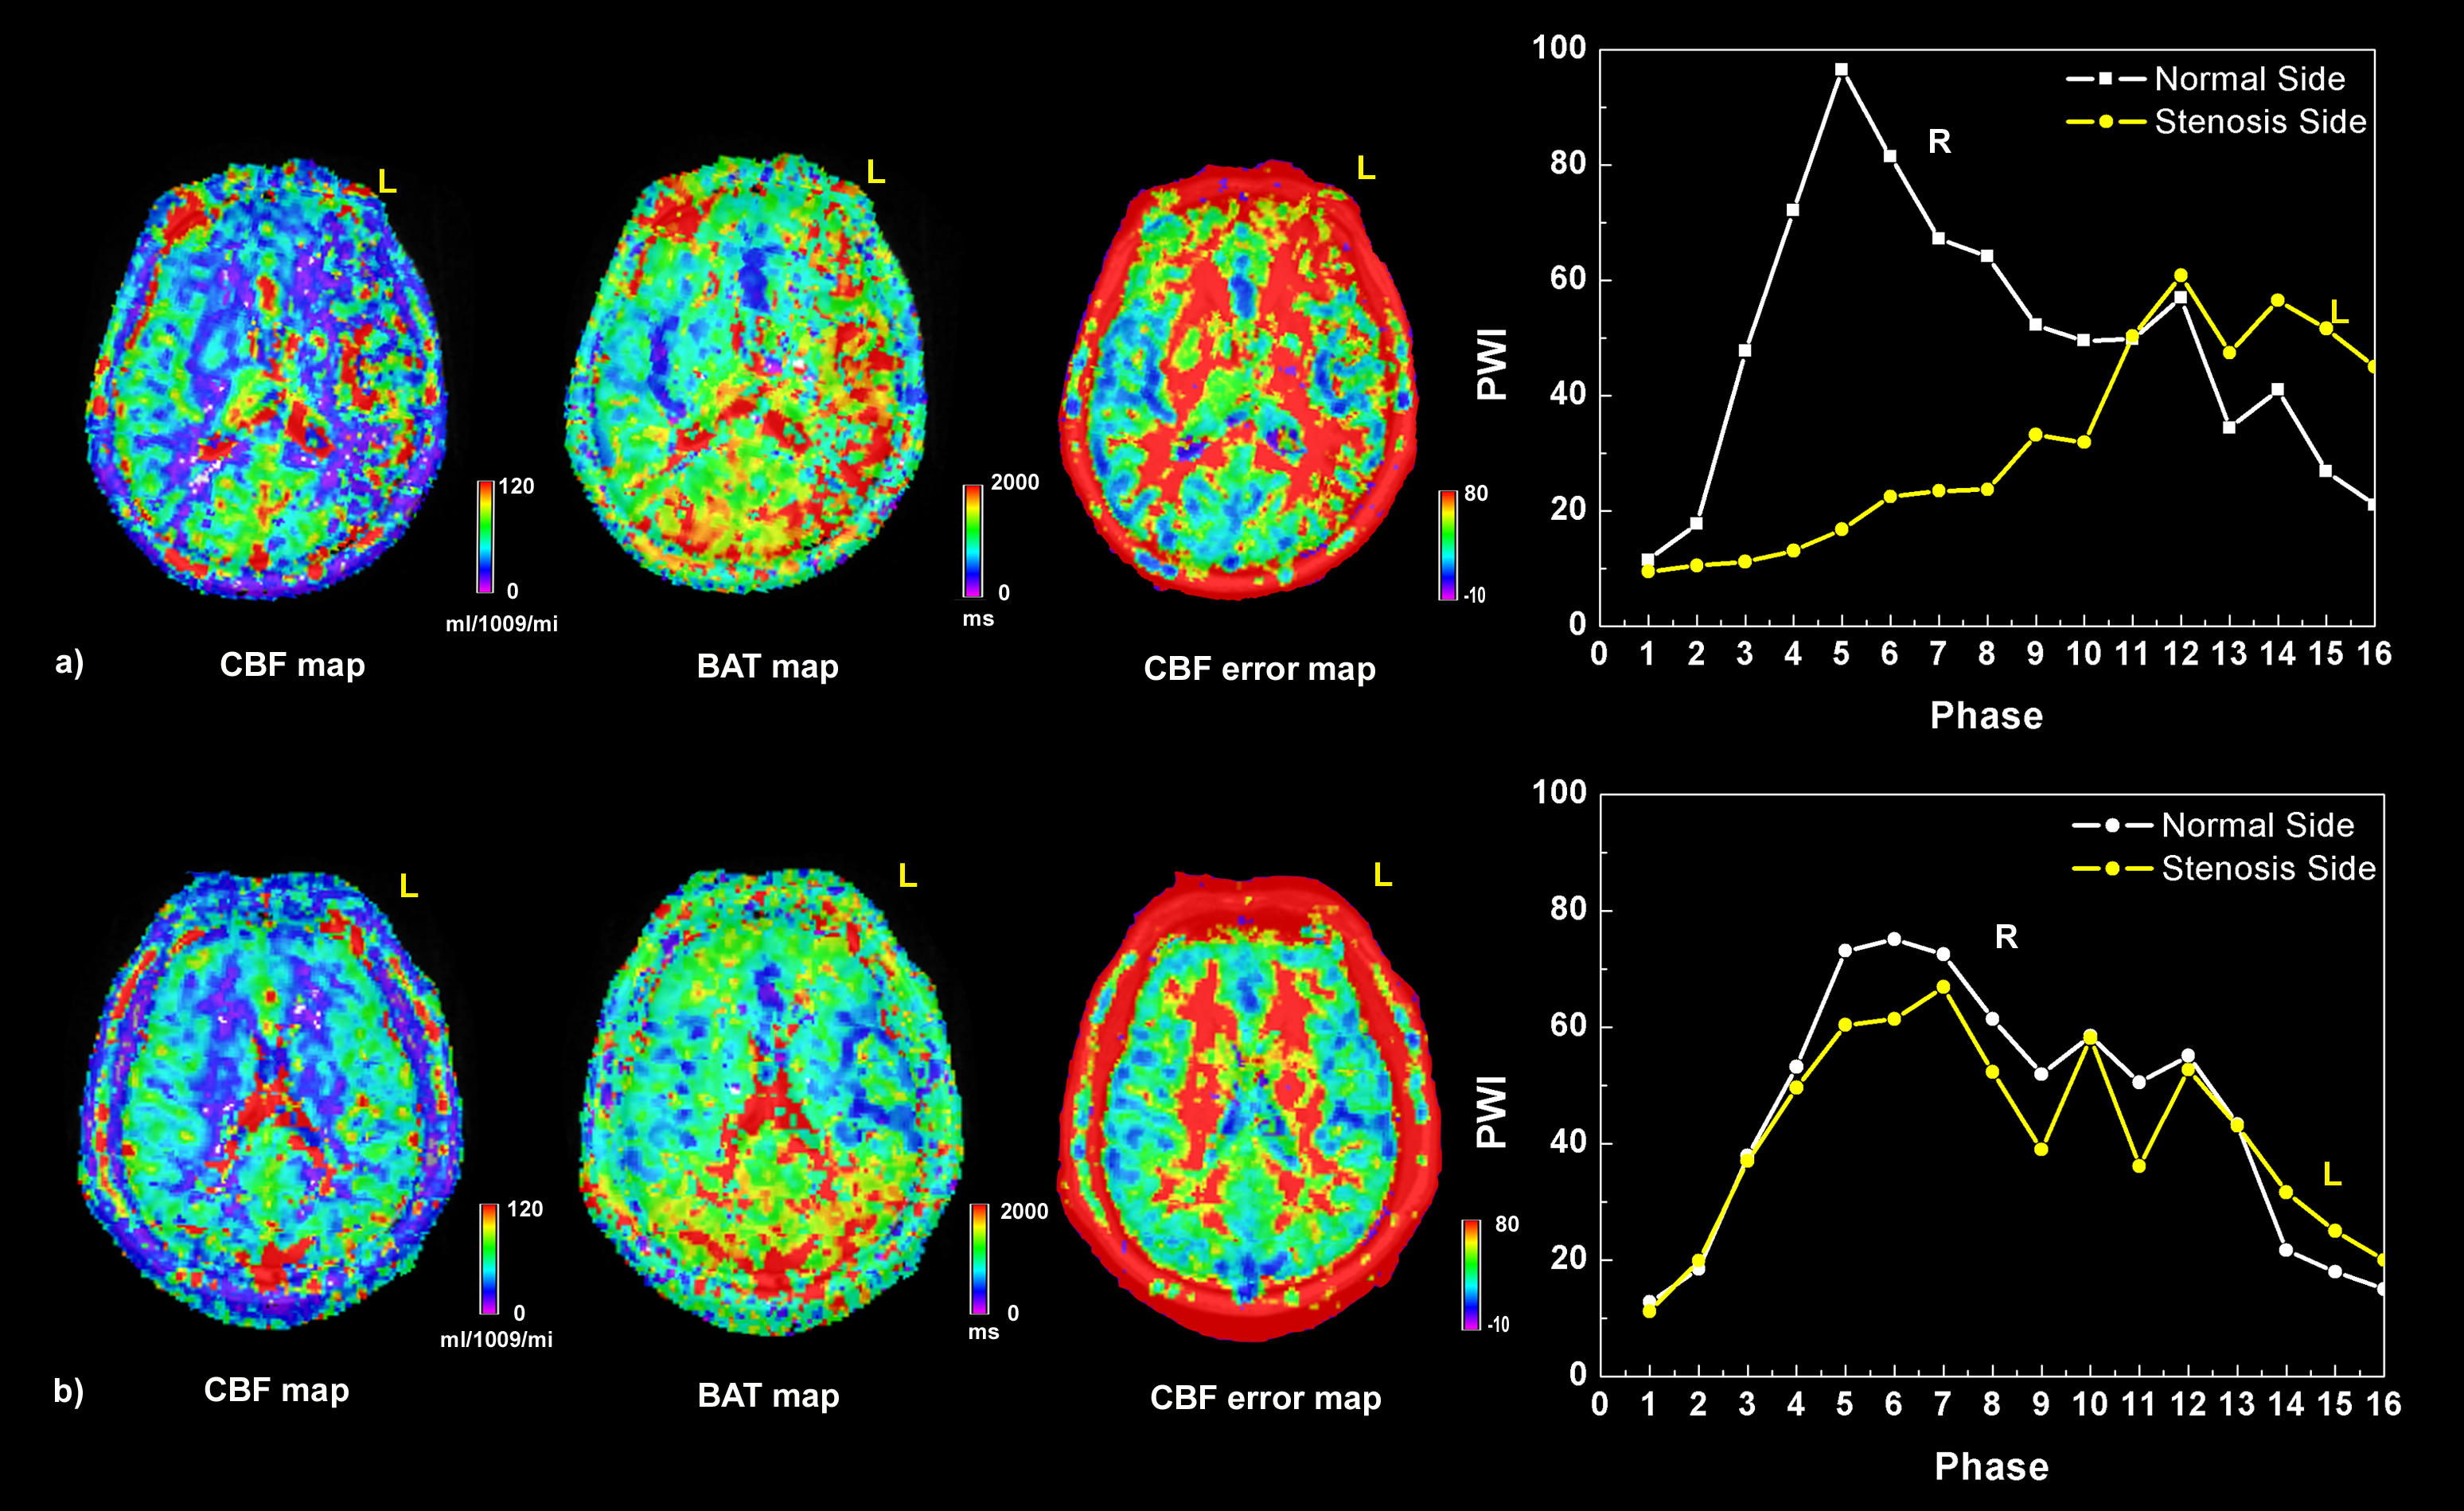
12 patients with severe cerebrovascular stenosis (>70%) or occlusion of the unilateral middle cerebral artery (MCA) were enrolled in this study. Grading of stenosis was confirmed by MR angiography exam. Six of as the subjects had a Transient Ischemic Attack (TIA) (4 males, age ranging from 56 to 70) and the other six (6 males, age raging from 52 to 66) had a cerebral infarction (CI). All data were acquired on a MAGNETOM Skyra 3T MR scanner (Siemens, Erlangen, Germany). mTI-ASL images were acquired using a prototype sequence with the following parameters: TR/TE = 4600/22ms, slice thickness = 4mm, 24 slices, FOV = 220 × 220mm2, voxel size = 3.4 x 3.4 × 4.0mm3, bolus length = 700ms, 16 TIs from 480 to 4080ms, and total acquisition time = 5:09 min including an M0 scan. The perfusion CBF/BAT/error maps were calculated by fitting the perfusion-weighted data (PWI) of 16 phases (TIs) to a Buxton model [2]. Regions of interest (ROIs), which covered one standard slice of MCA territory1, were manually selected based on T2-FLAIR images for each patient. Then, the mean value of CBF, BAT, and perfusion-weight of 16 different phases within in the ROI were measured. To test if the CBF values obtained by curve fitting were consistent with the trend of PWI signal on the stenosis side, we recalculated the mean CBF value on the stenosis side (ss) based on the CBF and the peak value of the PWI curve on the normal side (ns) for each patient. The corrected CBF (CBF-C) was calculated based on the following equation: CBF-Css= CBF-ns*PWI-ss/ PWI-ns. A pairedt-test analysis was employed to compare CBF/CBF-C on the normal and stenosis sides. A fisher linear discriminant analysiswas applied to test the performances of CBF,CBF+BAT,CBF-C+BAT in classifying TIA and infarction.Results
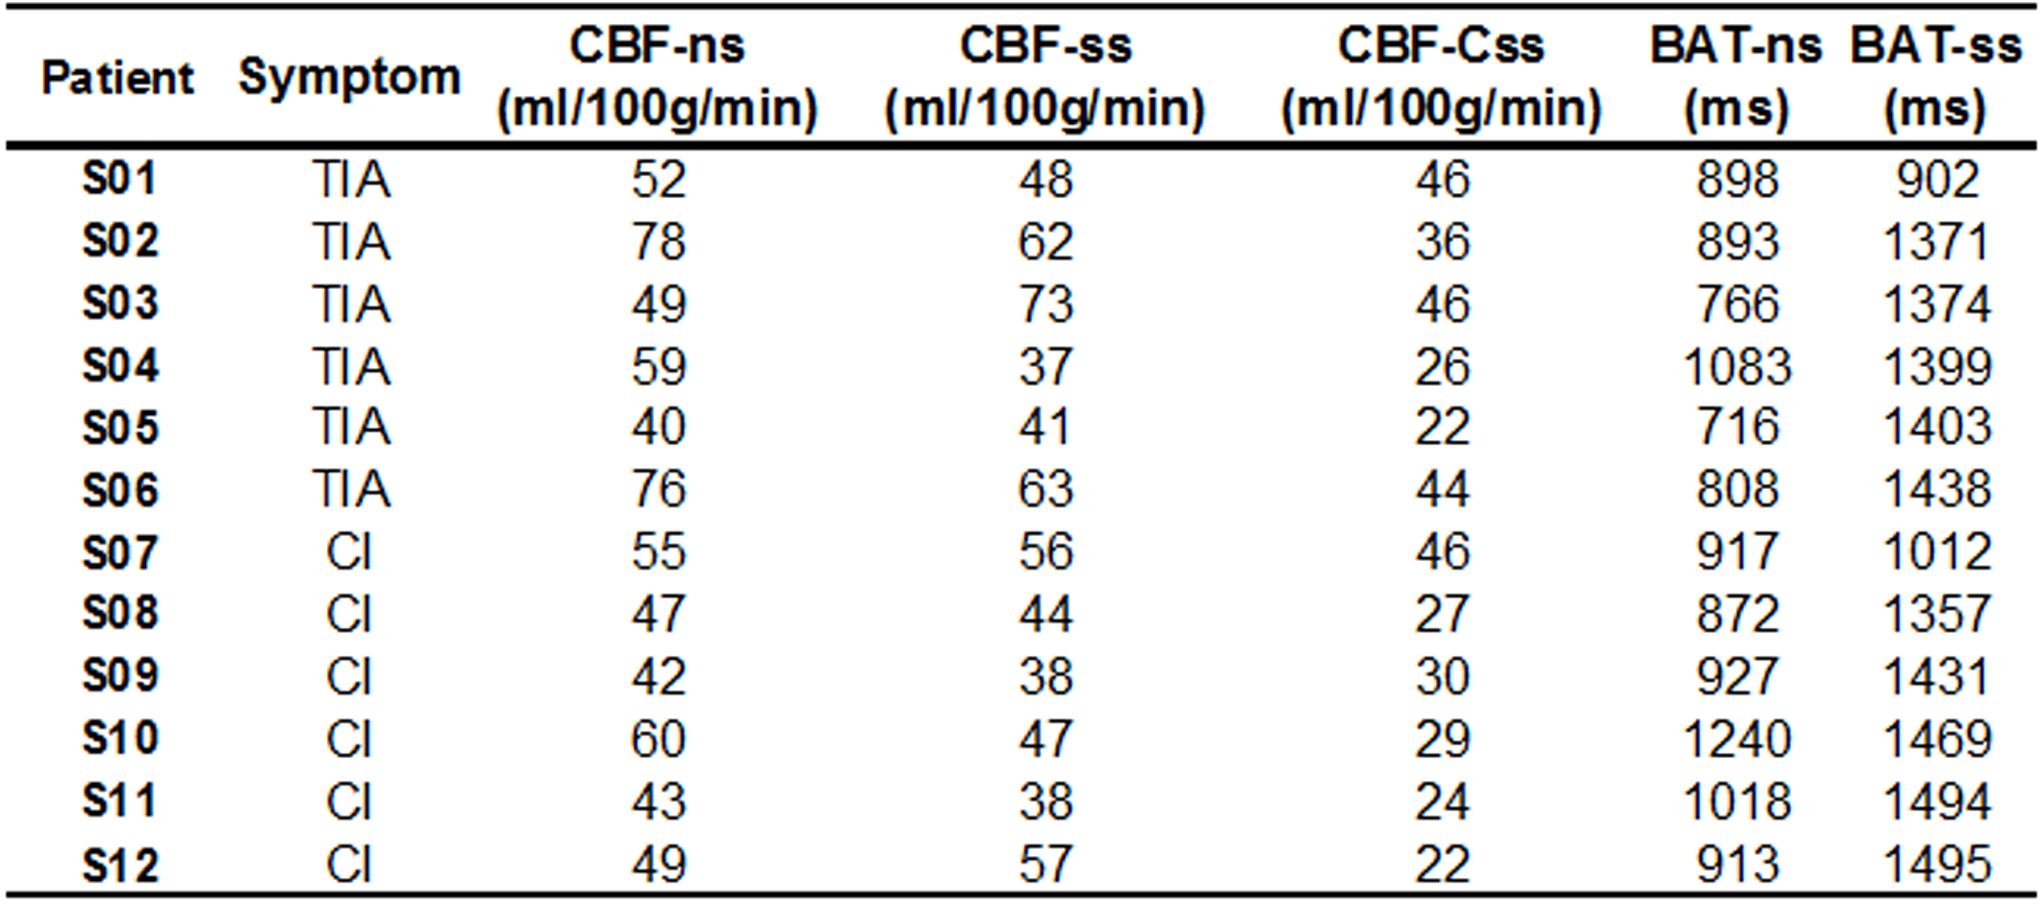
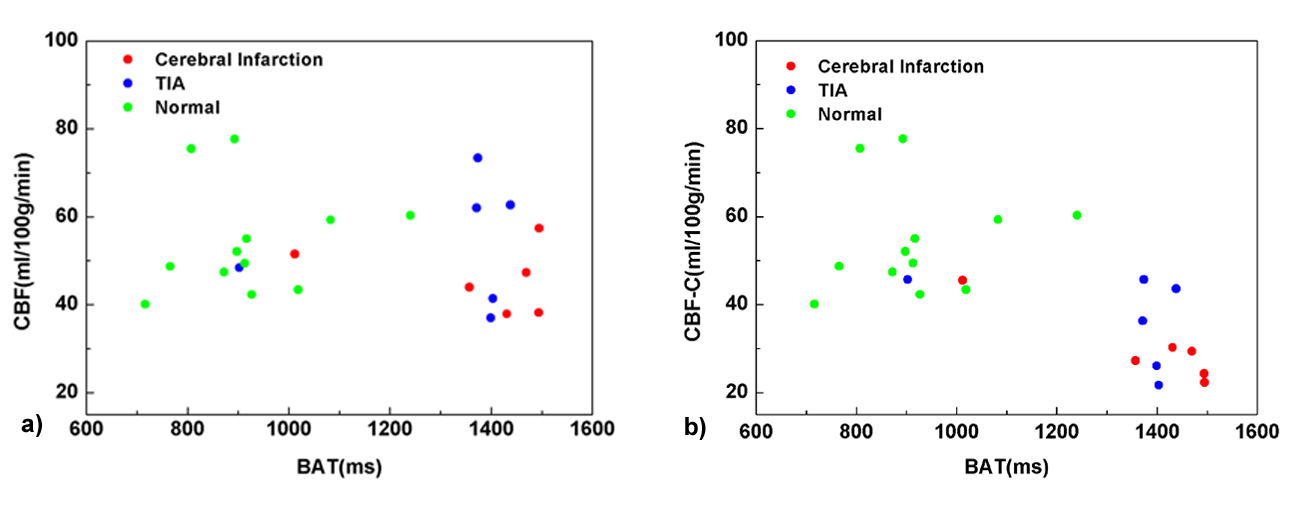
The mean values of CBF-ns, CBF-ss, CBF-Css, BAT-ns and BAT-ss within the MCA territory are listed in Table1. The BAT values on the stenosis side were longer than that on the normal side for all cases. There was no significant differencein the CBF value between the normal and stenosis sides (p=0.260). The corrected CBF values were all smaller than the uncorrected CBF values obtained by pixel-wise curve fitting. CBF-C on the stenosis side was significantly smaller than on the normal side (p<0.001). On Fig.1a (subject S12), we can see a clear hyper-perfusion on the CBF map obtained by pixel-wise curve fitting method and a long BAT on the stenosis side. However, the curve of perfusion weight didnot show hyper-perfusion but a long BAT and lower CBF. CBF-Csswas smaller than CBF-ns in subject S12 as well. The Fig.2b (subject S07) shows a case where BAT-sswas much shorter than for S12. CBF-ss and CBF-Csswere all lower than CBF-ns. There was no big difference (6 ml/100g/min) among the CBF obtained by the two methods. The accuracy ratesfor distinguishing TIA and infarction using CBF,CBF+BAT, and CBF-C+BAT were 58.3%, 66.7%, and 75.0% respectively.Discussion
The mTI-PASL sequence with Buxton model could measure CBFmore accurately, however in areas where BAT is longer than 1300ms, the estimation of CBF may not be as accurate asin areas with normal BAT. An ROI (include abnormal BAT areas) based analysis might have better performances. On the other hand the CBF error map could also be a useful tool to double-check if the CBF estimation is accurate or not.We observed that both TIA and CI patients had lower CBF than normal, and the BAT of CI patients was longer than for TIA patients, whichindicates that BAT is an important marker of ischemia. Using both CBF and BAT, the progression of ischemic stroke might be predictable. This hypothesis shall be validated in a larger cohort.Acknowledgements
No acknowledgement found.References
1.Yang S, Zhao B, Wang G, et al. Improving the Grading Accuracy of Astrocytic Neoplasms Noninvasively by Combining Timing Information with Cerebral Blood Flow: A Multi-TI Arterial Spin-Labeling MR Imaging Study[J]. American Journal of Neuroradiology, 2016.
2.Buxton R B, Frank L R, Wong E C, et al. A general kinetic model for quantitative perfusion imaging with arterial spin labeling[J]. Magnetic resonance in medicine, 1998, 40(3): 383-396.
3.Jinhao Lyu, Ning Ma, David S. Liebeskind, et al. Arterial spin labeling MagneticResonance Imaging estimation of antegrade and collateral flow in unilateral middle cerebral artery stenosis.Stroke. 2016; 47(2):428-33.
4.Qu H1, Li J, Zhao X, Dong K.Factors affecting pre- and post-stenting computed tomography perfusion in patients with middle cerebral artery stenosis.ExpTher Med. 2013; 5(2):471-474.
Figures