4615
The potential of MRI as a biomarker in elderly patients with asymptomatic unilateral internal carotid artery stenosis1Department of Physics, FFCLRP, University of Sao Paulo, Ribeirao Preto, Brazil, Ribeirão Preto, Brazil, 2Department of Neurosciences and Behavioral Science, FMRP, University of Sao Paulo, Ribeirao Preto, Brazil, Brazil
Synopsis
Asymptomatic unilateral internal carotid stenosis is associated with brain hemodynamic changes and cognitive impairment. However, the effects on Gray Matter (GM) volume, Cerebral Blood Flow (CBF) and Functional Connectivity (FC) are not clear. Therefore, the present study aims to assess changes in brain volume, CBF, resting-state FC and their relation to cognitive decline in a group of patients at presymptomatic stage using MRI. This study confirmed abnormalities in GM volume, CBF, RSBNs and RS-FC in patients, showing that MRI have great potential as biomarker of the disease and may provide additional information to predict cases at risk of brain ischemia.
Purpose
Carotid stenosis (CS) has been considered one of the
major causes of ischemic stroke. While symptomatic cases require fast
revascularization, there is no consensus about the management of
asymptomatic cases. Then, it is necessary to find predictors of stroke
risk in asymptomatic patients1. Due to its non-invasiveness and good
level of reliability, Magnetic Resonance Imaging (MRI) techniques are
the most suitable tools for this purpose2. Asymptomatic unilateral
internal CS has been associated with brain hemodynamic changes
and cognitive impairment3. However, the effects on Gray Matter (GM)
volume, Cerebral Blood Flow (CBF) and Functional Connectivity (FC) are
not totally clear. Therefore, the present study aims to assess changes
in brain volume, CBF, resting-state FC and their relation to cognitive
decline in a group of patients at presymptomatic stage using MRI to
provide information that may help predicting cases at risk of brain
ischemia.Materials and Methods
Thirteen elderly patients (72.38±9.26 years, 8 women) with asymptomatic CS, and ten healthy elderly (59.78±8.73 years, 5 women) volunteers participated in this study, after reading and signing an informed consent approved by the Ethics in Research Committee of the Clinical Hospital of Ribeirao Preto.
Experiments were performed on a 3T Philips System, using 32-channel head coil for reception. For anatomic reference and volumetry analysis, images were acquired using a 3D T1-weighted GE sequence (TR/TE=7/3.1 ms, FA=8°, FOV=240x240 mm2, 160 1-mm slices). BOLD-fMRI images were acquired at resting state using a 2D EPI sequence (TR/TE=2000/30 ms, FA=90°, 31 4-mm slices, gap=0.5 mm, 320 repetitions). Pseudo-continuous Arterial Spin Labeling (pCASL) images were acquired at resting state using a 2D EPI single-shot sequence (TR/TE=4000/14 ms, FA=90°, FOV=240x240 mm2, matrix=160x160, 20 5-mm slices, label duration=1650 ms, post-labeling delay=1525 ms).
GM volume was assessed using VBM (Voxel Based Morphometry)4. For pCASL and BOLD images, SPM12 and routines made in Matlab were used. Preprocessing included slice-time correction, motion correction, spatial smoothing, coregistration to anatomical images and normalization to a standard space. Carotid stenotic side was set to the left. Resting-state Brain Networks (RSBNs) were assessed using Independent Component Analysis (ICA), and FC was studied by Pearson correlation and graph analysis using CONN. CBF quantification was performed using perfusion-weighted images (control–label) and a model previously described5.
All subjects underwent a standardized clinical and neuropsychological evaluation, including the Mini-Mental State Examination (MMSE). Correlations between MMSE scores and GM volume, CBF and FC were performed using the r-Pearson correlation coefficient.
Results
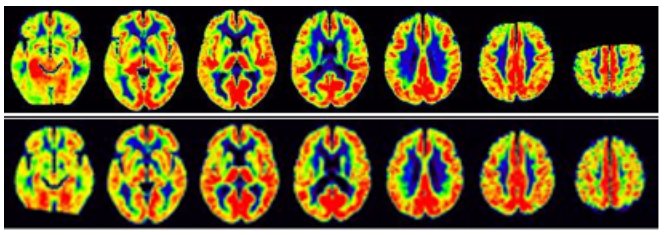
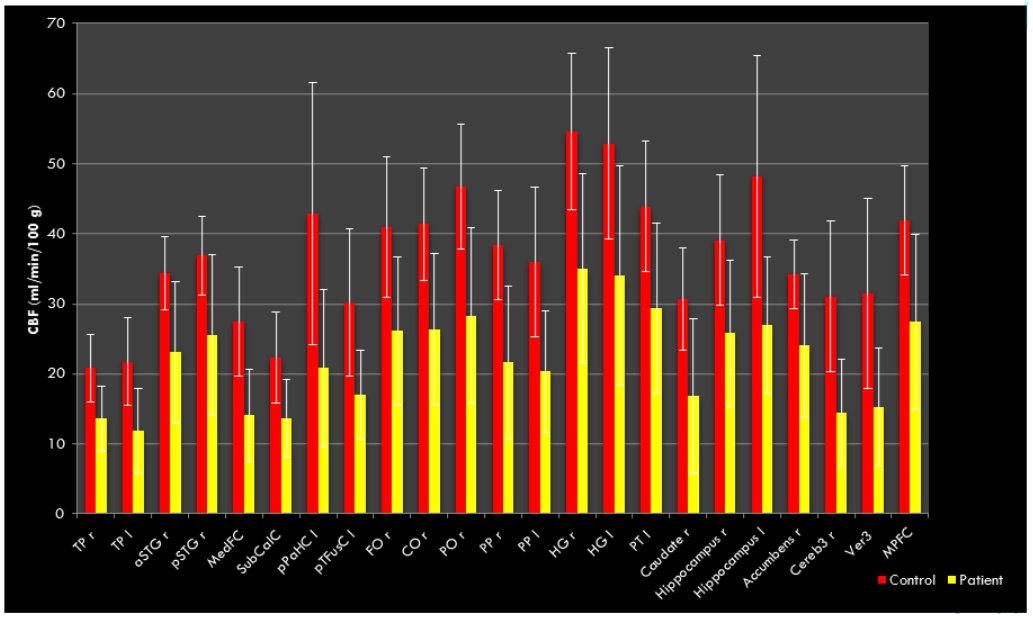
GM volume in patients showed significant reduction when compared to controls (p=0.009). Whole-brain analysis indicated CBF reduction in both left and right temporal GM lobes, and Internal Structure GM in patients comparing to controls (p<0.05, Figure 1). A voxelwise analysis indicated frontal and temporal lobes with significant CBF reduction (p-FDR<0.05) in patients, while a clusterwise analysis indicated 23 regions with decreased CBF (p<0.01, Figure 2).
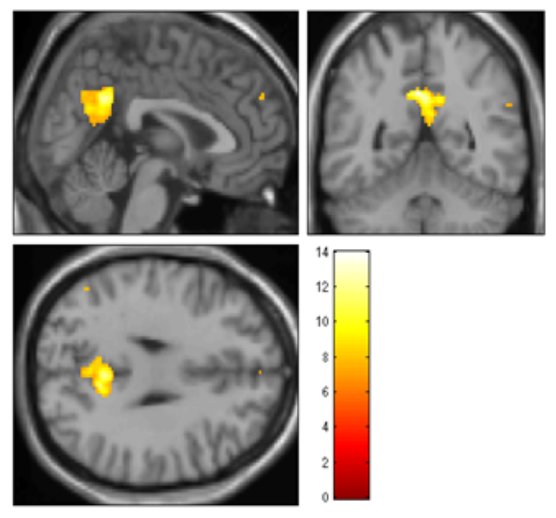
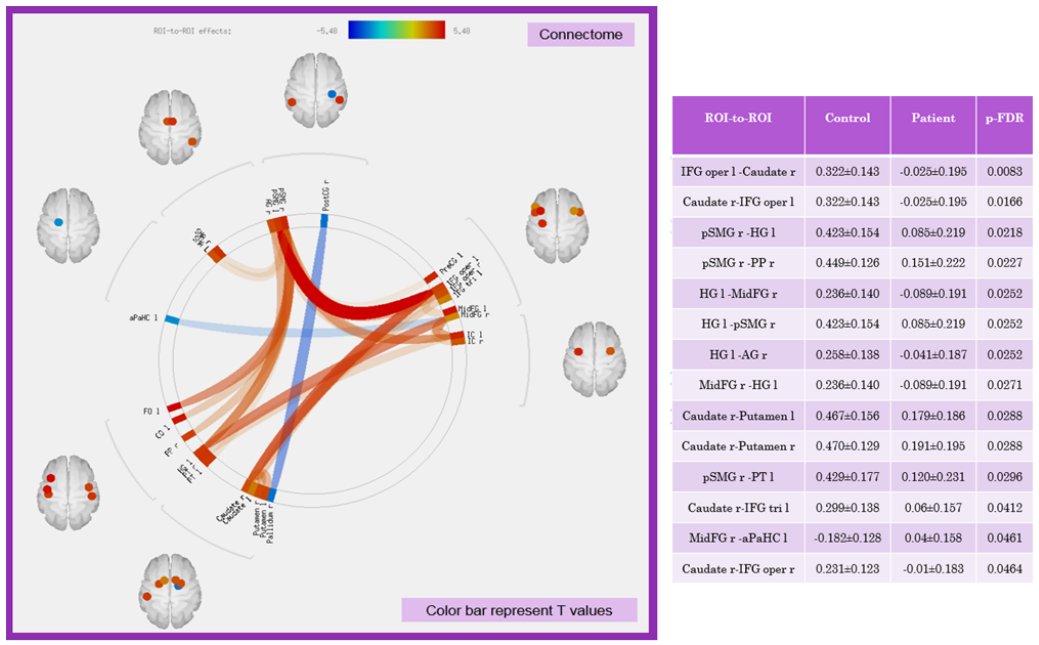
Ten RSBNs were observed: dorsal attention, salience, frontoparietal right, frontoparietal left, visual occipital, visual medial, default mode (DMN), sensor motor, auditory network, and precuneus. Patients showed disruption of the first eight RSBNs. Figure 3 shows areas of the DMN that are different between groups. Moreover, patients showed significantly weaker network connections in 13 ROI-to-ROI, involving 26 ROIs (Figure 4). Graph analysis showed “local efficiency” and “clustering coefficient” impairment in the hemisphere ipsilateral to the stenosis (p-FDR<0.05), more specifically in the Planum Temporale and Precentral Gyrus.
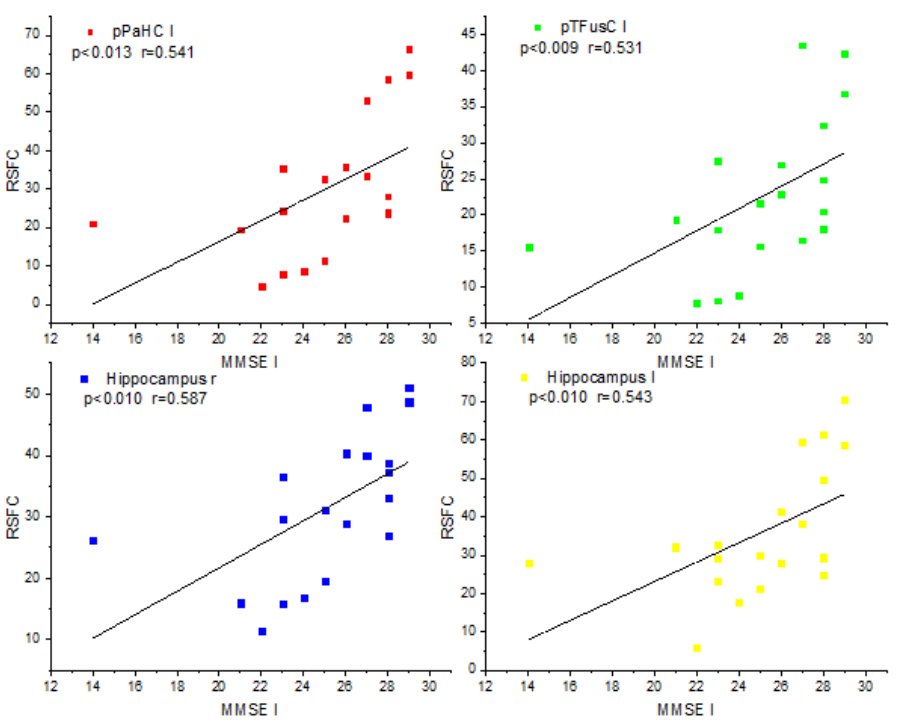
In addition, there was no significant difference in mean MMSE I between controls (26.4±4.7) and patients (24.69±2.01). However, significant correlation between CBF values and MMSE I was observed in bilateral Hippocampus, left posterior Parahippocampal Cortex, and left posterior Temporal Fusiform Cortex (Figure 5).
Discussion
When comparing the results using different MRI modalities, a common information is the presence of abnormalities in the Temporal Gray Matter, more specifically in Planum Temporale, in the hemisphere ipsilateral to the CS. GM volume, CBF and RS-FC are decreased in this region in patients. RSBNs analysis showed abnormalities mainly in the DMN, which is highly correlated to brain disorders6.In general, even at presymptomatic stage, compromised abnormalities in brain are probably due to the presence of unilateral CS7, which causes impairment in cerebral hemodynamics and, likely, disruption of ipsilateral hemisphere connectivity8. Different MRI modalities are able to identify these abnormalities and have a great potential as a biomarker in elderly patients with asymptomatic unilateral internal carotid artery stenosis.
Conclusion
The present study confirmed abnormalities in GM volume, CBF, RSBNs and RS-FC in patients with asymptomatic unilateral CS, showing that MRI may provide additional information to predict cases at risk of brain ischemia.Acknowledgements
Coordenação de Aperfeiçoamento de Pessoal de Nível Superior, CAPES, Brasil.References
1. Prabhakaran S. Imaging markers of stroke risk in asymptomatic carotid stenosis. Brain Circ 2015;1:38-46.
2. Araujo, D.B., 2002. Sobre neuroimagens funcionais por magnetoencefalografia e ressonância magnética: novos métodos e aplicações., Departamento de Física, FFCLRP. Universidade de São Paulo, Ribeirão Preto, São Paulo, Brasil.
3. Lin C.J., et al. Connectivity features for identifying cognitive impairment in presymptomatic carotid stenosis. PLoS ONE 9(1):e85441, 2014.
4. J. Ashburner, K.J. Friston. Voxel-based morphometry — the methods. NeuroImage, 11 (2000), pp. 805–821.
5. Chen, Y., Wang, D., Detre, J.. Test–Retest Reliability of Arterial Spin Labeling With Common Labeling Strategies. J Magn RES IMAGING 33:940–949 (2011)
6. van den Heuvel M.P., Hulshoff Pol H.E.. Eur Neuripsychopgarmacol. 2010; 20(8): 519-34.
7. Cheng, H.L., et al. Impairments in cognitive function and brain connectivity in severe asymptomatic carotid stenosis. Stroke 43:2567-2573, 2012. Ting-Yu, C., et al.
8. Graph theoretical analysis of functional networks and its relationship to cognitive decline in patients with carotid stenosis. J Cereb Blood Flow Metab Oct. 1, 2015.
Figures