4613
Quantitative Brain Oxygenation Measurements Made using Streamlined-qBOLD in Acute Stroke Patients: Further Investigation using a Detailed Voxel-Wise Analysis of Tissue Outcome1FMRIB, Nuffield Department of Clinical Neurosciences, University of Oxford, Oxford, United Kingdom, 2Acute Vascular Imaging Centre and Acute Stroke Programme, Radcliffe Department of Medicine, University of Oxford, Oxford, United Kingdom
Synopsis
Streamlined-qBOLD is a baseline brain oxygenation measurement technique that has qualitatively shown promising results for the early identification of the ischaemic penumbra. Here regional definitions of tissue outcome are used to further investigate the application of this technique in acute stroke. Quantitative brain oxygenation parameters are demonstrated to vary between regions with different tissue outcomes.
Introduction
Recently, streamlined-qBOLD was used to serially map brain oxygenation in acute stroke patients and qualitatively demonstrate its potential to refine the early identification of tissue at risk of infarction1. In this study detailed voxel-wise analysis is used to quantify the metabolic profile of ischaemic tissue on presentation and investigate these metrics in relation to tissue outcome.Background
It has previously been proposed that oxygen metabolism imaging would allow for the early identification of tissue at risk of infarction2. Streamlined-qBOLD provides an approach to mapping brain oxygenation with good brain coverage in a clinically feasible acquisition and without need for exogenous contrast3. Here we propose to quantify the presenting brain oxygenation parameter maps in both the ischemic core and regions of infarct growth4 in order to further explore the use of quantitative brain oxygenation mapping in acute stroke.Methods
Patients with acute ischaemic stroke were recruited and scanned at 3T under a UK National Research Ethics Service Committee approved protocol, which included MRI scanning at presentation and follow up (between 24 hours and 1 week). Nine patients were scanned on presentation, but only five subjects had suitable data for defining regions of interest. Imaging sequences included streamlined-qBOLD (FOV=220mm2, 96x96 matrix, nine 5mm slabs, 1mm gap, TR/TE=3s/74ms, BW=2004Hz/px, TIFLAIR=1210ms, ASE-sampling scheme τstart:Δτ:τfinish=-16:8:64ms, scan duration 4.5mins), alongside T1-, T2-FLAIR and diffusion (DWI) weighted imaging with apparent diffusion coefficient (ADC) calculation. R2′ was calculated using a log-linear fit to the mono-exponential regime (τ >15ms)5 of the ASE data. The intercept of this fit and the log of the spin-echo signal (τ=0ms) were subtracted to measure deoxygenated blood volume (DBV). Deoxyhaemoglobin concentration ([dHb]) was then calculated using,
$$[dHb]=\frac{3.R_2^\prime}{DBV.4.\gamma.\pi.\Delta\chi_0.\kappa.B_0}$$
where parameters are known or assumed constants (Δ𝝌0=0.264x10⁻⁶, κ=0.03)3. For each subject, binary masks of the presenting ADC lesion were automatically generated using a threshold defined (620x10-6 mm2/s)6 cluster-based analysis approach4. Final infarct was manually delineated preferentially on the 1-week T2-FLAIR image, or, if unavailable, the 24-hour DWI b=1,000 s/mm2 image. Healthy control tissue was defined using a contralateral region by registering the presenting and final lesions to standard space and mirroring to the unaffected side. All regional definitions were registered back to the native space of the brain oxygenation parameter maps. Infarct core was defined as tissue present in both the presenting ADC lesion and the final infarct. Infarct growth was defined as tissue present in the final infarct but not in the presenting ADC lesion. The contralateral region was defined as tissue present in either the presenting or final mirrored lesions.
Results
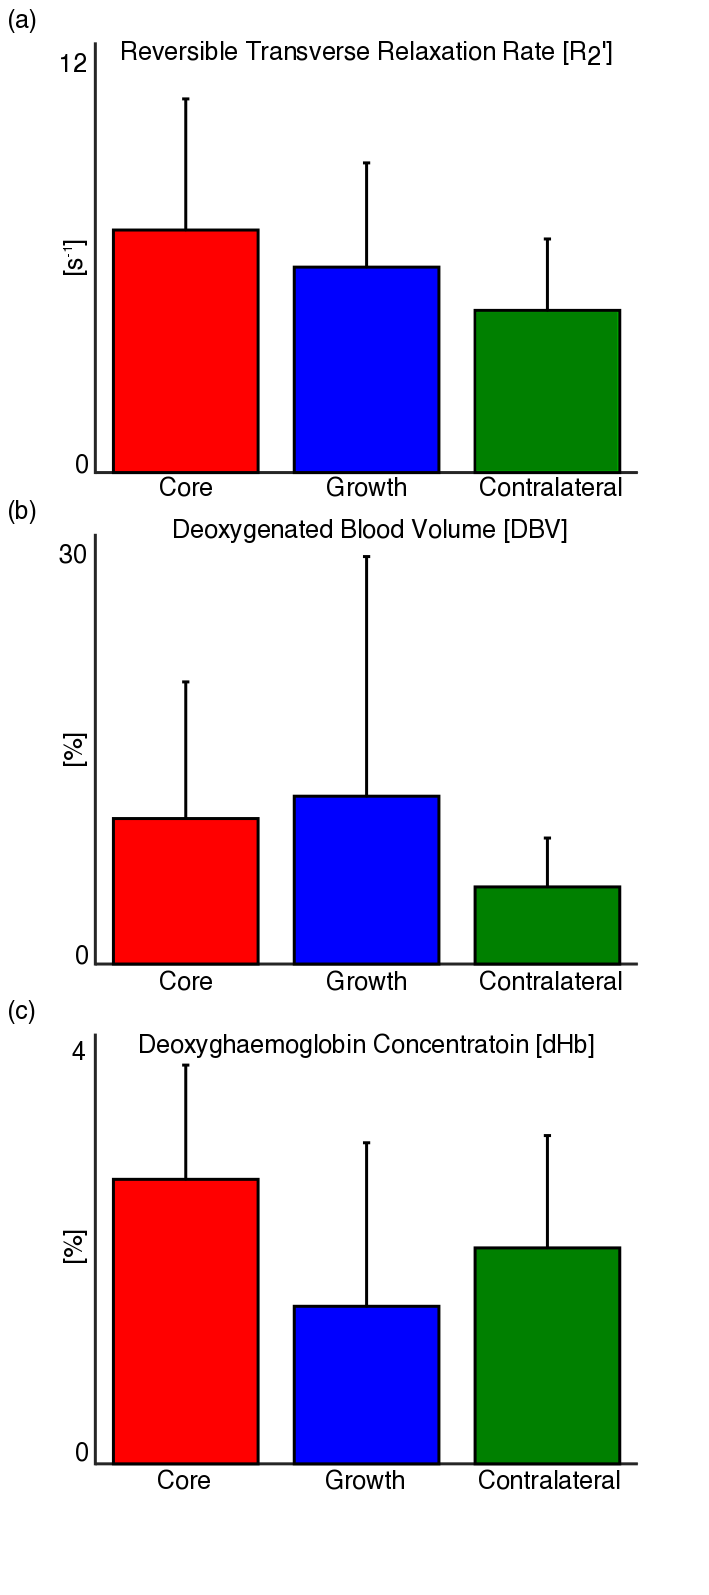
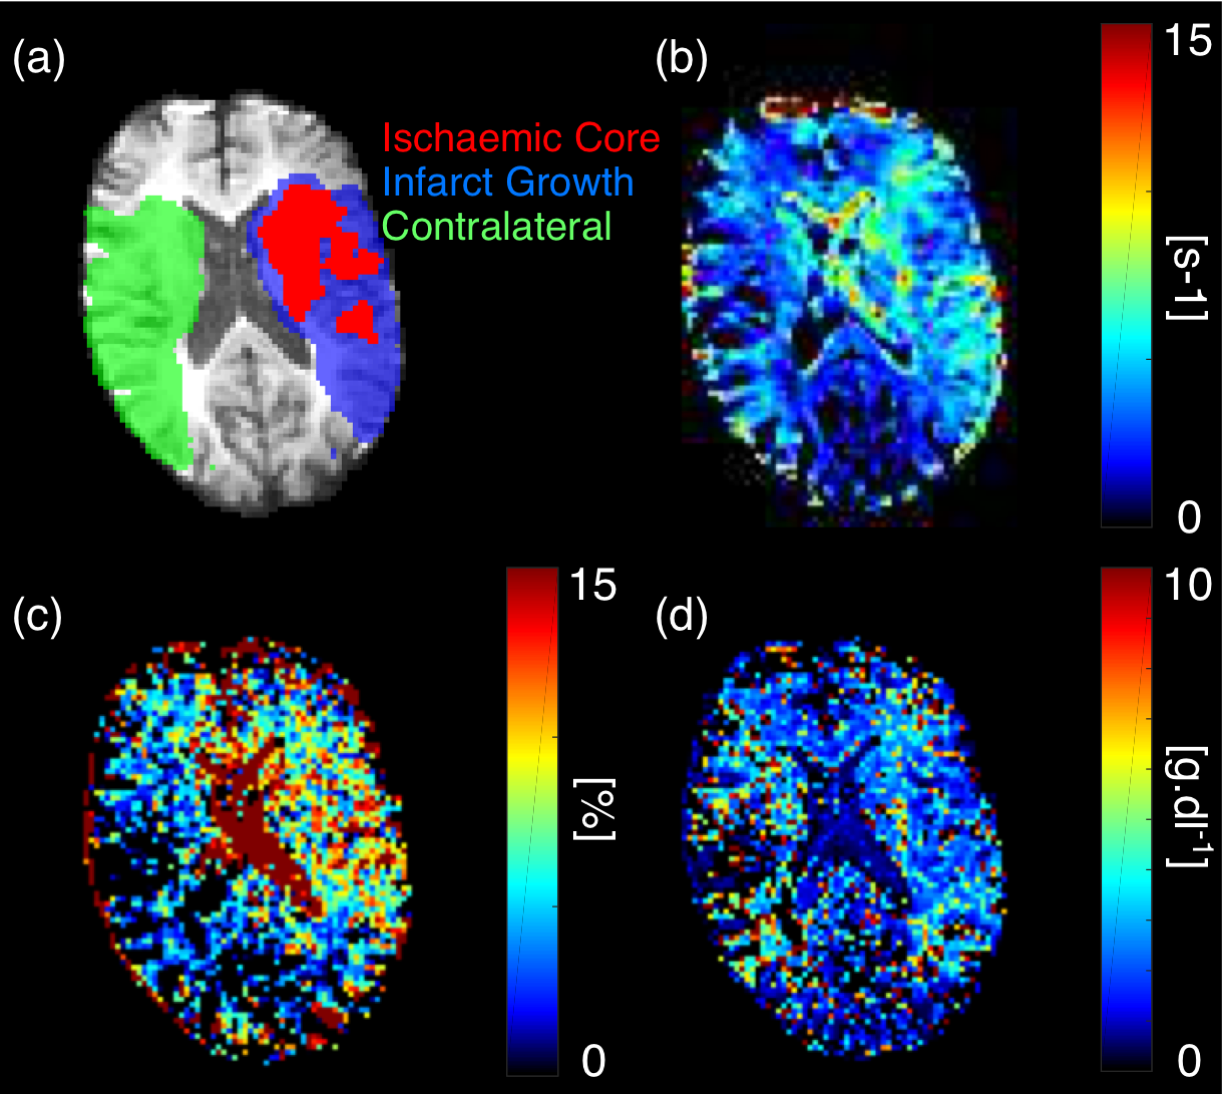
Using the regional definitions of core, growth and contralateral, median values for R2′, DBV and [dHb] were extracted from the streamlined-qBOLD parameter maps. Figure 1 shows group average (± standard deviation) measures for each parameter for all tissue outcomes. Figure 2 shows parameter maps with regional tissue outcomes for an example subject.Discussion
From Figure 1, group average values of R2′, DBV and [dHb] differed across the regional tissue outcomes. In the ischaemic regions there was a trend towards increased R2′ and DBV. This suggests an increase in the relative amount of deoxyhaemoglobin in these regions. There was a marked heterogeneity across the group meaning these trends didn’t reach significance. However, individual cases demonstrate convincing patterns as shown in Figure 2. Infarct growth defines tissue that is metabolically active on presentation but goes on to infarct at a future time. It is difficult to hypothesise the expected metabolic state of this tissue on presentation but it is likely to be heterogenous across the group with each undergoing a different pathway to infarction7. This is supported by the high variation across subjects measured in the infarct growth region, particularly for DBV and [dHb]. [dHb] demonstrates contrast between infarct core and infarct growth. qBOLD is inherently sensitive to the relative amount of deoxyhaemoglobin present in intravascular blood (Equation 1) and traditionally relates this to measurements of oxygen metabolism such as oxygen extraction fraction (OEF). However, as ischaemic core describes metabolically inactive tissue at presentation the presence of elevated deoxyhaemoglobin levels does not represent ongoing metabolism. Hence, [dHb] is a more useful quantity to present. In the absence of blood flow information, it is difficult to establish a relationship between [dHb] and ongoing metabolism. Concurrent cerebral blood flow measurements are needed to further investigate this.Conclusion
Quantitative voxel-wise analysis demonstrates that resting brain oxygenation characteristics made using streamlined-qBOLD vary between regions with different tissue outcomes. However, to interpret the metabolic state of the ischaemic tissues at presentation additional blood flow information is required.Acknowledgements
This study was funded by the Engineering and Physical Sciences Research Council under grant number EP/K025716/1, the National Institute for Health Research Oxford Biomedical Research Centre Programme, the National Institute for Health Research Clinical Research Network, the Dunhill Medical Trust [grant number: OSRP1/1006] and the Centre of Excellence for Personalized Healthcare funded by the Wellcome Trust and Engineering and Physical Sciences Research Council under grant number WT088877/Z/09/Z.References
1. Stone AJ, Harston GWJ, Carone D, Ngwako M, Licenik R, Kennedy J, Blockley NP. Serial quantification of Brain Oxygenation using Streamlined-qBOLD in Acute Stroke Patients. Proc. Intl. Soc. Mag. Reson. Med 24 2016:600
2. Astrup J, Siesjö BK, Symon L. Thresholds in cerebral ischemia - the ischemic penumbra. Stroke 1981;12:723–725.
3. Stone AJ, Blockley NP. A streamlined approach to mapping the oxygen extraction fraction (OEF) and deoxygenated blood volume (DBV) using the quantitative BOLD technique. Proc. Intl. Soc. Mag. Reson. Med. 23 2015:0219
4. Harston, G. W. J., Tee, Y. K., Blockley, N., Okell, T. W., Thandeswaran, S., Shaya, G., et al. (2015). Identifying the ischaemic penumbra using pH-weighted magnetic resonance imaging. Brain, 138(Pt 1), 36–42. http://doi.org/10.1093/brain/awu374
5. Yablonskiy DA, Haacke EM. Theory of NMR signal behavior in magnetically inhomogeneous tissues: the static dephasing regime. Magn. Reson. Med. 1994;32:749–763.
6. Purushotham A, Campbell BCV, Straka M, Mlynash M, Olivot J-M, Bammer R, Kemp SM, Albers GW, Lansberg MG. Apparent diffusion coefficient threshold for delineation of ischemic core. Int J Stroke 2013;10:348–353. doi: 10.1111/ijs.12068.
7. del Zoppo, G. J., Sharp, F. R., Heiss, W.-D., & Albers, G. W. (2011). Heterogeneity in the penumbra. Journal of Cerebral Blood Flow & Metabolism, 31(9), 1836–1851. http://doi.org/10.1038/jcbfm.2011.93
Figures