4612
Preliminary Study of High b-value Diffusion MRI for Characterizing White Matter Damage in A Mouse Model of Amyotrophic Lateral Sclerosis1Bioengineering, University of Illinois at Chicago, Chicago, IL, United States, 2Anatomy and Cell Biology, University of Illinois at Chicago, Chicago, IL, United States, 3Radiology, Northwestern University, Chicago, IL, United States, 4Research Resource Center, University of Illinois at Chicago, Chicago, IL, United States
Synopsis
Amyotrophic lateral sclerosis (ALS), a progressive motor neuron disease, is characterized by severe cervical spinal cord damage caused by degeneration of the corticospinal tracts and loss of lower motor neurons. Although MR imaging of spinal cord is challenging, the ubiquity and non-invasive nature of MRI has supported its continued development and a leading role in ALS biomarker discovery. In this study, we investigated the feasibility of exploiting high b-value diffusion MRI to evaluate alterations of the spinal cord in a mouse model of ALS.
PURPOSE
Amyotrophic lateral Sclerosis (ALS), characterized by progressive motor neuron degeneration, occurs when the myelin sheath becomes sufficiently damaged.1, 2 Myelin is a white fatty material, composed chiefly of lipids and lipoproteins. The diffusion behavior of lipid protons has been investigated by utilizing diffusion magnetic resonance spectroscopy to probe intramyocellular lipid droplet size in vivo,3,4 For ALS patient, the damaged nerves lose their coating myelin sheath, with these changes potentially reflected in altered diffusion properties. The objective of this preliminary study was to investigate the feasibility of using high b-value diffusion-weighted MRI to evaluate alterations of the spinal cord in a transgenic G93A-SOD1 mouse model of ALS.METHODS
All MRI studies were performed using a 9.4 T MRI scanner (Agilent, Santa Clara, CA). Two diseased mice (symptomatic G93A-SOD1) and two control wild type (WT) mice were euthanized (approved by the IACUC) before the MRI scans. For each measurement, one diseased mouse and one control were carefully aligned in order to show the two spinal cords in the same image. A diffusion weighted stimulated echo sequence was applied with following acquisition parameters: TR/TE = 2000/30.5 ms, mixing time = 382 ms, δ = 11 ms, Δ = 400 ms, slice thickness = 1.5 mm, field of view (FOV) = 36 mm × 50 mm, matrix = 64 × 96, average = 25, and 30 b-values ranging from 0 to 858,022 s/mm2 with a maximal diffusion gradient strength of 50 Gauss/cm. Two diffusion gradient directions were applied with one direction parallel and the other perpendicular to the long axis of the spinal cord. T2 weighted images were acquired using a fast spin echo sequence with parameters: TR/TE = 1000/12 ms, echo train length = 8, matrix = 192 × 256, FOV = 36 × 50 mm, slice thickness = 1.5 mm, averages = 2. Image post-processing was performed in Matlab (MathWorks). Signal-noise-ratios (SNRs) were calculated from regions of interest (ROIs) manually drawn from spinal cords of both diseased and control mice. A bi-exponential decay model5 fitting was applied to the ROIs and voxel-wisely. Axonal fiber morphology and integrity of the each spinal cord was validated by histological analysis.RESULTS
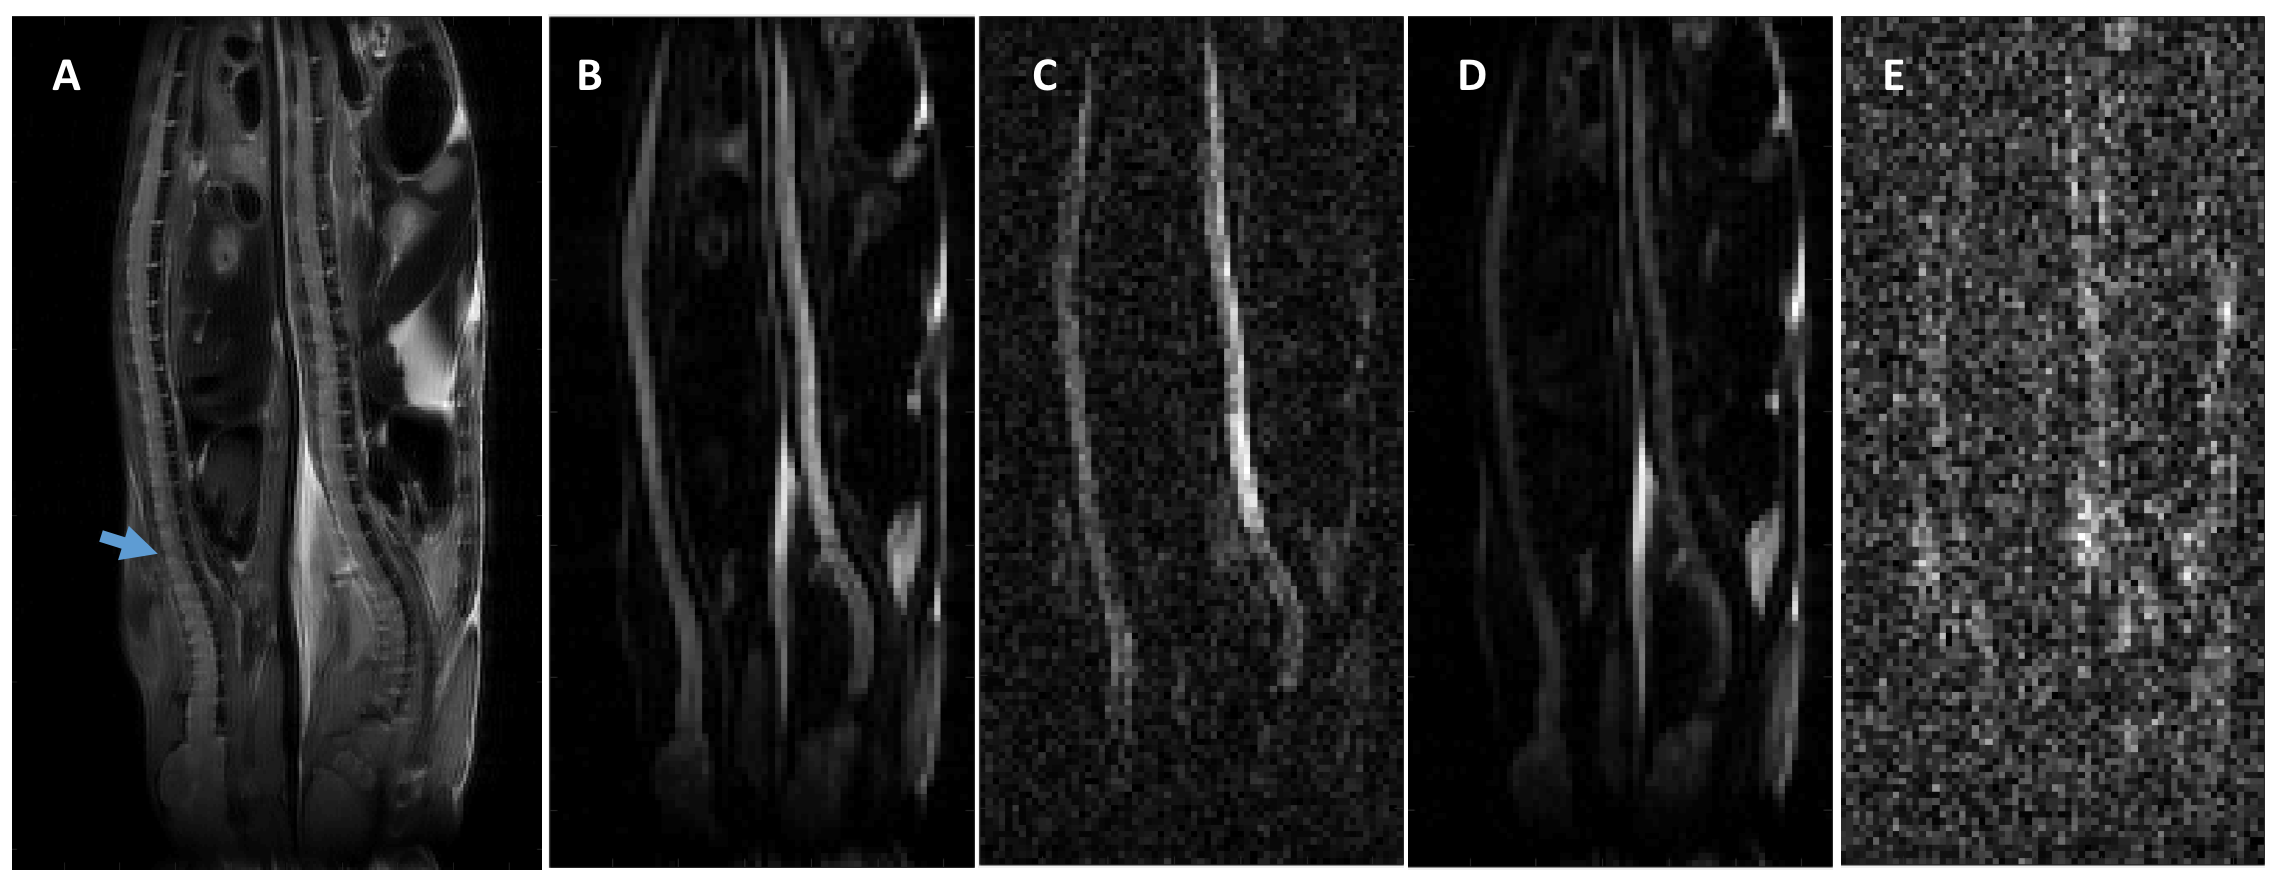
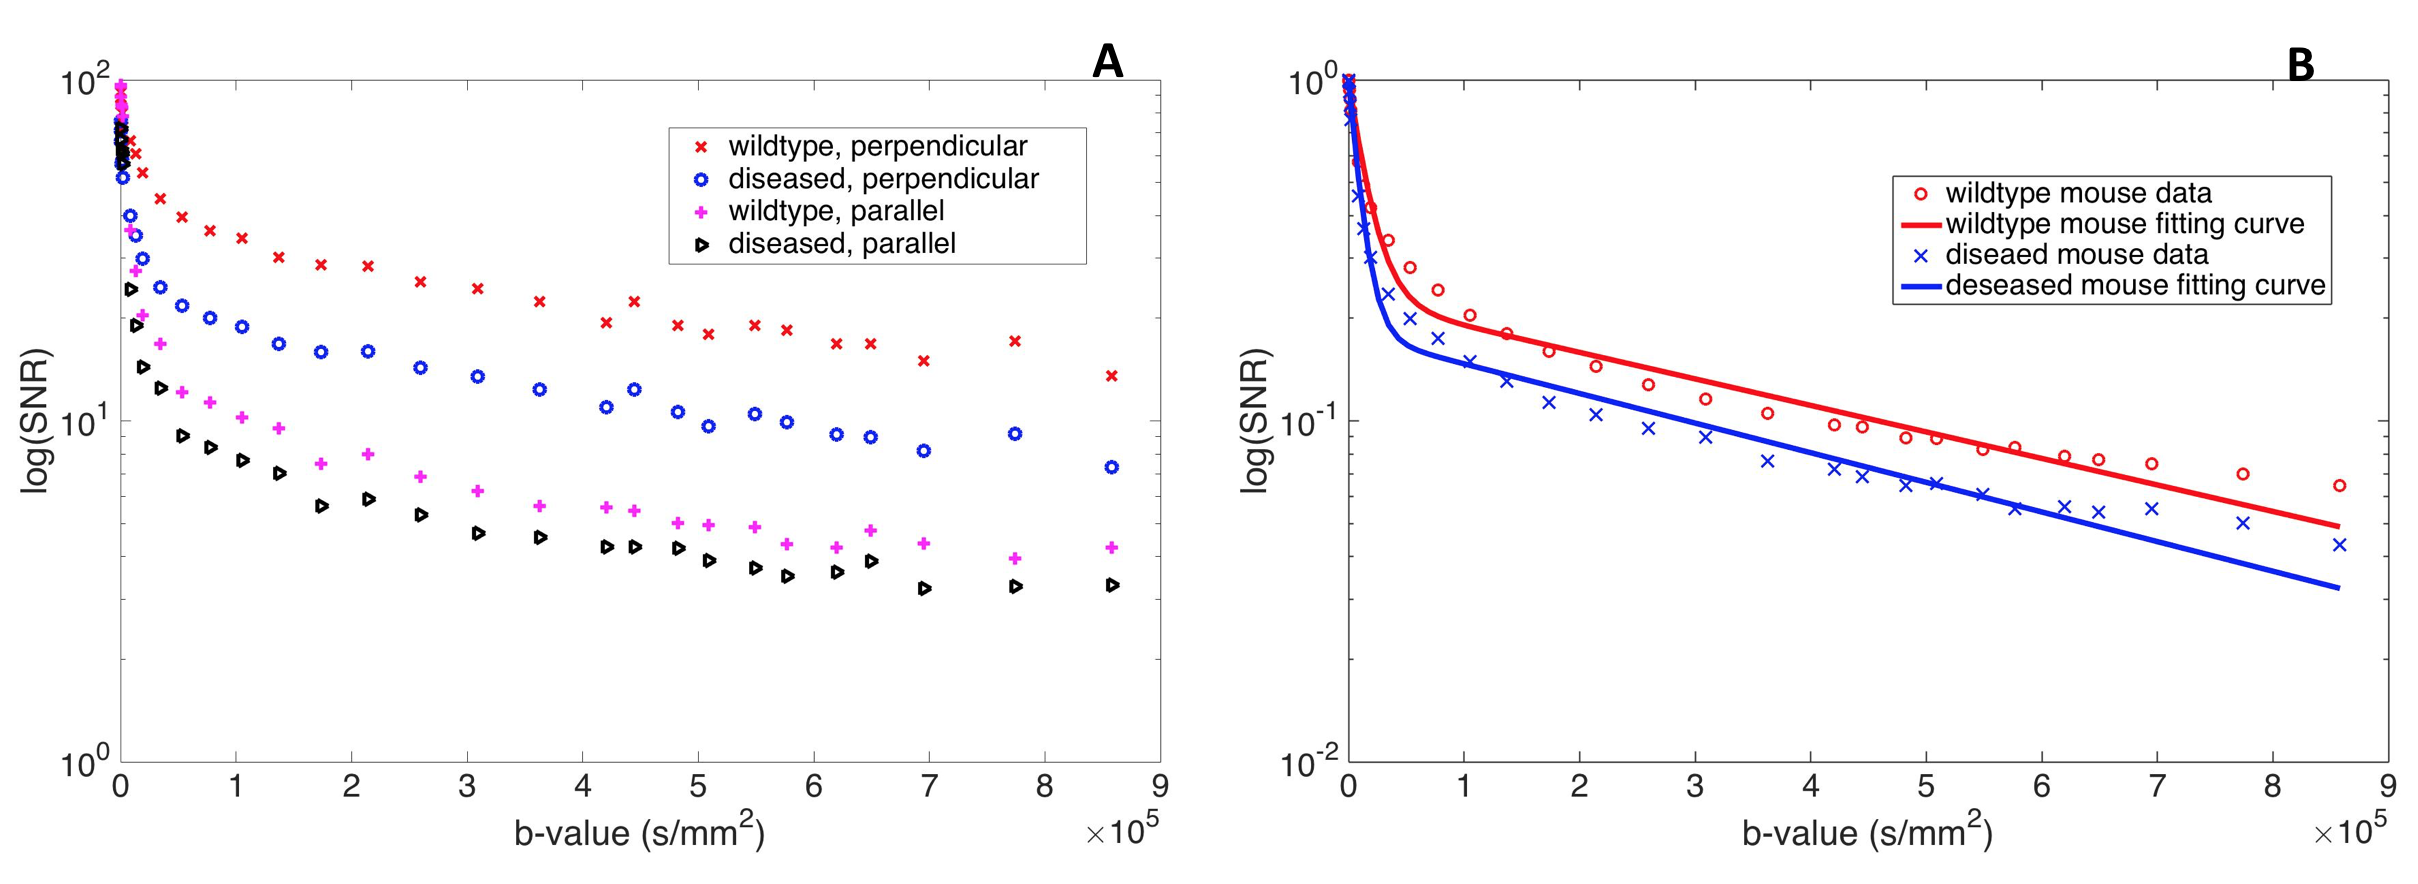
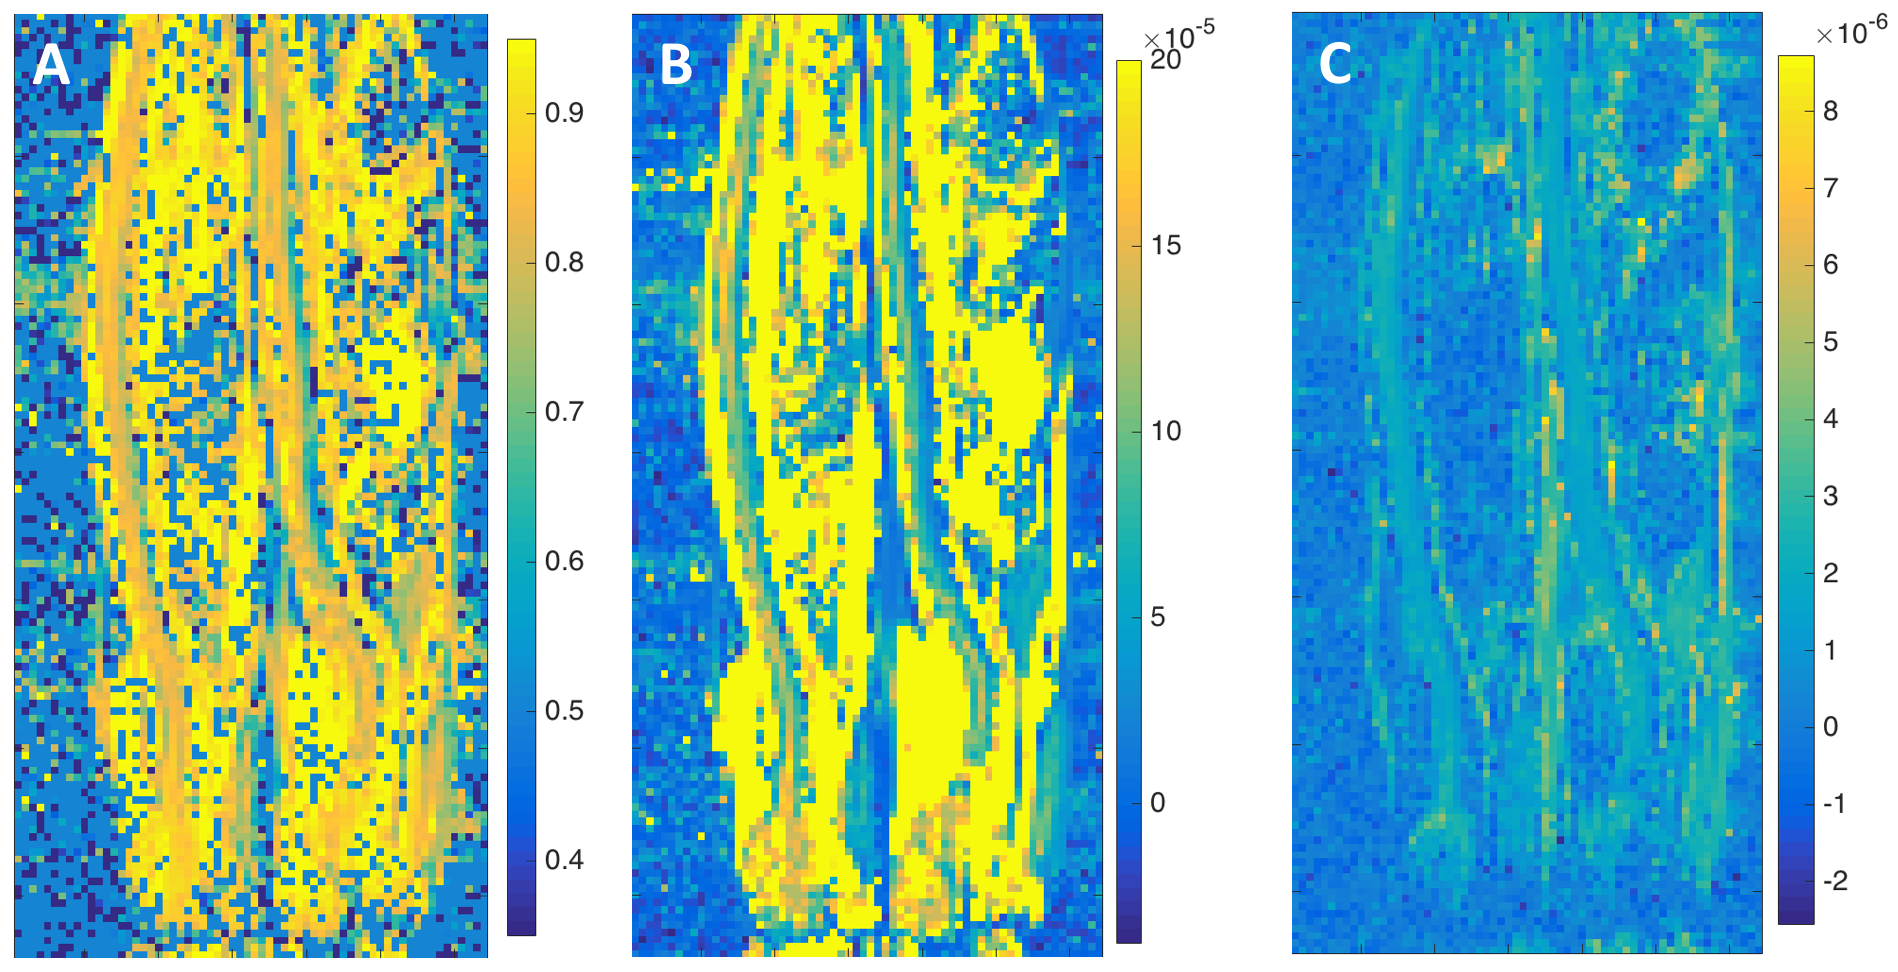
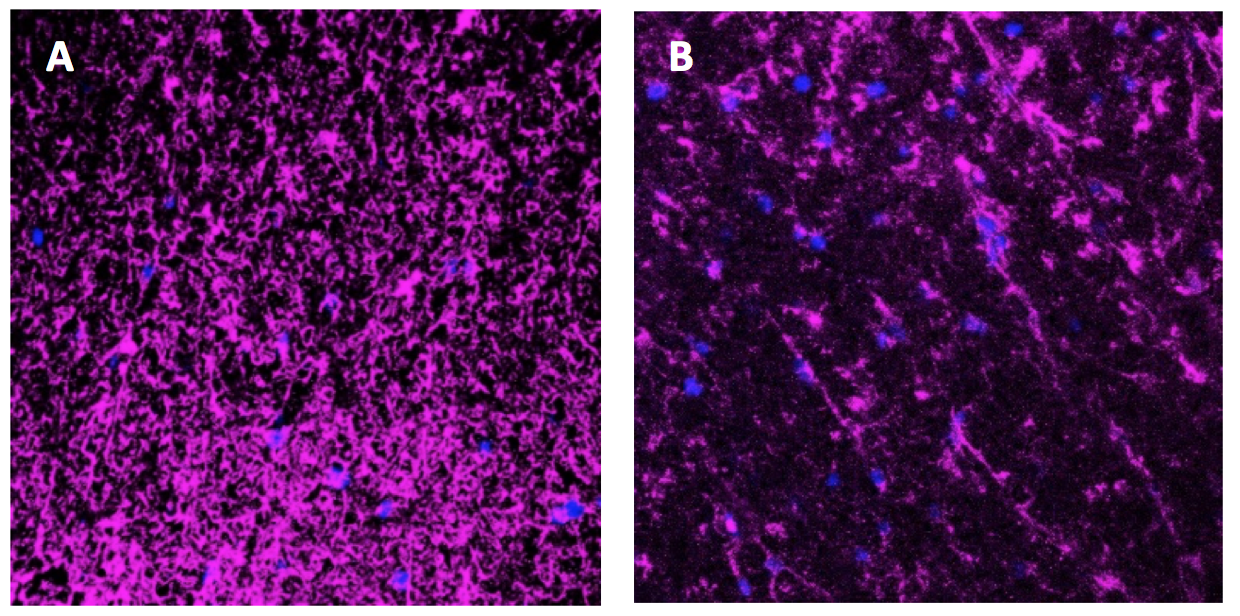
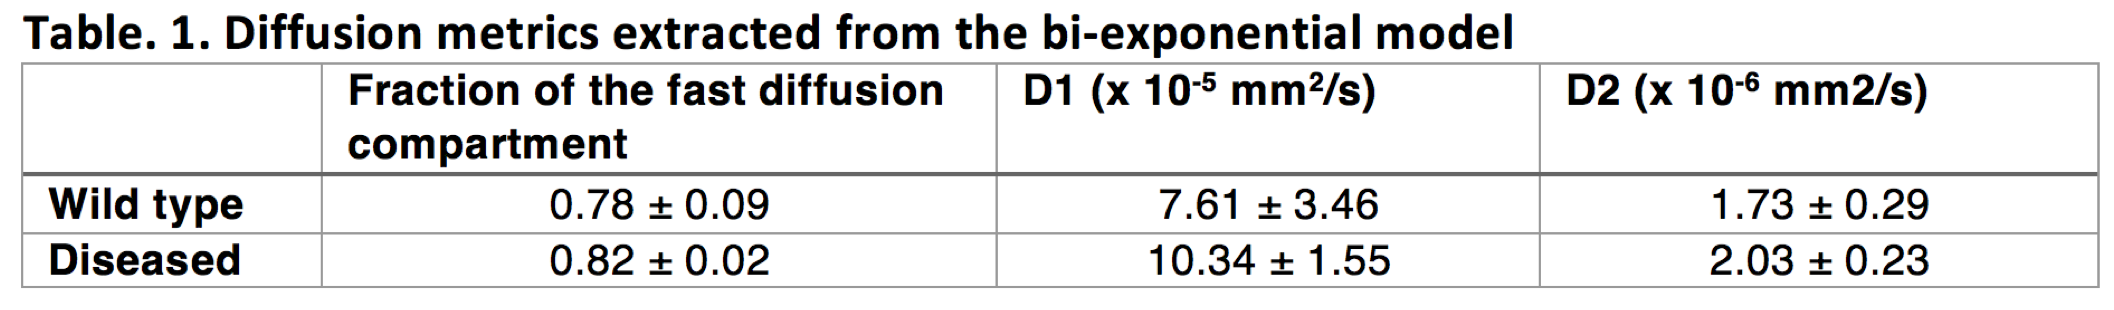
In T2-weighted images (Fig. 1A), similar image intensities were observed in spinal cord regions of the diseased (arrow pointed) and wild type animals. However, in the diffusion-weighted images (Fig. 1B, C, D, E), wild type animal showed relatively higher signals in the spinal cord as b-value increased. The measured SNRs from an ROI drawn at the lumbar level of the spinal cord were found to be much lower for the diseased mouse at all the b values, when compared to those of the controls (Fig.2A). In addition, the SNRs were much higher in both animals with the diffusion gradients applied perpendicular to long axis of the spinal cord, when compared to those with parallel diffusion-weighting direction (Fig. 2A). We further found a non-linear relationship existed between the log-scaled SNRs and b-values (Fig. 2). The bi-exponential model (Fig. 2B) showed a good fit to the SNRs measured at increasing b-values for the data with the diffusion-weighting direction perpendicular to the spinal cord. The extracted parameter maps indicated a possible higher fraction of the fast diffusion components (Fig. 3A) and higher fast diffusion coefficient (Fig. 3B) at the lumbar level of the diseased animals. The measured diffusion metrics from an ROI drawn at the lumbar levels of the mice are shown in Table 1. Fluorescence microscopy demonstrated a significant reduction in myelin density in G93A-SOD1 mice compared to wild type controls (Fig. 4).DISCUSSION
MRI techniques to assess progression of ALS can be beneficial in clinical settings as a marker for patient prognosis and in research settings as biological markers for assessing the efficacy of experimental treatments. In this study, we demonstrated that signal intensity differences existed in the high b-value diffusion-weighted images between the spinal cords of G93A-SOD1 mice and wild type controls. The diffusion-weighted signal decay showed a dependence on the diffusion weighting direction relative to spinal nerve fiber orientation. We further found, from the bi-exponential model analysis, that the fraction and diffusion coefficient of the fast diffusion compartment might be utilized to differentiate and quantify the progression of ALS in the G93A-SOD1 mouse model of ALS.CONCLUSION
In this preliminary study, we demonstrated the feasibility of using high b-value diffusion-weighted MRI to evaluate alterations of the spinal cord in a G93A-SOD1 mouse model of ALS. Further preclinical and translational studies are needed to validate this method for monitoring the progression of motor and non-motor neural diseases.Acknowledgements
No acknowledgement found.References
1. Foerster BR, Welsh RC, Feldman EL. 25 years of neuroimaging in amyotrophic lateral sclerosis. Nat Rev Neurol 2013;9(9):513-524.
2. Niebroj-Dobosz I, Rafalowska J, Fidzianska A, Gadamski R, Grieb P. Myelin composition of spinal cord in a model of amyotrophic lateral sclerosis (ALS) in SOD1G93A transgenic rats. Folia Neuropathol 2007;45(4):236-241.
3. Xiao L, Wu EX. Diffusion-weighted magnetic resonance spectroscopy: a novel approach to investigate intramyocellular lipids. Magn Reson Med 2011;66(4):937-944.
4. Cao P, Wu EX. In vivo diffusion MRS investigation of non-water molecules in biological tissues. NMR Biomed 2016;10.1002/nbm.3481.
5. Hoff BA, Chenevert TL, Bhojani MS, Kwee TC, Rehemtulla A, Le Bihan D, Ross BD, Galbán CJ. Assessment of Multi-Exponential Diffusion Features as MRI Cancer Therapy Response Metrics. Magn Reson Med 2010;64(5):1499-1509.
Figures