4611
Measurement of mean transit time changes in response to Acetozalomide challenge in patients with cerebral steno-occlusive disease: a study using dynamic susceptibility contrast MR perfusion imaging.Kyle Pate1, Junjie Wu1, Seena Dehkharghani2, Fadi Nahab1, Jason Allen, and Deqiang Qiu1
1Emory University, Atlanta, GA, United States, 2New York University
Synopsis
In this paper, 9 patients with chronic cerebrovascular disease underwent a two day MR perfusion study with a Diamox challenge in order to quantify cerebrovascular reserve with a focus on MTT and Tmax parameters. Parametric maps were generated and used to compare regional differences in four perfusion parameters between the left and right hemispheres, MCA and ACA vascular territories, and the cerebellum. This approach demonstrated an unexpected increase in MTT and Tmax augmentation in the anterior circulation over augmentation in the cerebellum.
Introduction
Measuring cerebrovascular reactivity allows stratifying risk of stroke among patients with cerebrovascular steno-occlusive diseases and could be a useful measure in evaluating the role of cerebrovascular contribution to aging and Alzheimer’s disease1. Previous attempts in quantifying CVR using MR dynamic susceptibility contrast (DSC) perfusion imaging has been largely limited to the evaluating of augmentation of cerebral blood flow (CBF) and cerebral blood volume (CBV). However, absolute quantification of CBF and CBV using MR perfusion imaging has been technically challenging. MRI allows relatively more accurate measurement of mean transit time (MTT) and time to peak of the residue function (Tmax). Augmentation of MTT and Tmax from DSC MR perfusion imaging in response to cerebrovascular stimuli have not been explored. We aimed to study MTT and Tmax changes before and after Acetazolamide administration and compared them to changes of relative CBF and CBV in patients with chronic cerebrovascular disease.Materials and Methods
Nine patients underwent a two day, MR perfusion study with acetazolamide (Diamox) administration on the first study day and no Diamox administration on the second day to determine cerebrovascular reserve. 4 patients had left-sided cerebrovascular disease and 5 had bilateral disease. Perfusion Mismatch Analyzer (PMA) software package was used to generate four parametric maps for both pre- and post- Diamox perfusion studies. These parameters included relative cerebral blood flow (CBF), relative cerebral blood volume (CBV), mean transit time (MTT), and time to maximum tissue residue function (Tmax). The arterial input function (AIF) was selected automatically for the calculation of CBV, CBF, and MTT. AIF locations were manually matched between pre and post Diamox studies for Tmax. Parametric maps for pre and post Diamox administration were coregistered and resliced for each patient and normalized to MNI space. Augmentation maps for each parameter were calculated in MATLAB using masks to determine values for the left and right hemispheres and the left and right MCA and ACA territories. CBF and CBV parameter were normalized to the mean value of the cerebellum, and the normalized values are termed nCBF and nCBV respectively because DSC only allows measurement of relative CBF and CBV. Augmentation values were calculated as MeanPost/MeanPre , which equals to the true augmentation values of CBF and CBV normalized to the augmentation values of the cerebellum. The augmentation value for MTT and Tmax was defined as (Meanpost - Meanpre )/Meanpre x 100%. In normal brain region, we expect a reduction in MTT after Diamox administration.Results
Compromised augmentation/changes in CBF, CBV, MTT and Tmax can be observed in the left hemisphere compared to the right. Mean whole brain CBV augmentation values were greater than 1.0 for all patients with a mean value of 1.23, suggesting higher augmentation than the cerebellum; and mean whole brain CBF augmentation was greater than 1.0 in all but 2 patients (0.98 and 0.97) with a mean value of 1.30. Among all patients, mean CBV augmentation in the MCA territory was significantly lower (p = 0.001) on the left side than the right (mean of 1.025 and 1.151 respectively). MTT and Tmax augmentation were calculated as percent change from pre Diamox administration. Mean whole brain augmentation ranged from -0.7% to 88.3% for MTT (mean = 16.1%) and -50.8% to 52.2% for Tmax (mean = 1.0%). MTT and Tmax augmentation for the left and right hemispheres was also compared to mean augmentation of the cerebellum (Table 1). Mean MTT augmentation was significantly higher in the left and right hemispheres compared to the cerebellum in all patient groups except the right hemisphere of patients with bilateral disease. Mean Tmax augmentation was significantly higher in the left and right hemispheres compared to the cerebellum in patients with unilateral disease. MTT and Tmax augmentation were not significantly different between the two hemispheres although there was a trend toward a greater MTT augmentation in the left hemisphere in patients with left-sided disease (p = 0.064).Conclusion
MR DSC perfusion imaging before and after Diamox administration can be used to regionally quantify changes in MTT and Tmax in addition to conventionally measured relative CBF and CBV values in patients with cerebrovascular disease. Increased MTT values in the anterior circulation were observed after Diamox injection, in contrast to expected reduction of MTT in healthy subjects. Subgroup analysis revealed significantly increased MTT augmentation of the anterior compared to the posterior circulations. Alterations in MTT and Tmax response to Diamox suggest these parameters might be useful for studying the cerebral hemodynamic interactions in these patients, and could be as a useful biomarker for identifying a subpopulation with highest risk of recurrent strokes.Acknowledgements
No acknowledgement found.References
1 Gupta, A. et al. Cerebrovascular reserve and stroke risk in patients with carotid stenosis or occlusion a systematic review and meta-analysis. Stroke 43, 2884-2891 (2012).Word Count: 508 wordsFigures
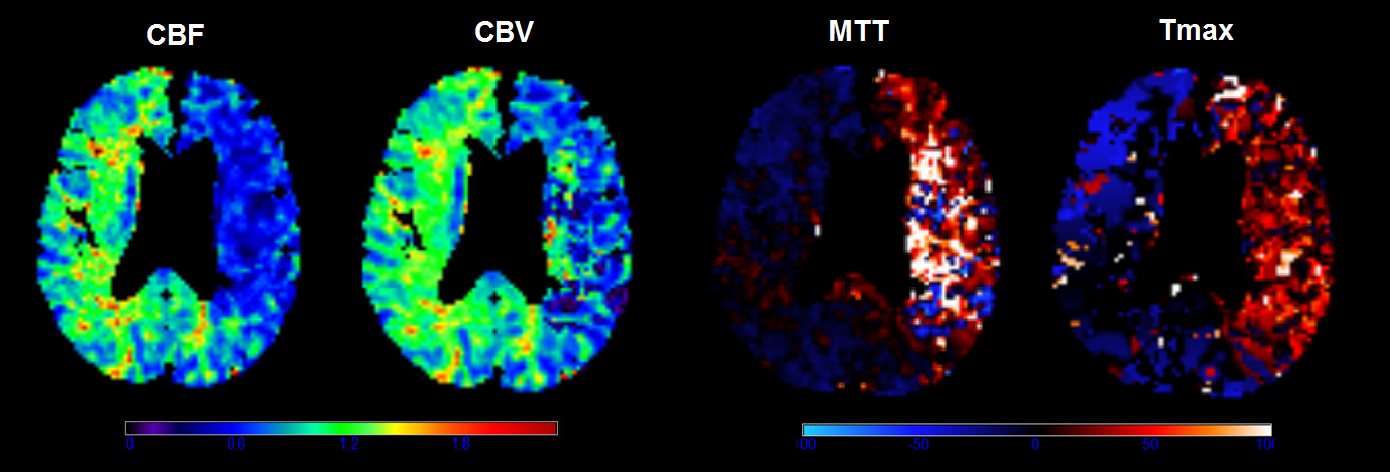
Figure 1: CBF, CBV, MTT, and Tmax
augmentation maps for patient with left internal carotid artery occlusion
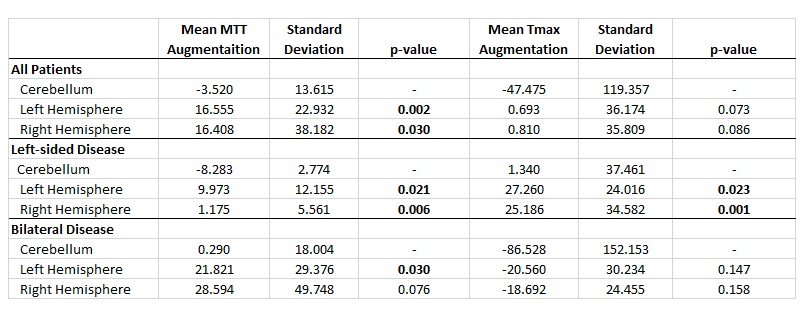
Table 1: Mean
and standard deviations for MTT and Tmax in Left and Right hemispheres for all
patients, patients with left sided disease, and patients with bilateral
disease. p-values represent from one-tailed paired t-tests comparing mean
augmentation of left and right hemispheres to mean augmentation in the
cerebellum for each group.