4610
Differentiation of Intracerebral Hemorrhage from Ischemic Stroke at Early Stage Using a Novel Scheme of Length and Offset VARied Saturation (LOVARS) MRI1Henan Provincial People’s Hospital, Zhengzhou, People's Republic of China, 2The Johns Hopkins University School of Medicine, Baltimore, MD, United States, 3AnatomyWorks LLC, Baltimore, MD, United States, 4Northwest University, Xi'an, People's Republic of China, 5Siemens Healthcare China, Beijing, People's Republic of China
Synopsis
This study investigated the diagnostic capability of a novel scheme of Length and Offset VARied Saturation (LOVARS) CEST method, for detecting and differentiating intracerebral hemorrhage from ischemic stroke at early stage. With the saturation offsets of 2 ppm and -3.5 ppm, the new LOVARS real image is able to separate ischemic lesion from hemorrhagic lesion by the opposite signal appearances for all patients enrolled. i.e. the former is hypointensity while the latter is hyperintensity. Our results revealed that the LOVARS real signals are significantly higher in hemorrhage than in ischemic stroke, which may serve as an imaging marker.
INTRODUCTION:
The early diagnosis and distinction of intracerebral
hemorrhage (ICH) and ischemic stroke (IS) are very important for improving the patient
outcomes. We aim to use one MRI sequence to achieve the simultaneous detection
and differentiation of the two kinds of stroke. The Length and Offset
VARied Saturation (LOVARS) method was reported capable for sensing
the contents of proteins, peptides, amino acids as well as tissue pH, on the high-field small animal scanners. It also features improved robustness to B0 inhomogeneity and higher contrast-to-noise-ratio
compared to the conventional CEST method based on asymmetric analysis.1
Herein we evaluated the capability of LOVARS in differentiation of ICH from IS in patients at 3-T.METHODS:
This study was approved by the local institutional review board, and written informed consent was obtained from each patient before participation. 11 ICH patients and 13 IS patients within 24 hours after symptom onset were enrolled. LOVARS sequence, as well as the routine T1w, T2w and DWI scans, were performed using a 3-T MRI unit (Magnetom Trio, Siemens Medical Solutions, Erlangen, Germany). Using a total acquisition time of ~ 6 min, LOVARS collected 12 saturation-weighted images, each using a prototype 2D single-slice gradient echo protocol (slice thickness, 5 mm; TR/TE, 1620 ms/2.87 ms; FOV, 25.6 × 25.6 cm2; and matrix, 128 × 128).
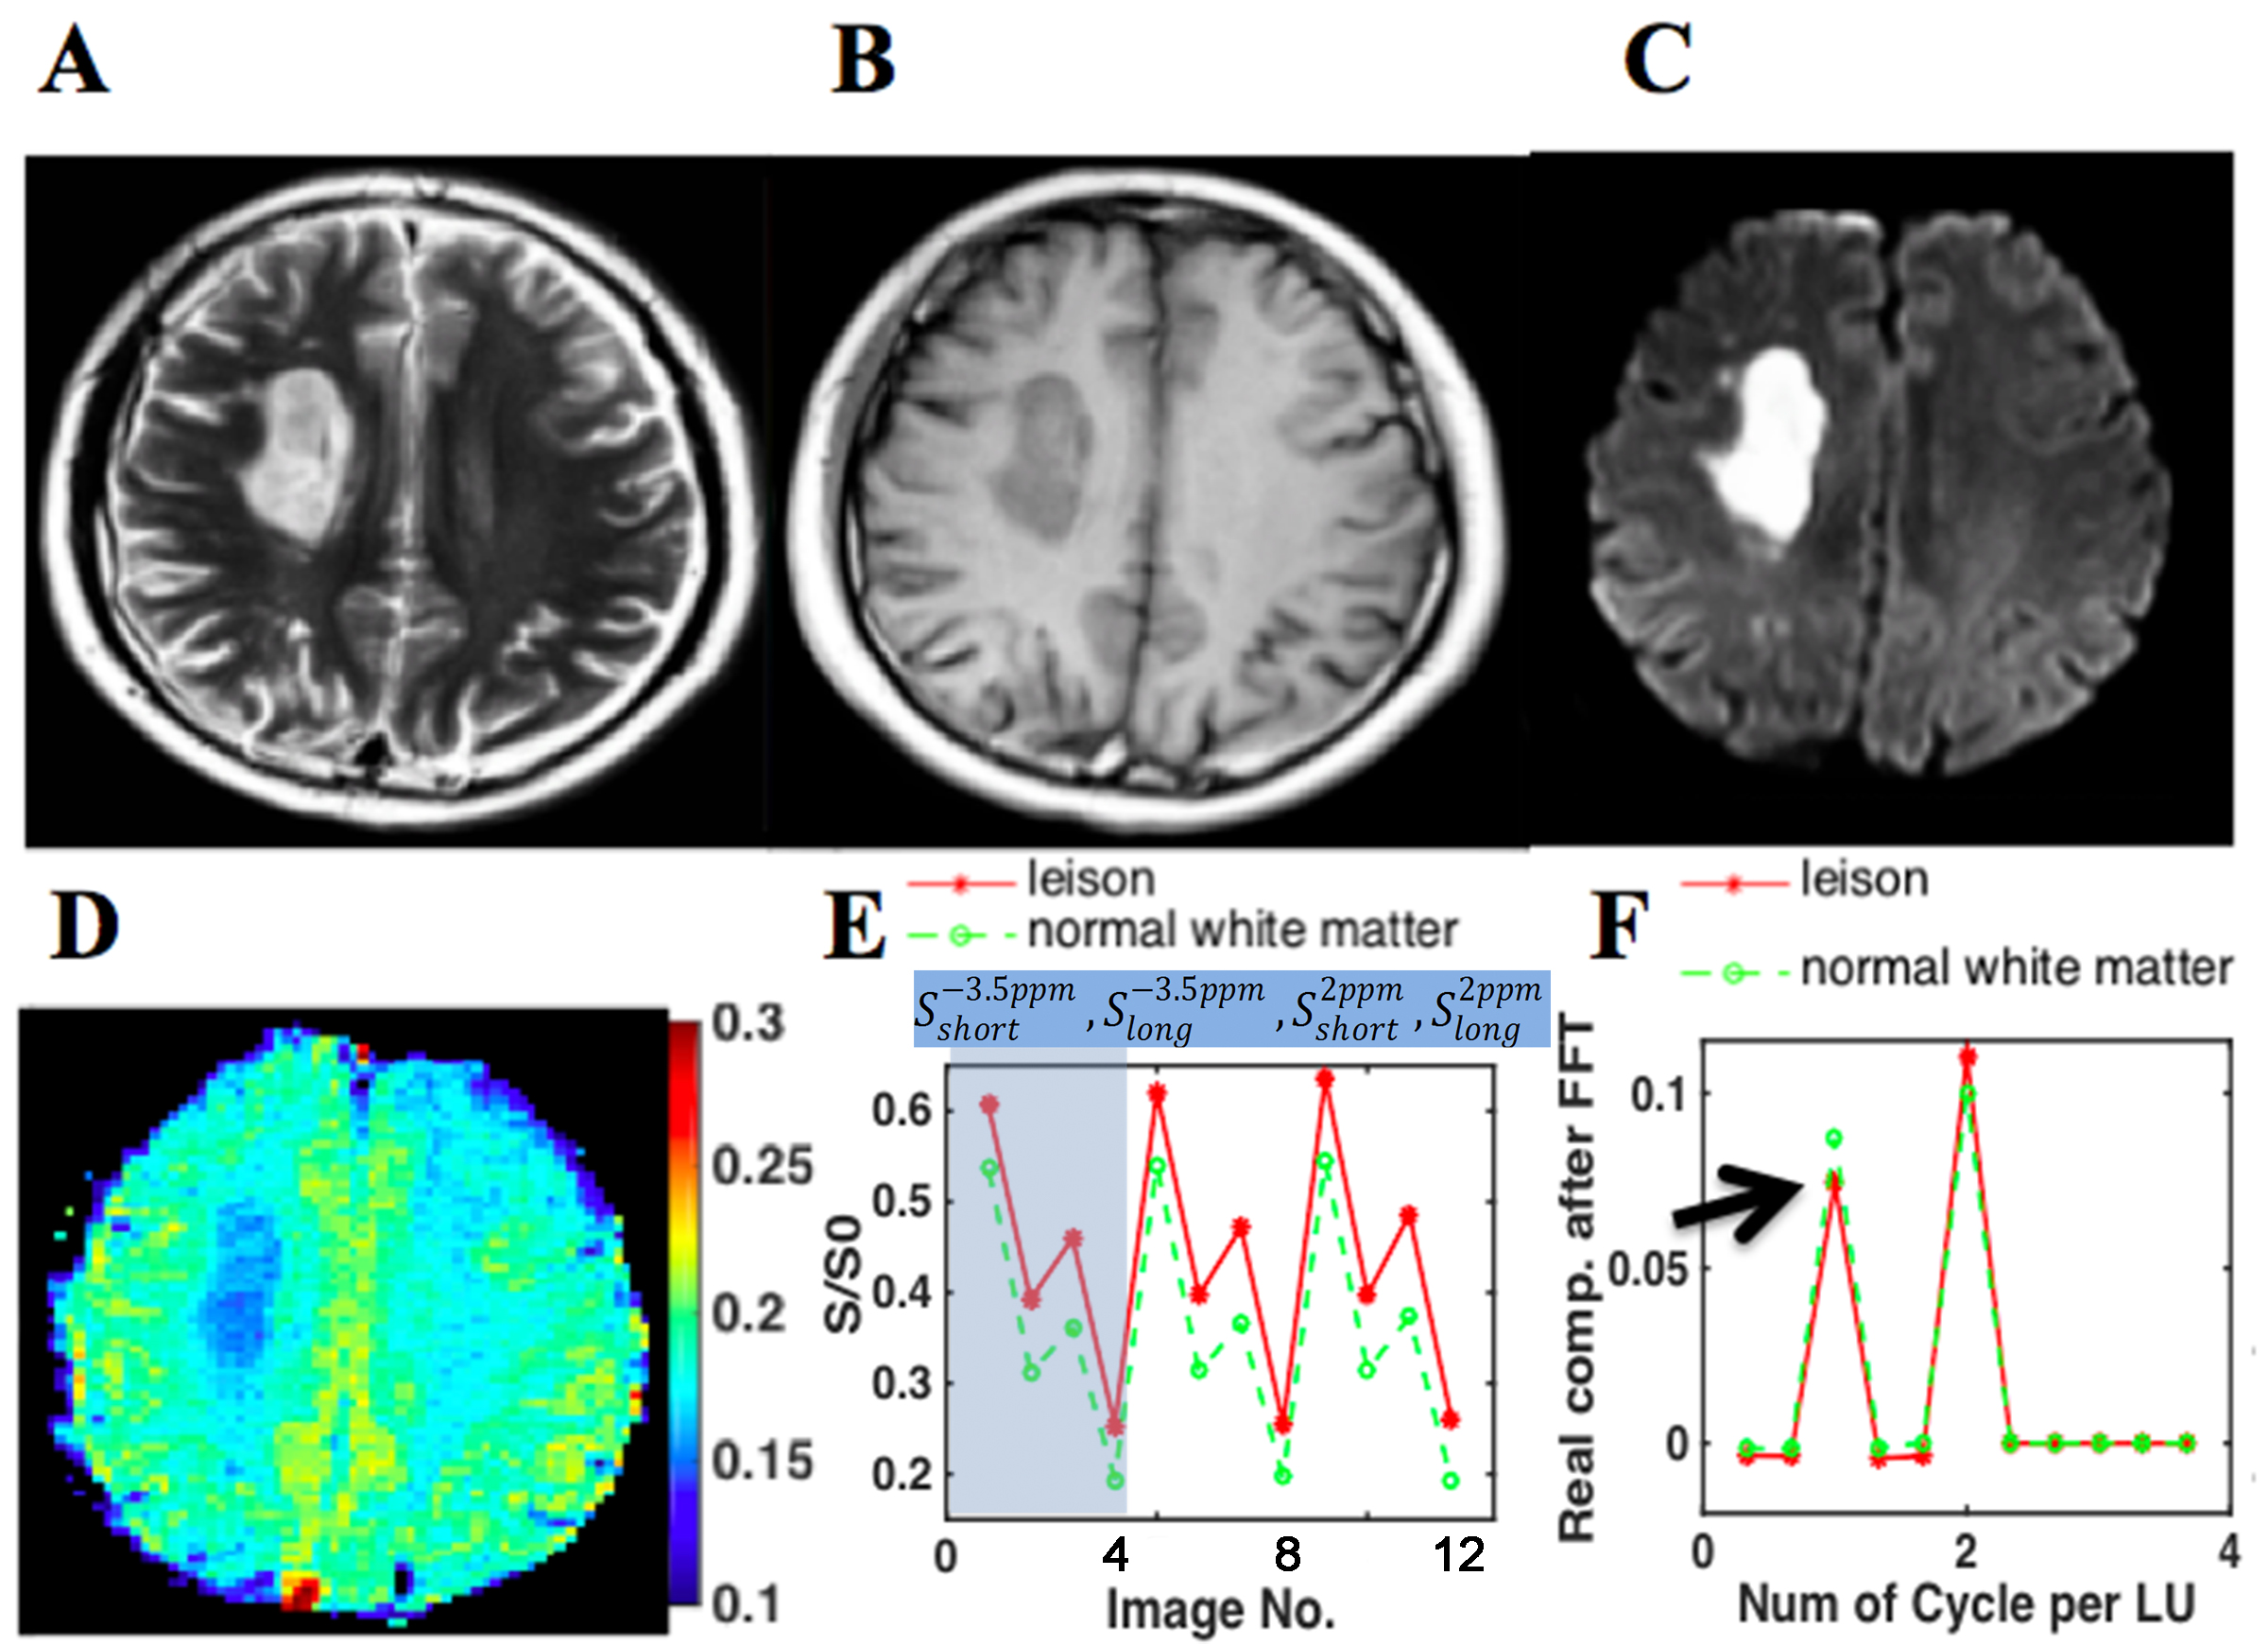
More specifically, LOVARS consists of 3 repeats of LOVARS’ Unit 1, which is [S(–3.5 ppm, Tsat_short), S(–3.5 ppm, Tsat_long), S(+2 ppm, Tsat_short), S(+2 ppm, Tsat_long)]3.
Noted that different from previously [-3.5ppm, 3.5ppm], in this novel LOVARS scheme the four images in the LOVARS unit located at saturation frequency offsets of [–3.5 ppm, +2 ppm] at opposite sides of water. Tsat_long indicates use of 5 saturation pulses of 2.0 μT (100 ms in length with 100 ms intervals), whereas Tsat_short uses 2 saturation pulses. The 12 LOVARS images (3 LOVARS’ Units) were first normalized by S0, the control image without saturation. These images were then undergoes a voxel-by-voxel fast frontier transform. Finally, the LOVARS real map was generated at 1 cycle/LOVARS’ Unit.1 The LOVARS real signal intensities were measured and compared between the ICHs and ISs by using a Mann-Whitney U test.
RESULTS:
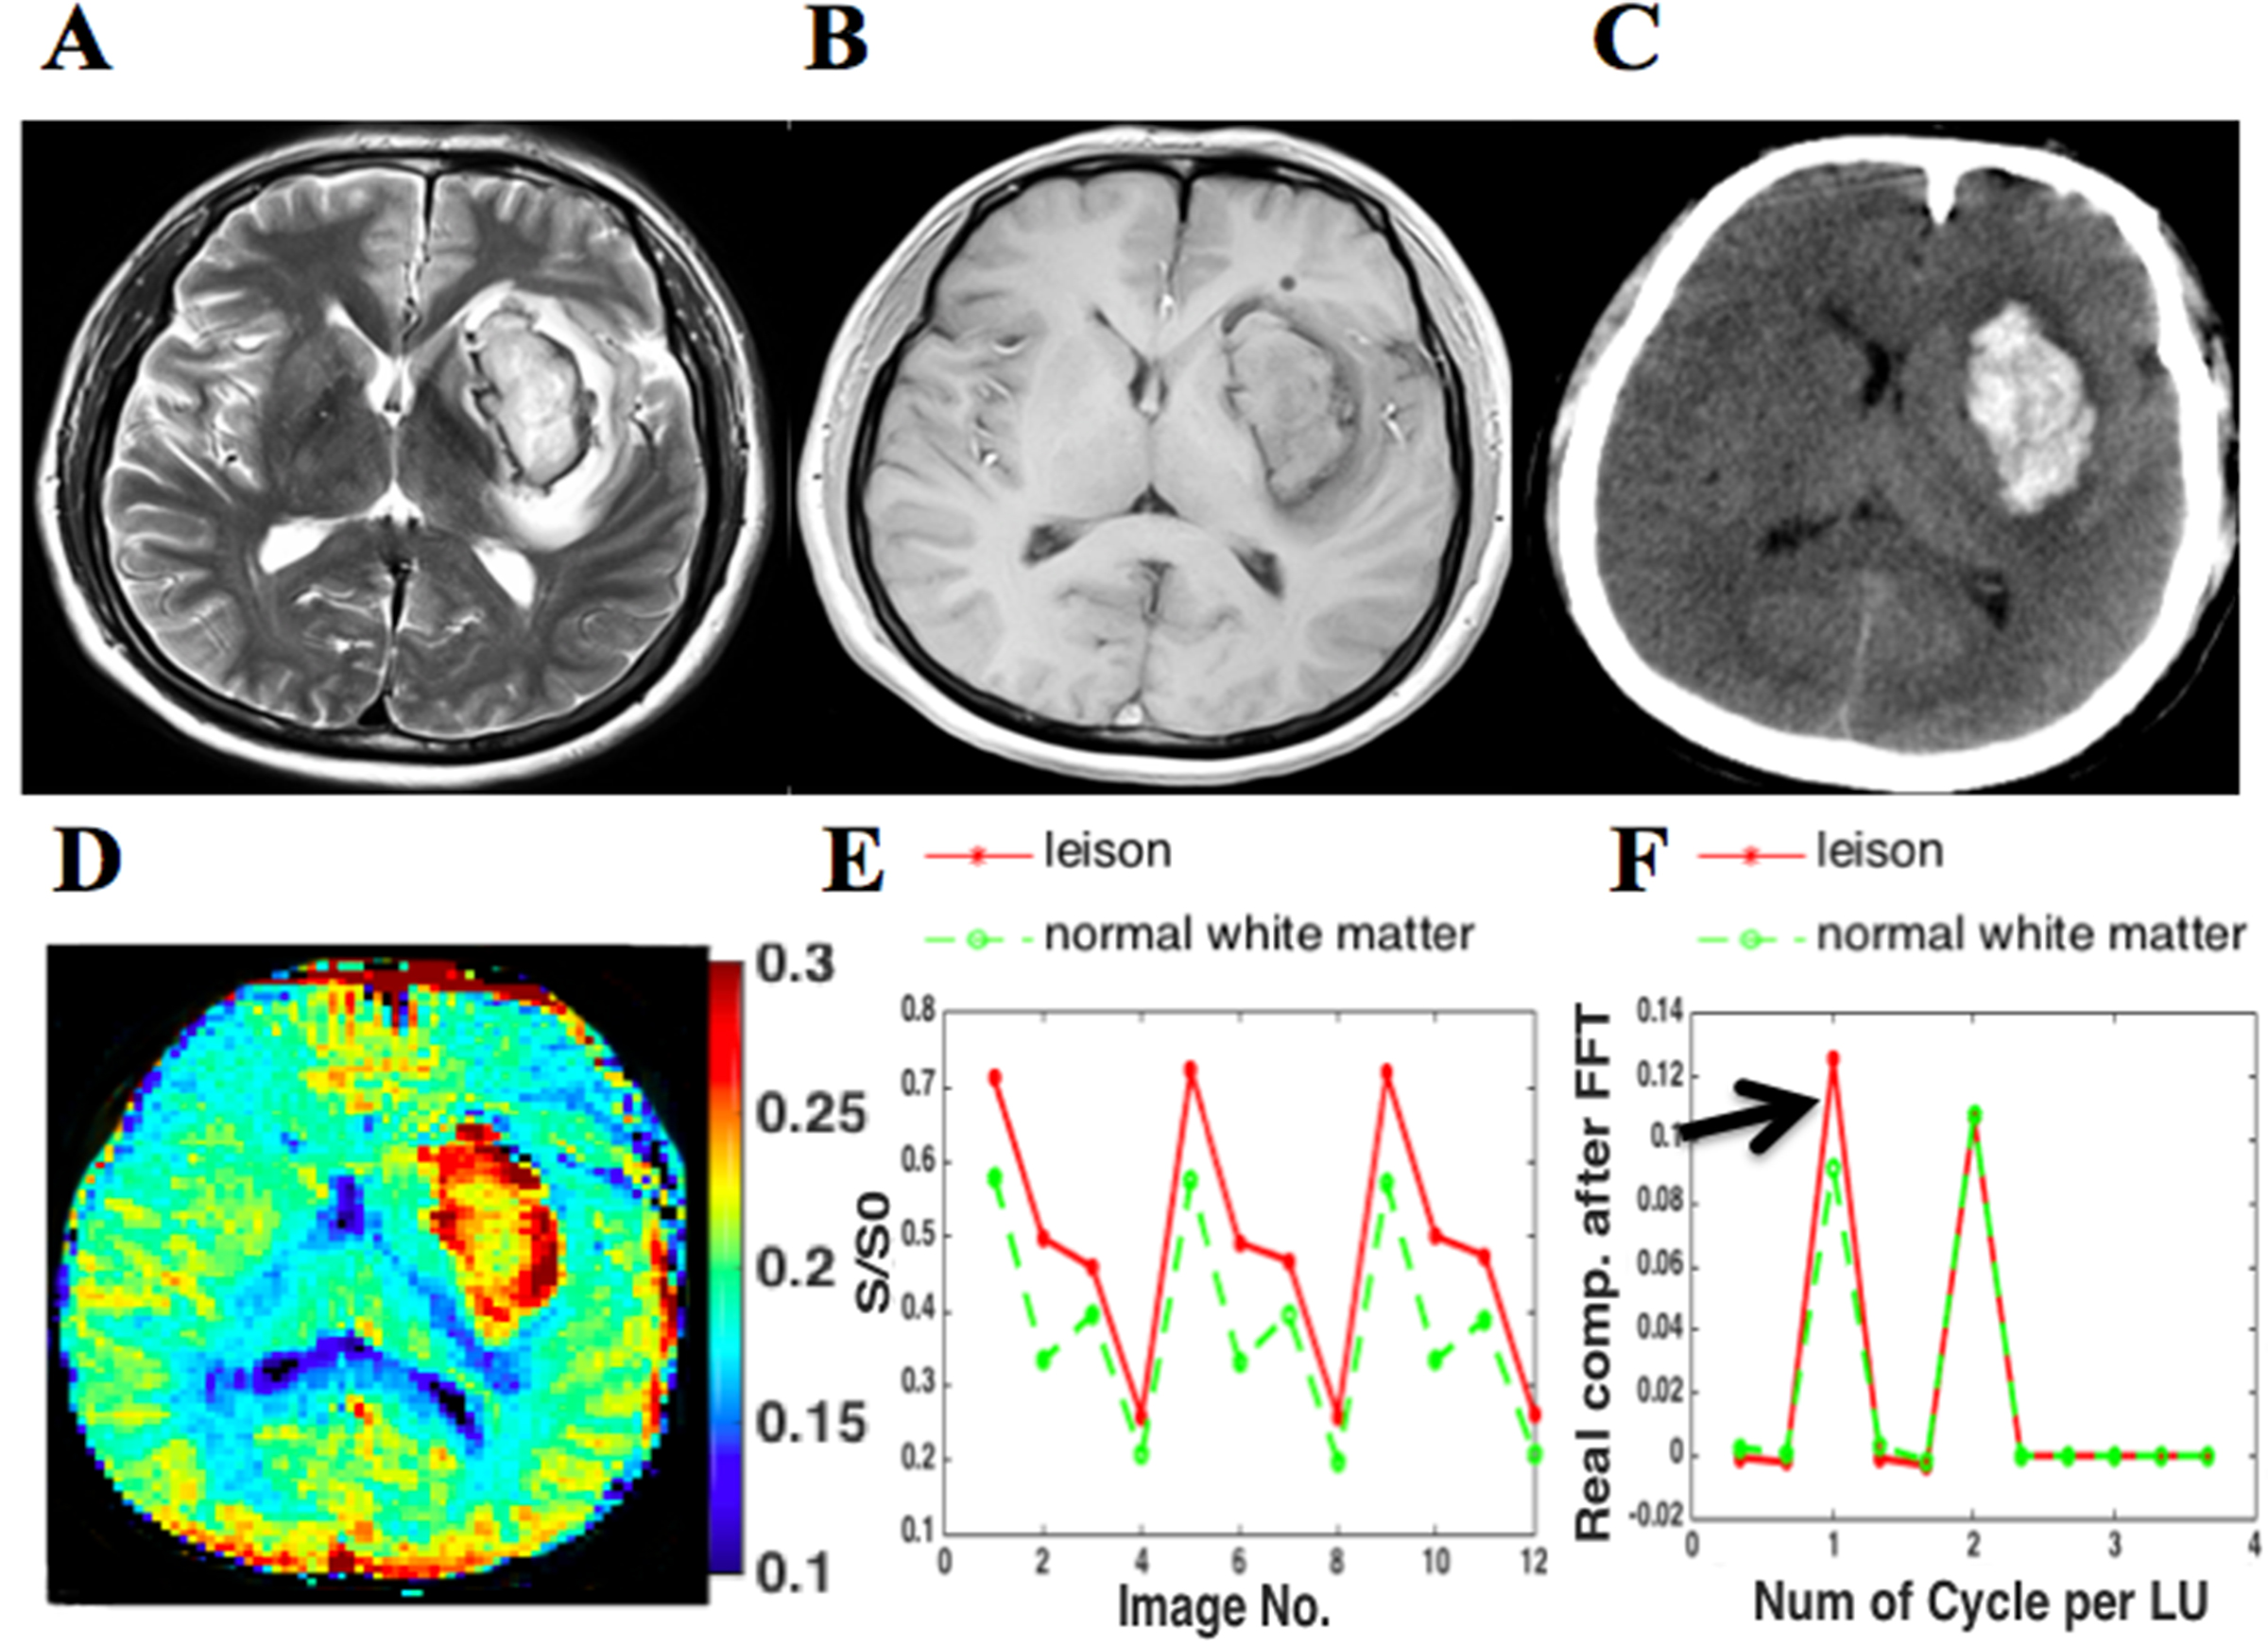
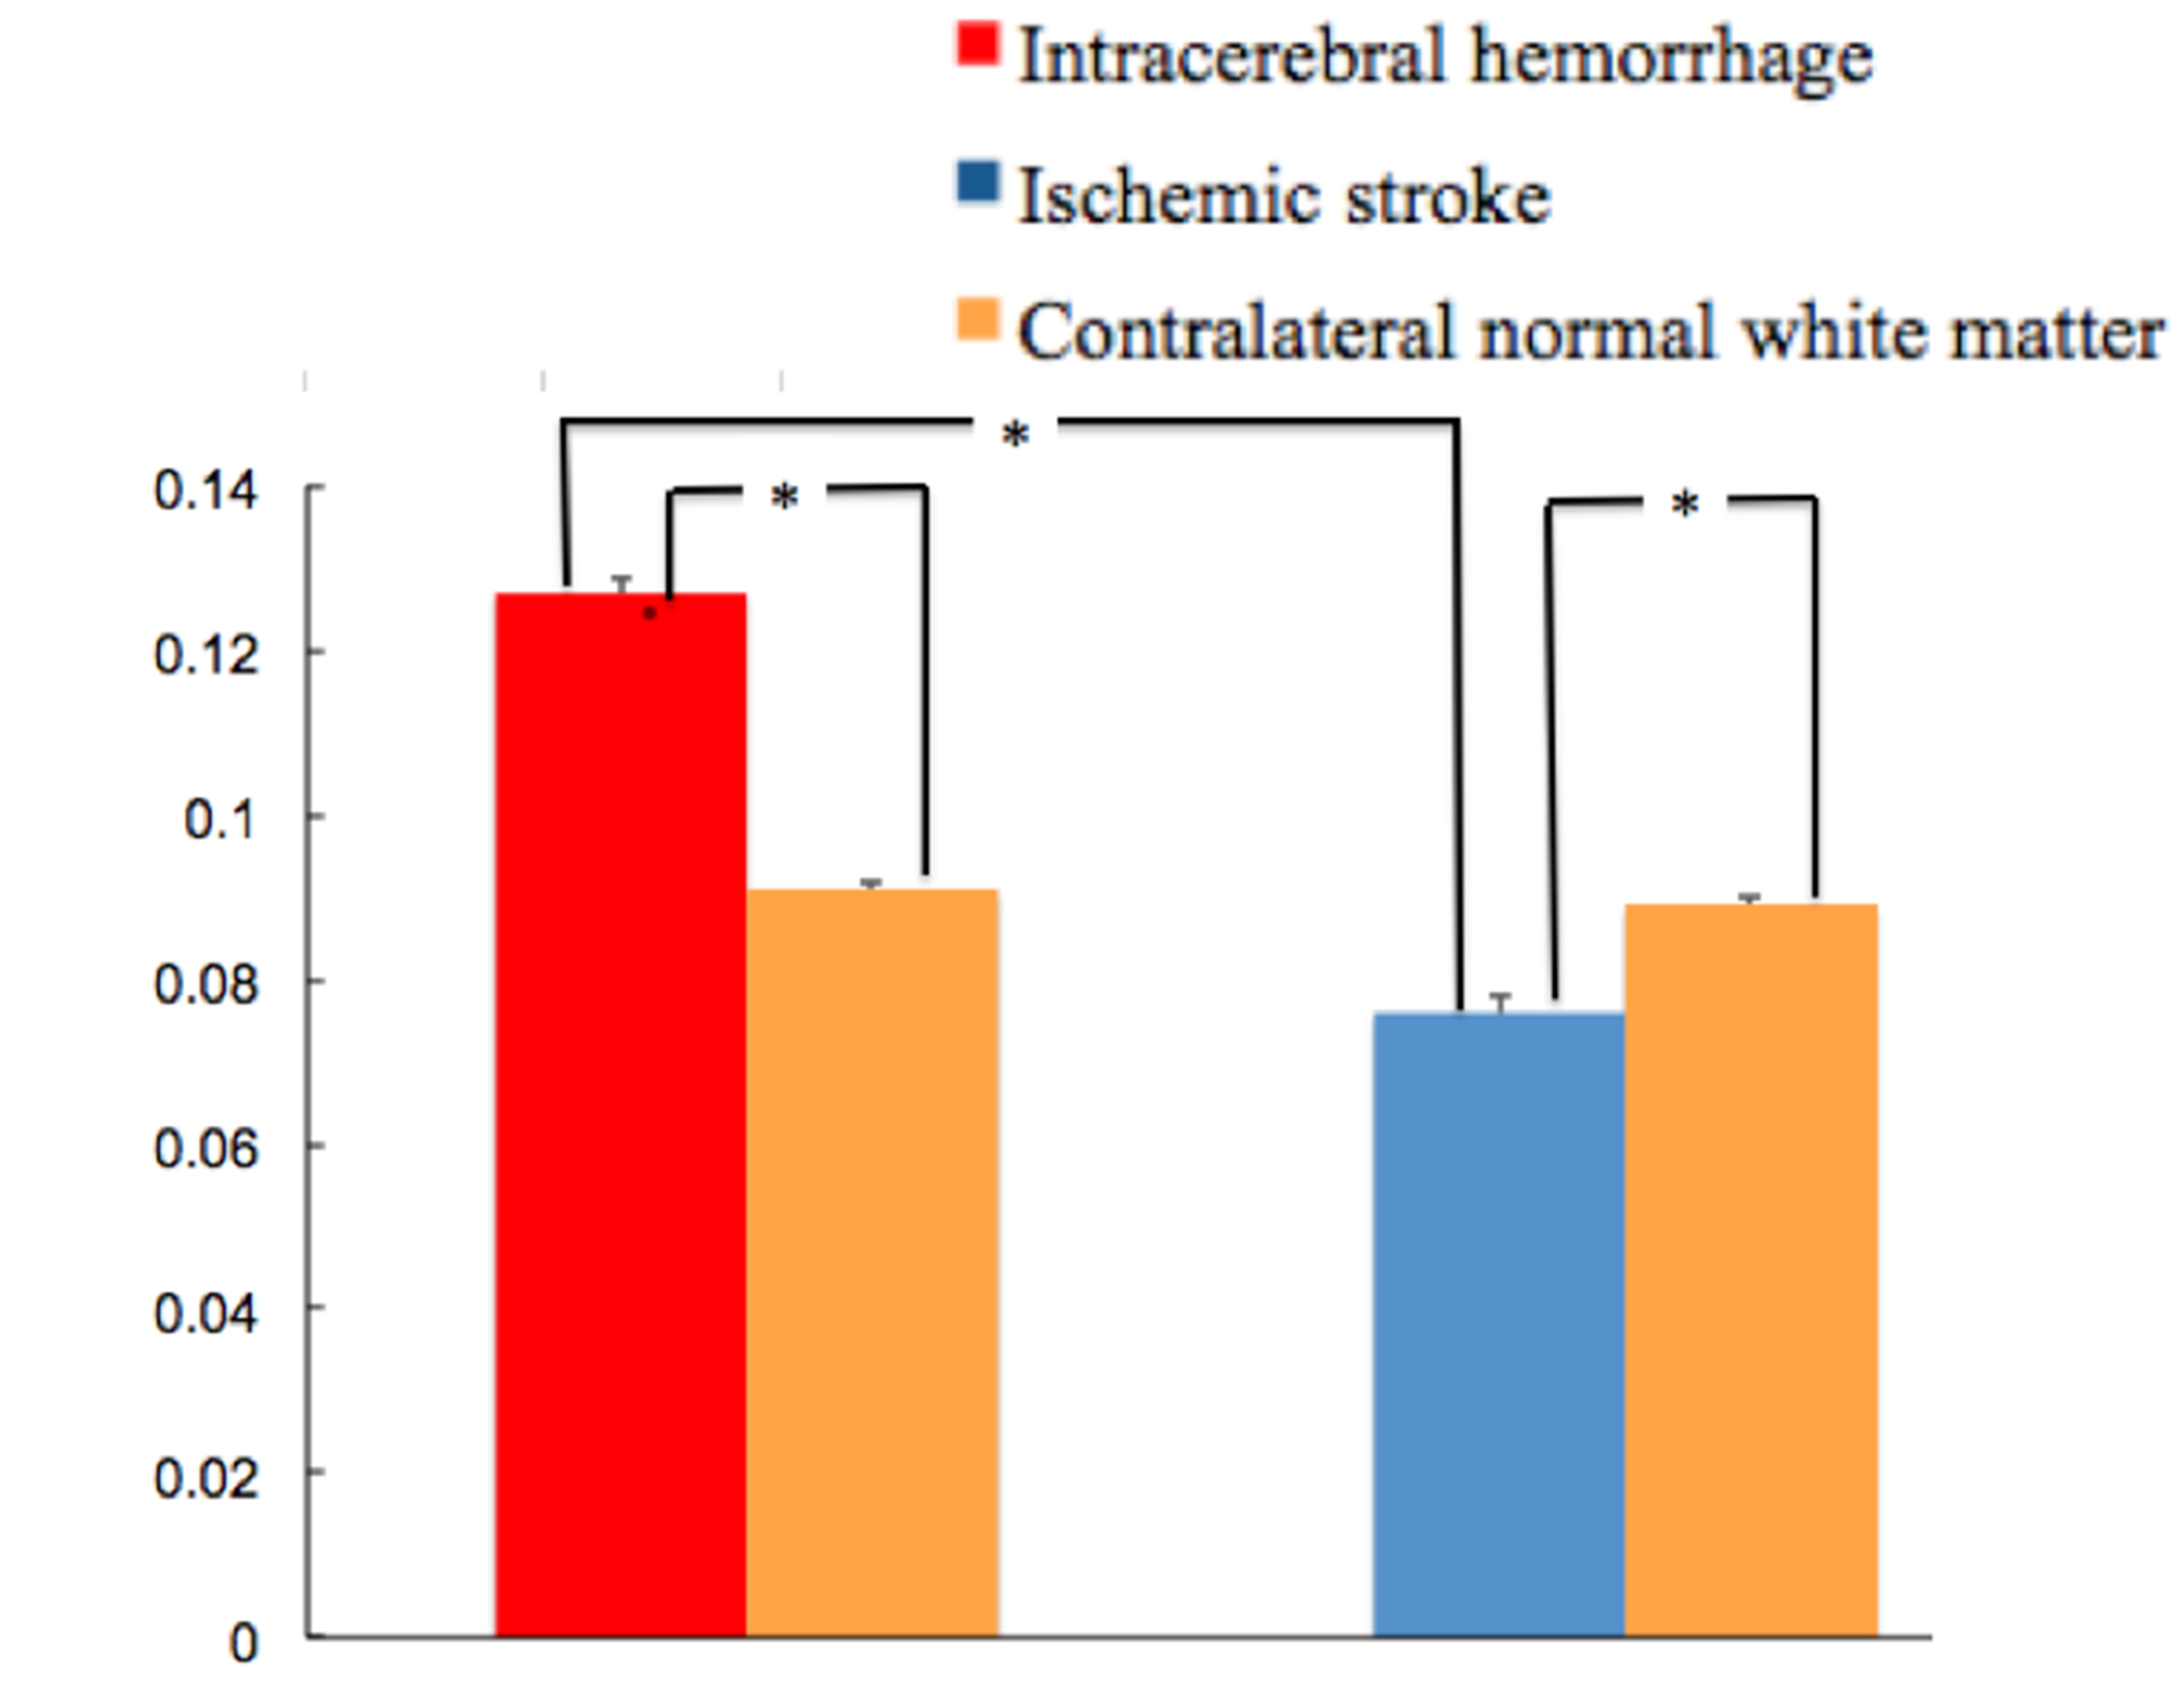
Our results showed that LOVARS-derived real images consistently showed the opposite signal appearances for the IS lesion and the ICH lesion for all patients. For Case 1, the ischemic lesion is hypointensity compared to the control normal white matter (CNWM) on the LOVARS real image (Fig.1D) while it’s hyperintensity on the DWI (Fig.1C). Fig.1E further shows the curves for water signal density on the original acquired 12 images, for the central lesion region (red) and for the CNWM (green), respectively. The novel acquisition scheme was also illustrated for the 1st LOVARS Unit. After a voxel-by-voxel FFT, the LOVARS real values on 1 cycle/LU enable the separation of lesion and the CNWM (Fig.1F). For Case 2, the hemorrhagic lesion shows hyperintensity compared to the CNWM on LOVARS real image (Fig.2D, F), while conventionally hemorrhage has to been confirmed by the CT image (Fig.2C). Statistically, the ICHs had significantly higher LOVARS real signal intensities than the ISs (P < 0.001) (Figure 3). However, if using the same saturation transfer pulses, either the LOVARS-derived maps with the frequency offsets of [–3.5 ppm, +3.5 ppm], or the asymmetric MTR analysis could not show the statistical difference.
It was presumably because that although the specific absorption rate value satisfied the clinical regulation in this study, the employed saturation sequence could not obtain sufficient saturation like the continuous-waved pulse used in the previous study.2
DISCUSSION:
The higher LOVARS real signal intensity in the intracerebral hemorrhage may be mainly contributed by the blood products in the hematoma which has abundant protein contents3. In the ischemia, the decreased LOVARS real signal intensity may be primarily attributable to the reduced tissue pH caused by acidosis following impaired aerobic metabolism, similar to other CEST sequence described.4,5CONCLUSION:
The real signal of the novel LOVARS scheme using 2ppm and -3.5ppm may serve as a new surrogate imaging biomarker for detection and separation of intracerebral hemorrhage from ischemic stroke at early stage.Acknowledgements
National Natural Science Foundation of China (81601466), NIH R21 EB020905References
1. Song X, Gilad AA, Joel S, et al. CEST phase mapping using a length and offset varied saturation (LOVARS) scheme. Magn Reson Med. 2012;68(4):1074-1086.
2. Sun PZ, Cheung JS, Wang E, et al. Association between pH-weighted endogenous amide proton chemical exchange saturation transfer MRI and tissue lactic acidosis during acute ischemic stroke. J Cereb Blood Flow Metab. 2011;31:1743-1750.
3. Jin T, Wang P, Zong X, et al. Magnetic resonance imaging of the Amine-Proton EXchange (APEX) dependent contrast. Neuroimage. 2012;59:1218-1227.
4. Li H, Zu Z, Zaiss M, et al. Imaging of amide proton transfer and nuclear Overhauser enhancement in ischemic stroke with corrections for competing effects. NMR Biomed. 2015;28:200-209.
5. Smith EE, Rosand J, Greenberg SM. Imaging of hemorrhagic stroke. Magn Reson Imaging Clin N Am. 2006;14:127-140.
Figures