4606
Abnormal Brain Functional connectivity strength in the Absence of the Corpus Callosum: A Resting-State fMRI Study1Beijing Chao-Yang hospital, Beijing, People's Republic of China, 2Beijing Chao-Yang hospital
Synopsis
The problem
The whole-brain functional connectivity strength on long-range and short-range in the AgCC is still unknown.
Methods
A novel voxel-based FCS analysis were performed on the whole-brain resting-state functional images.
Results
Compared with the healthy control subjects, the AgCC groups exhibits statistical differences of FCS on long-range and short-range connecvity respectively.
Conclusions
Anatomical distance affects functional connectivity strength in AgCC individuals.
INTRODUCTION
Agenesis of the corpus callosum (AgCC) is an anatomically defined neurological defect which occurs in 3–5% of individuals with neurodevelopmental disorders1. AgCC individuals display a specific pattern of neuropsychological and psychosocial deficits which interfere with daily life. Abnormal functional connectivity has been observed in the absence of the corpus callosum2. Whether and how anatomical distance affects functional connectivity strength (FCS) at rest remains unclear in the absence of the corpus callosum (AgCC). It is the first time to investigate the whole-brain intrinsic functional connectivity patterns in AgCC.METHODS
This prospective study was approved by the research ethics committee, and all participants provided informed consent. Ten subjects with AgCC and 20 healthy control participants underwent resting-state functional magnetic resonance imaging (rs-fMRI). Imaging were acquired on a Siemens 3.0-T scanner (MAGNETOM Trio Tim, System AG, Germany) by using a standard 8-channel head coil receiver. The two groups did not differ significantly (p >0.05) with regard to mean age (AgCC: 40.9 ± 15.1 years; controls: 36.7 ± 12.4 years). All of the control subjects were right-handed, while the AgCC group was composed of six right-handed and four left-handed individuals.
Whole-brain resting-state functional images were acquired using a gradient-echo echo-planar imaging (EPI) sequence, with the following parameters: repetition time / echo time (TR/TE) = 2000 ms / 30 ms, 90° flip angle, 22 mm FOV, 64 × 64 matrix, 3mm thickness, 1mm gap, 33 axial slices, 178 volumes. Whole-brain three-dimensional (3D) structural images were acquired using magnetization-prepared rapid acquisition gradient-echo (MP-RAGE) T1-weighted sequence, with the following parameters: TR/TE = 1900 ms / 2.52 ms; 9° flip angle; 176 slices; 1mm thickness; 250 × 250 matrix ; 1×1×1 mm3 voxel size.
Whole-brain connectivity was analyzed by using a graph theory approach: Voxel-based FCS (e.g. weighted degree centrality), which was further divided into short-range and long-range FCS3. Briefly, Pearson’s correlation coefficients were computed between the time series of all pairs of gray matter voxels within a gray matter mask, and a whole-brain FC matrix was obtained for each participant. Individual correlationmatrices were then transformed into a z-score matrix using Fisher z-transformation to improve normality. The regional FCS of a voxel was computed as the sum of the connections (z values) between a given voxel and all other voxels. Then, we divided The short-range regional FCS of a voxel referred to the sum of those connections (Z-values) between the voxel and other GM voxels with anatomical distances less than 75 mm to the given voxel, whereas the long-range FCS of a voxel referred to the distances greater than 75 mm4. Specifically, a FCS map was computed in each subject and the regions with higher FCS value were considered as functional network hubs. We employed one-sample t tests on FCS within groups to find regions as hubs5. Further, two-sample t tests were performed to compare FCS between groups. The resulting statistical map was performed multiple comparisons using Gaussian Random Field (GRF) theory (voxel p value < 0.001, cluster p value < 0.05, corrected).
RESULTS
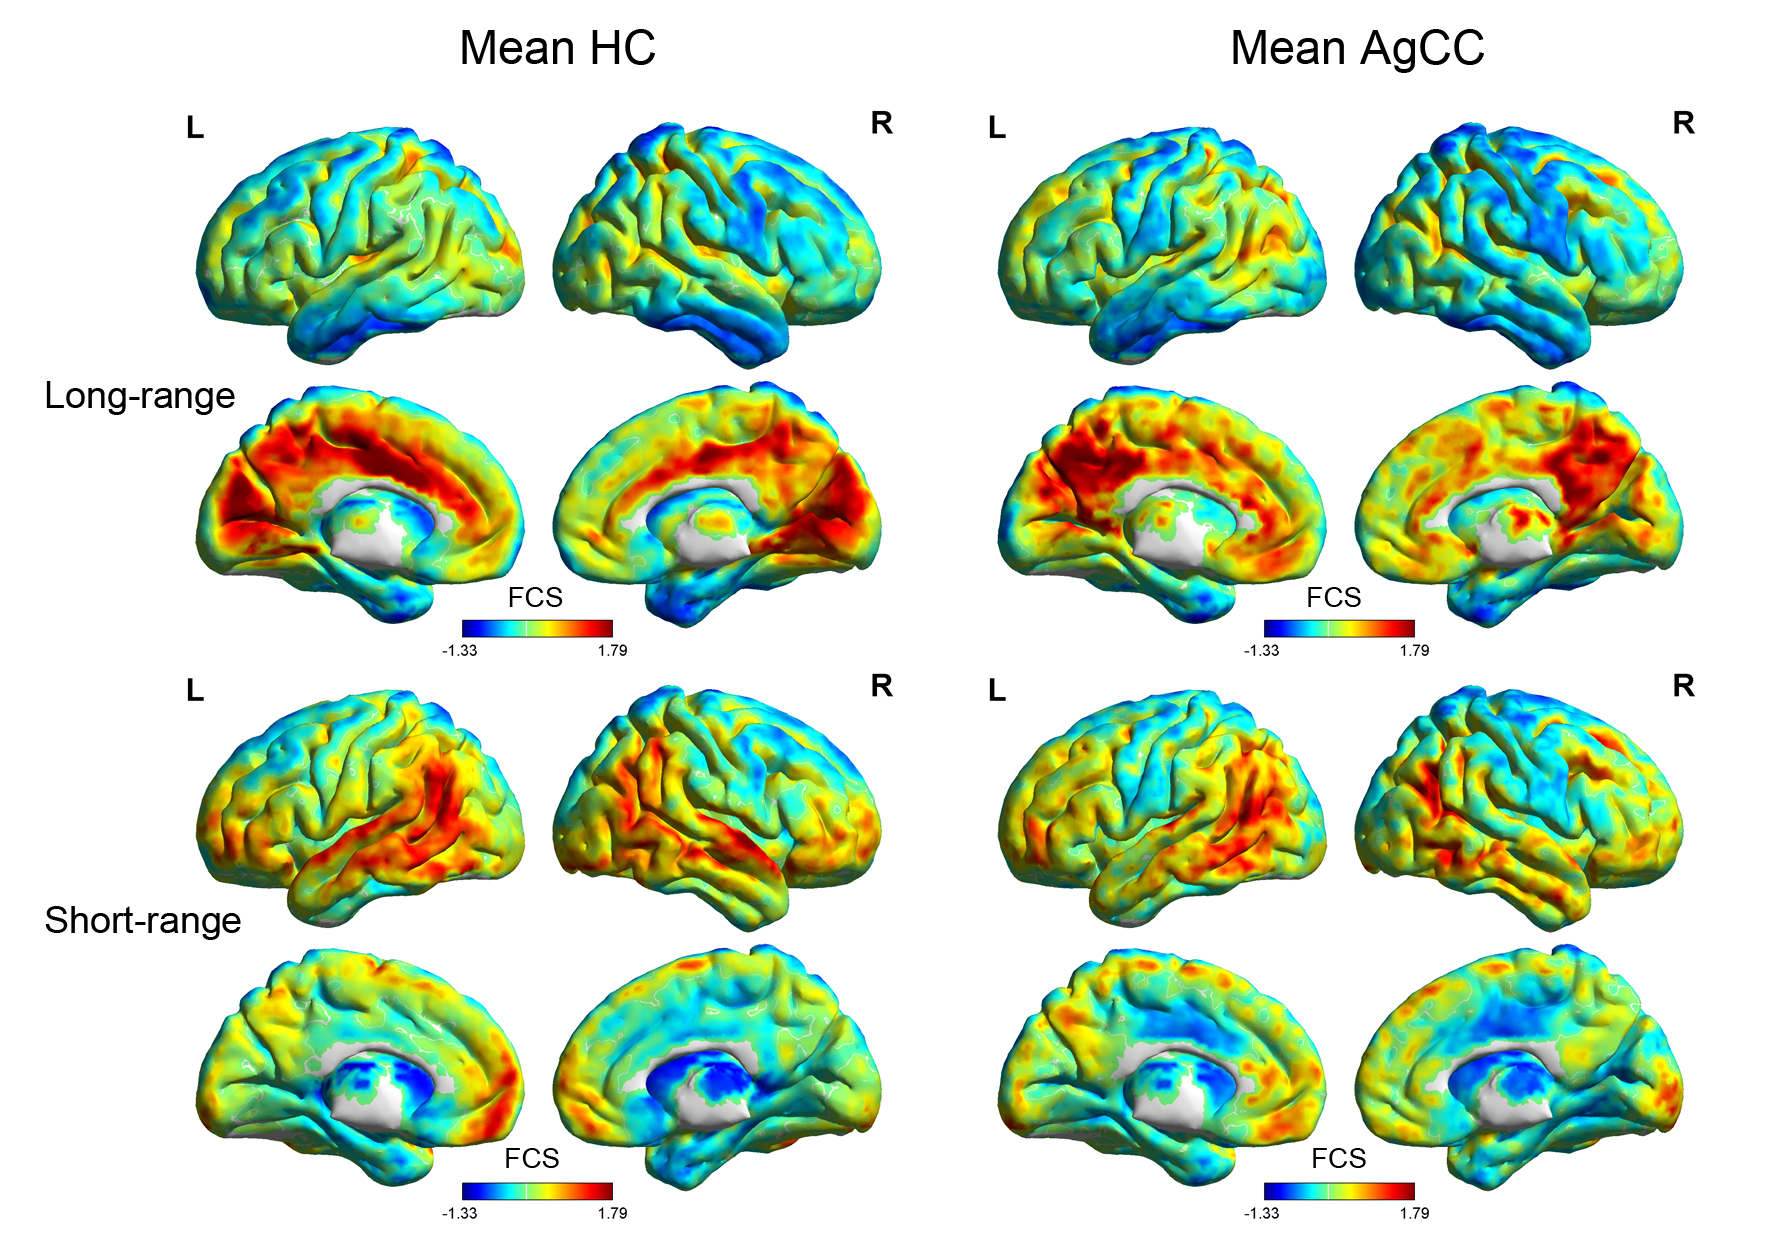
The two groups exhibits similar FSC spatial distributions in long-range or short-range respectively. Regions with higher distant FCS were mainly located in the default-mode network, visual cortex and prefrontal cortex. Subjects showed higher local FCS in the default-mode network, salience network and visual cortex.
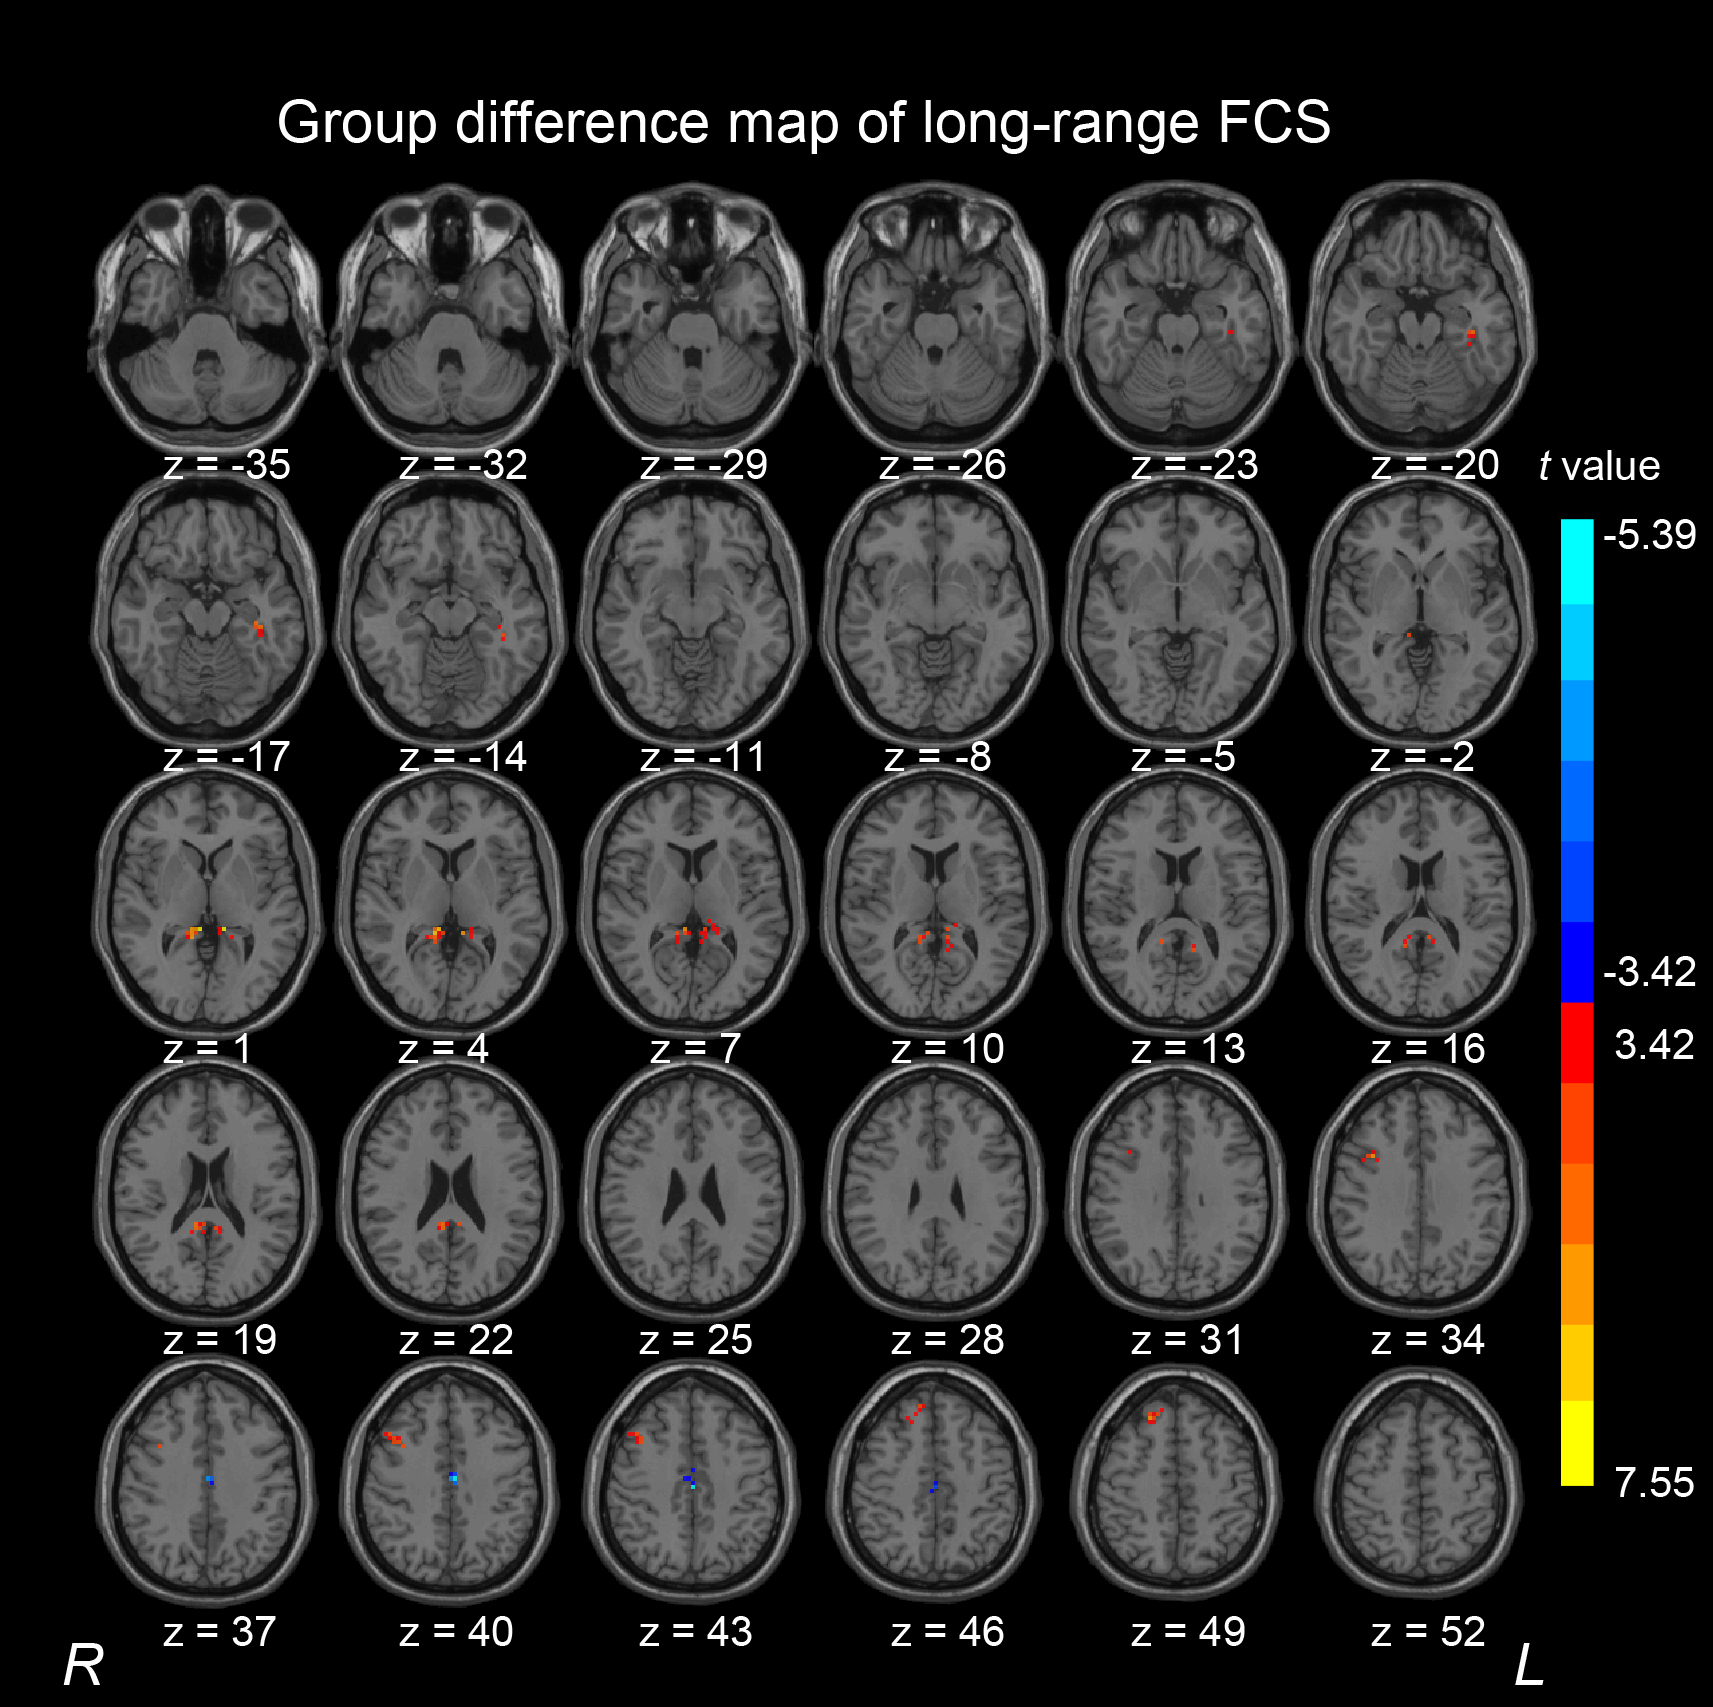
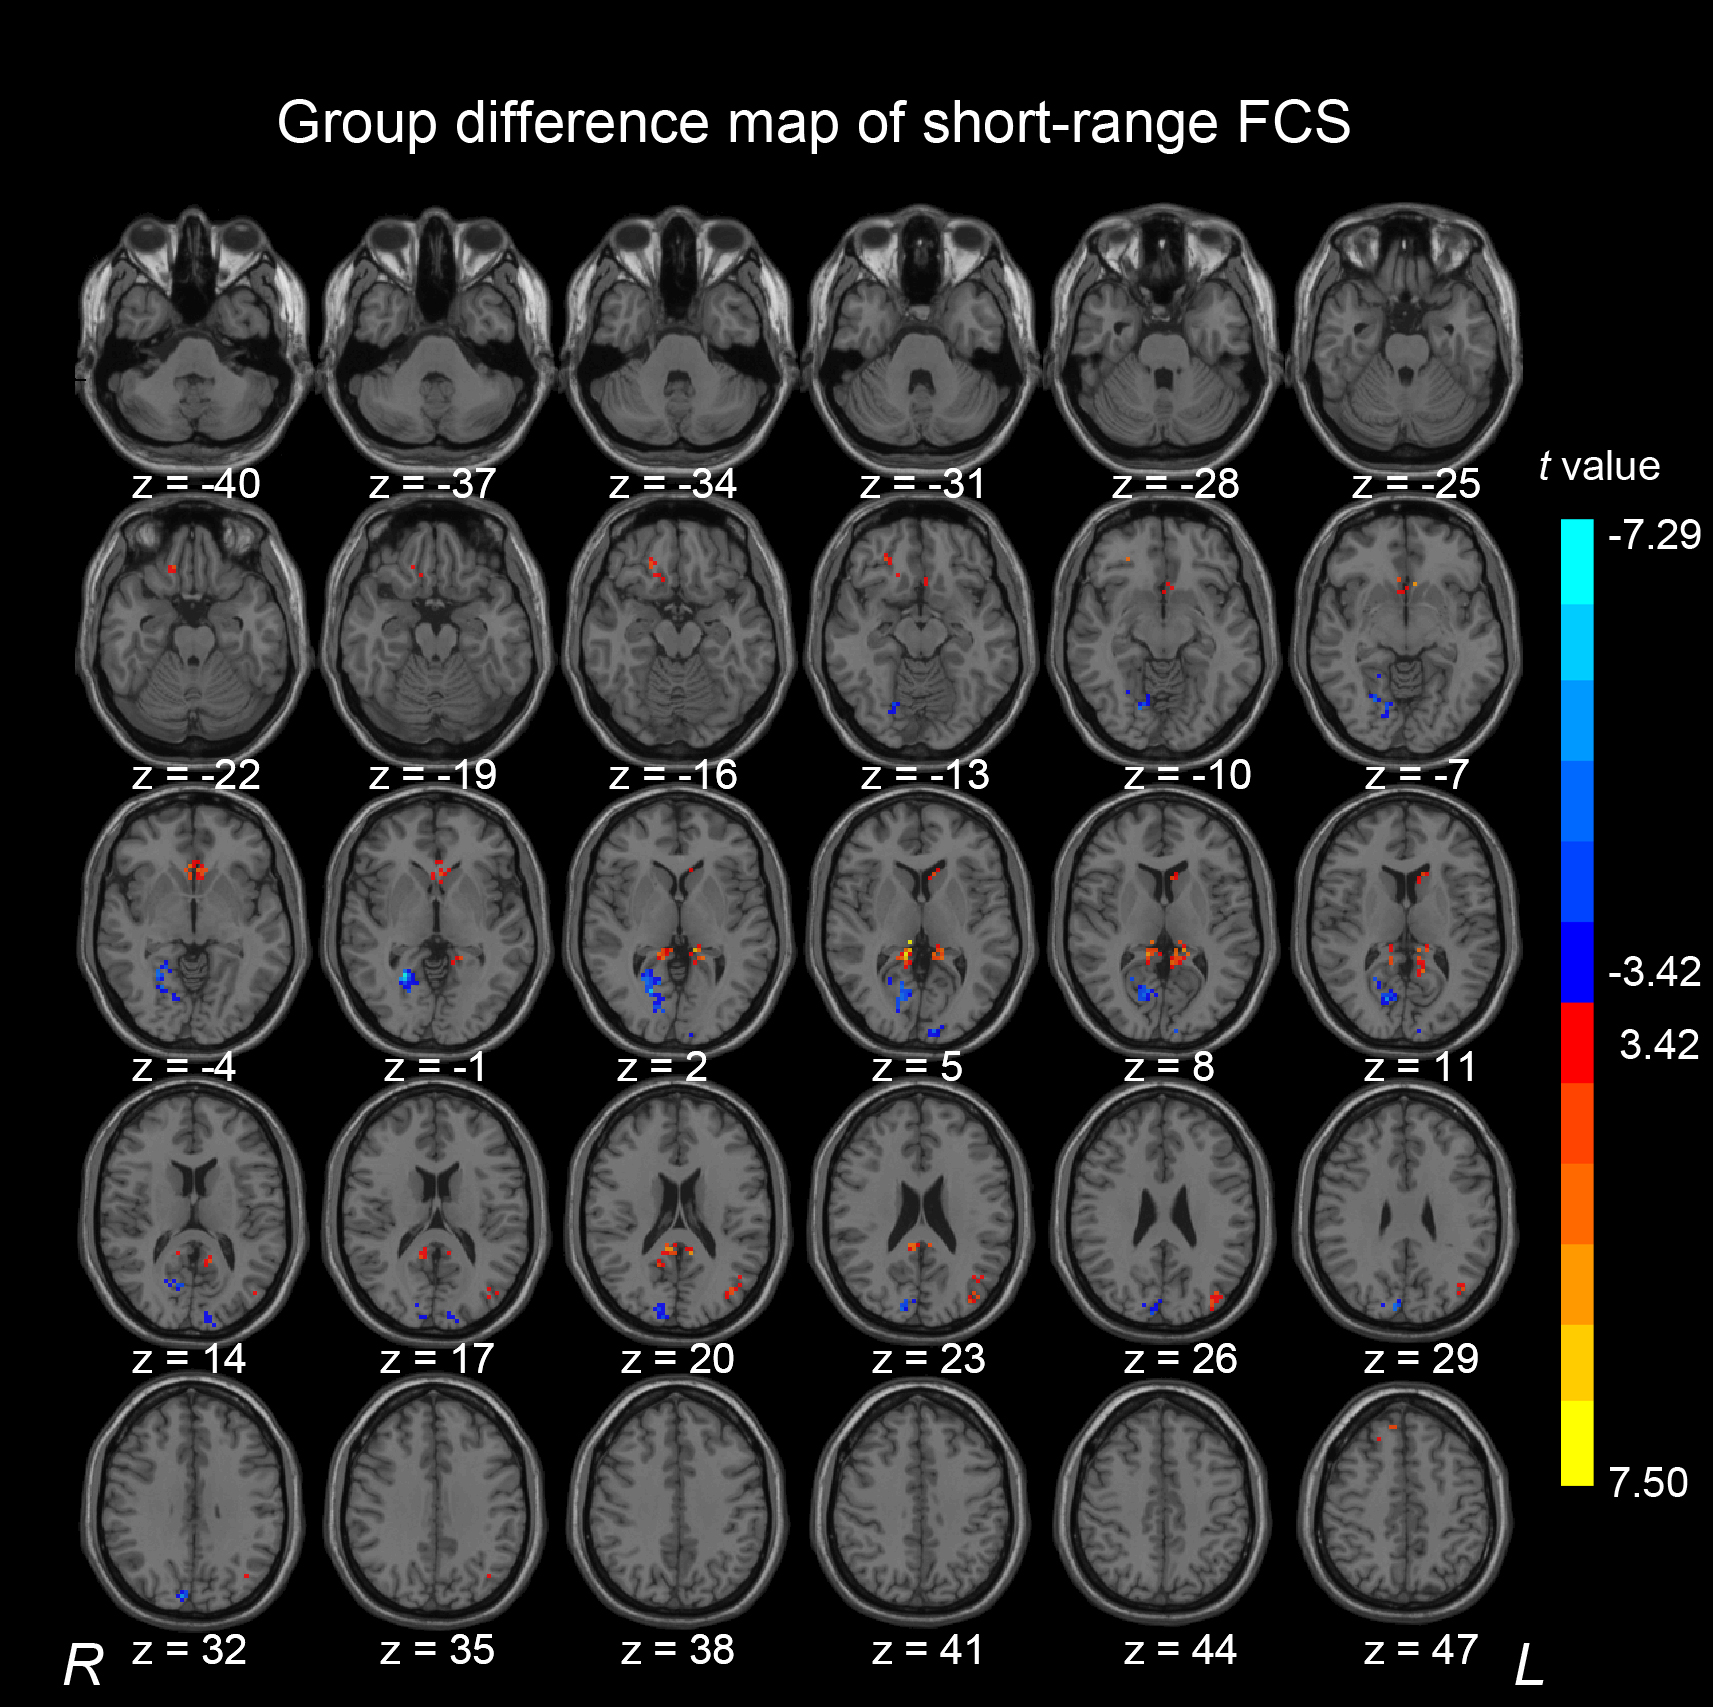
Compared with healthy control subjects, the AgCC individuals exhibited significantly decreased short-range FCS in the right lingual gyrus and right cuneus. The middle cingulum gyrus exhibited decreased long-range FCS in the AgCC. In AgCC group, the precuneus and superior frontal gyrus showed significantly increased FCS in both long-range and short-range. Significantly increased long-range FCS was also found in middle frontal gyrus and parahippocampa gyrus. In addition, AgCC individual exhibited a significantly increased short-range FCS in the orbital frontal gyrus, anterior cingulate gyrus, superior occipital gyrus and middle occipital gyrus.
DISCUSSION
In this study, A voxel-based graph theory analysis was applied to map the local and distant FCS patterns from rs-fMRI in AgCC subjects and healthy control participants. The healthy control and AgCC groups exhibits similar distributions of FSC hubs in long-range or short-range respectively and statistical difference of FCS between the two group, suggesting a complex effect of anatomical distance on FCS underlying AgCC.CONCLUSION
This study is the first to examine long- and short-range FCS of the whole brain in subjects with AgCC. The findings reveal that anatomical distance affects functional connectivity strength in AgCC individuals, which might provide new insights into the neurobiologic machenism of AgCC.Acknowledgements
This work was supported by the National Natural Science Foundation of China (Grant nos. 81541129).References
1. Paul LK, Brown WS, Adolphs R, et al. Agenesis of the corpus callosum: genetic, developmental and functional aspects of connectivity. Nat Rev Neurosci. 2007;8(4):287-299.
2. Owen JP, Li YO, Yang FG, et al. Resting-state networks and the functional connectome of the human brain in agenesis of the corpus callosum. Brain Connect. 2013;3(6):547-562.
3. Dai Z, Yan C, Li K, et al. Identifying and Mapping Connectivity Patterns of Brain Network Hubs in Alzheimer's Disease. Cereb Cortex. 2015;25(10):3723-3742.
4. Achard S, Salvador R, Whitcher B, Suckling J, Bullmore E. A resilient, low-frequency, small-world human brain functional network with highly connected association cortical hubs. J Neurosci. 2006;26(1):63-72.
5. Liu F, Zhu C, Wang Y, et al. Disrupted cortical hubs in functional brain networks in social anxiety disorder. Clin Neurophysiol. 2015;126(9):1711-1716.
Figures