4599
Improving attention through network-based neurofeedback training1InBrain Lab, Department of Physics, Faculty of Philosophy, Sciences and Letters of Ribeirão Preto, University of São Paulo, Ribeirão Preto, SP, Brazil, 2Swiss Institute of Technology, University of Zürich, Zurich, Switzerland, 3Department of Radiology and Medical Imaging, Yale University, New Haven, CT, United States
Synopsis
Being able to sustain attention for longer without mind-wandering would improve our performance. The brain correlates underlying both sustained attention and mind-wandering – the so-called sustained attention and default mode networks, respectively – have been well identified. Nevertheless, this knowledge has not yet been translated in advanced brain-based attention training protocols. Here we propose to use a novel brain imaging technique based on real-time fMRI to provide participants with information about ongoing levels of activity. We thus purpose a neurofeedback training of this difference between brain networks, what could lead to a boost in sustained attention ability, which is not reported yet.
Introduction
Due to recent advances in data processing, fMRI data can now be analyzed in real-time (1). It is thus possible to measure brain activity in real-time, and provide this information to the participant as a neurofeedback (NF) signal, which enables participants to learn how to voluntarily control the own brain activity (2). NF training of brain regions has been shown to cause behavioral changes (3). This approach could thus be used as a tool to treat neurological and psychiatric disorders (3–5) or even optimize cognitive functions in healthy people (6,7). Most real-time fMRI-NF studies so far have trained participants control over individual brain functions. However, we know that most mental functions, as attention – a fundamental human ability that plays an important role in various daily situations –, are associated with functional brain networks rather than with activity in individual brain regions. Neuroimaging research has identified the so-called sustained attention network (SAN), which consistently becomes active during attention-related cognitive tasks (8). Conversely, mind-wandering and attention lapses are associated with reduced activity in the SAN, and increased activity in the default mode network (DMN) (9,10). The SAN and the DMN are intrinsically anticorrelated, reflecting the competition between sustaining attention and the interference from task-irrelevant thoughts. We thus propose to use a novel network based NF approach to increase SAN and decrease DMN network activity, which likely improves attention and reduces distraction by task-irrelevant thoughts. To our knowledge, this is the first study applying NF training to improve attentive abilities using a priori defined regions based on the competitive networks theory. Also, a recent and powerful approach of real-time fMRI processing is being applied (11) and attention levels are being measured outside RM scanner. If successful, this approach would provide a non-invasive and non-pharmacological tool to deliver general improvements in the ability to sustain attention for cognitive enhancement.Methods
Participants: 4 healthy young adult volunteers participated.
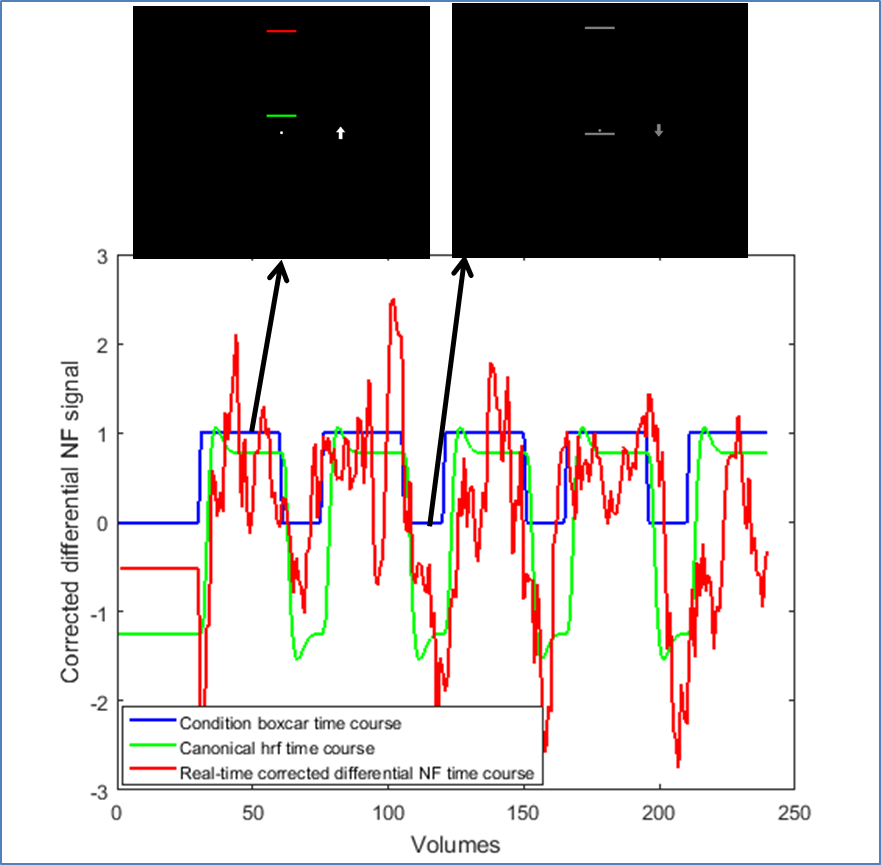
Data acquisition: In a 3T MR scanner, fMRI data was acquired at night using an EPI sequence (TR/TE=2000/22 ms) and 240 volumes for each regulation run. Nine runs of regulation training were acquired during three days. In these runs, first baseline block (60s, to compute baseline for both networks) was a thermometer being shown in a static way, up-regulation blocks (5 blocks, 60s) were consisted by a colored moving thermometer, and down-regulation blocks (4 blocks, 30s) were consisted by a gray-scaled moving thermometer, all shown in a monitor. One run before and another after the complete training were acquired with no feedback, only with static up and down arrows.
Attention tests: They were performed in the morning, before and in the following day after the training days, outside the scanner. All the tests are part of the PEBL software (12), always in this order: Continuous Performance Task (CPT), Psychomotor Vigilance Test (PVT), Task-Switching Performance (TSP), and Stroop.
Real-time fMRI processing: SPM12 and customized MatLab codes were run in a high performance computer, which included real-time spatial realignment, spatial smoothing, corregister of ROIs mask, head movement influence removal, suppression of spikes and high frequency noise performed through a modified Kalman filter and with the signal normalization (11).
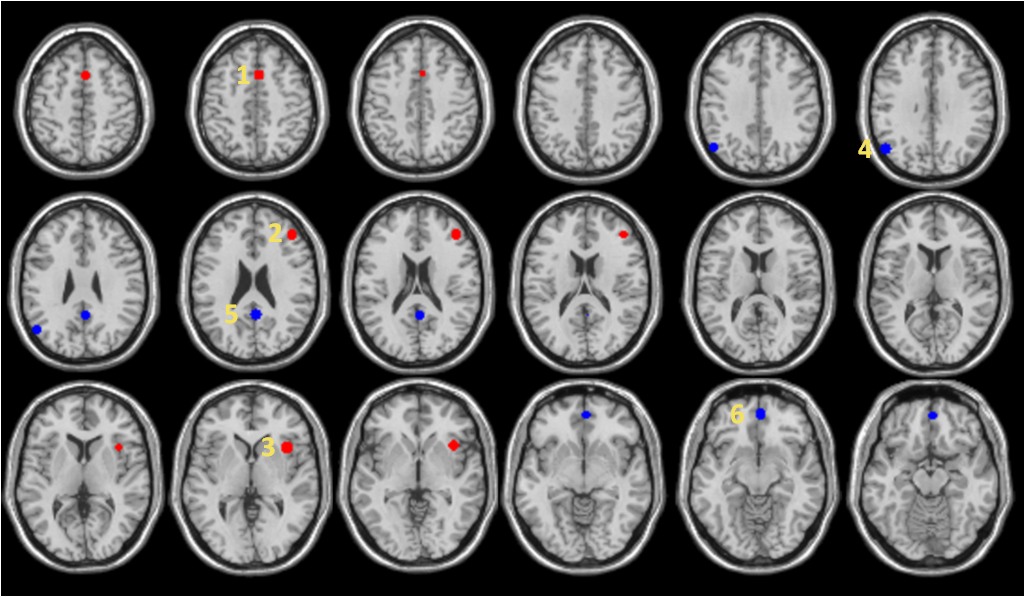
Neurofeedback computation and ROIs definition: 6-mm-radius spherical ROIs were built to represent the chosen networks (figure 1). We used a meta-analysis study to select 3 regions to define SAN (8). 3 DMN ROIs are individually defined through an individual ICA approach of resting-data acquired before training days.
Instructions: participants received suggestions for up-regulation, which were related to attention maintenance and refocusing, and down-regulation suggestions, related to mind-wandering.
Results and Discussion
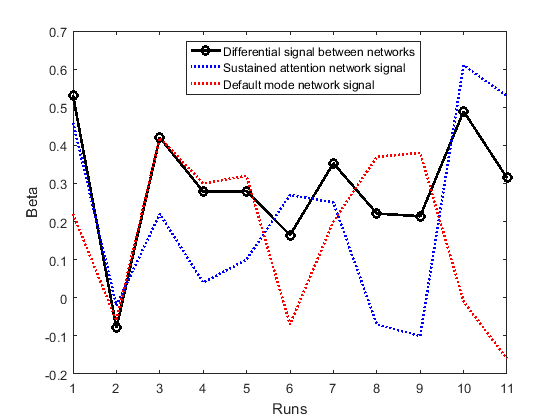
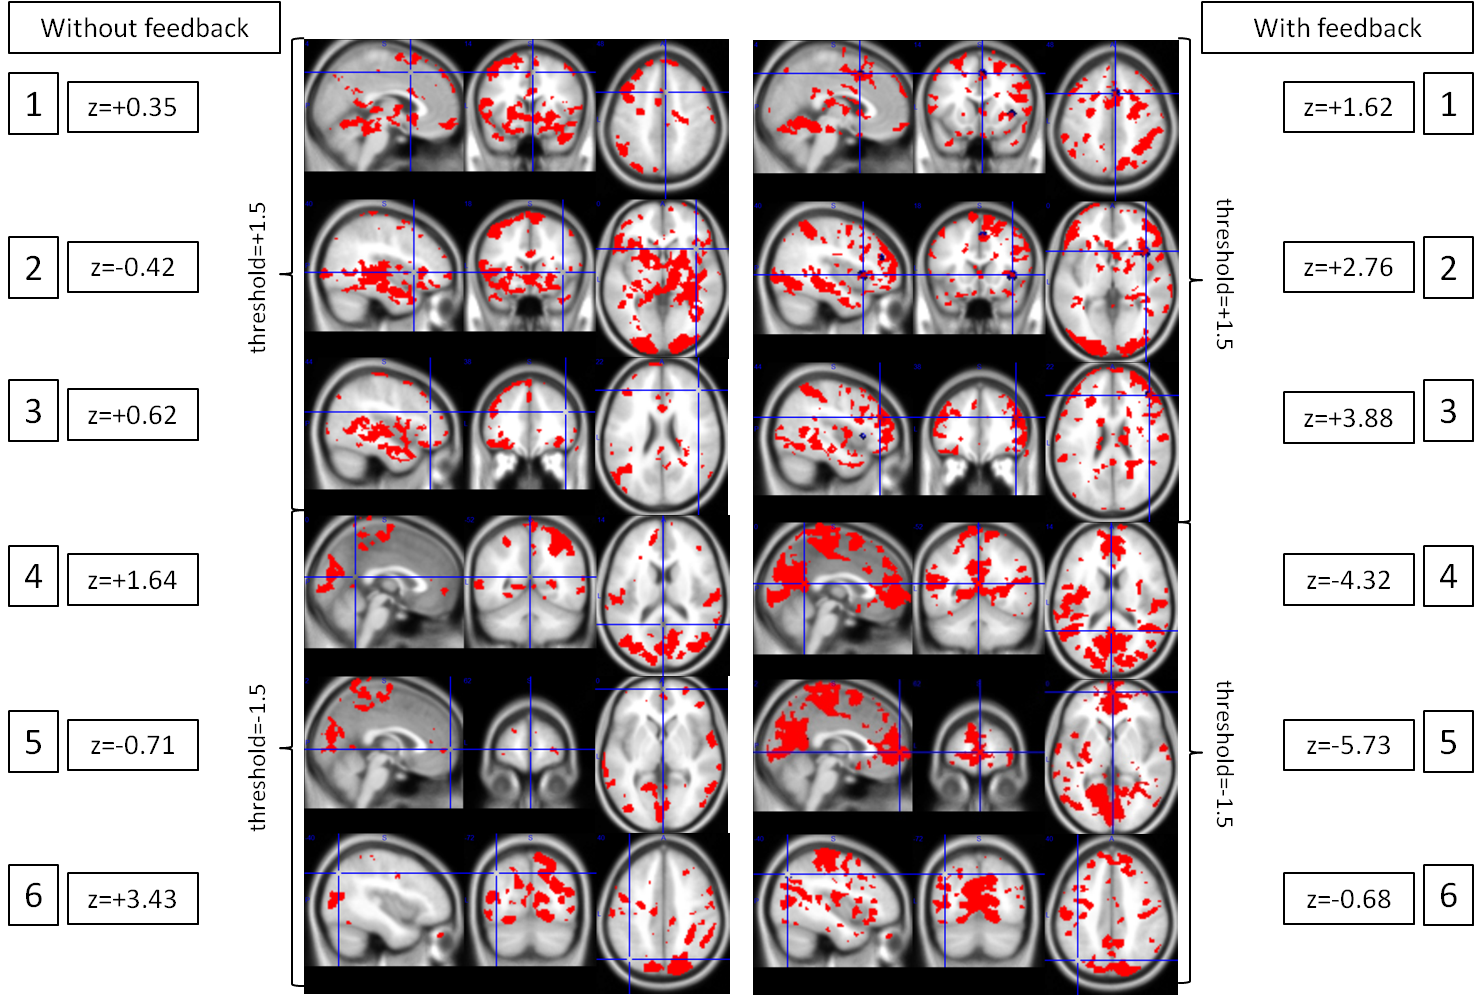
Participants demonstrated capability to regulate the feedback signal (figure 2): all participants showed positive mean correlation (r=0.05-0.26) between real-time processed data and an expected canonical hemodynamic response curve after 9 training runs. However, there is considerable intra-subject variability in differential NF regulation (figure 3), which can be seen even in SAN and DMN correlations to expected curve, revealing changing mechanisms to maintain attentive focus. All participants showed positive correlation for the last no-feedback run (r=0.02-0.39), which may suggest acquired ability after NF training. Whole brain activations during successful regulation run with feedback show both SAN activation and DMN deactivation (figure 4). Behavioral tests results show a tendency of improvement in attention ability (all participants showed improved performance in CPT, 3/4 participants showed improved performance in PVT, TSP, and Stroop), although we have few data to correlate it to NF training.Conclusion
fMRI-NF training results are promising and its application to attention boosting may be verified as more data is acquired.Acknowledgements
Bernd Foerster (Philips), CNPq by grant support, INBRAIN Research Group by personnel support, IDOR (Rio de Janeiro - Brazil) by personnel and instrumental support.References
1. Cox R, Jesmanowicz A, Hyde J. Real-time functional magnetic resonance imaging. Magn Reson Med. 1995;33(2):230–6.
2. Rota G, Sitaram R, Veit R, et al. Self-regulation of regional cortical activity using real-time fMRI: the right inferior frontal gyrus and linguistic processing. Hum Brain Mapp. 2009;30:1605–14.
3. Sulzer J, Haller S, Scharnowski F, et al. Real-time fMRI neurofeedback: Progress and challenges. Neuroimage. 2013;76:386–99.
4. deCharms R, Maeda F, Glover G, et al. Control over brain activation and pain learned by using real-time functional MRI. Proc Natl Acad Sci USA. 2005;102(51):18626–31.
5. Linden D, Habes I, Johnston S, et al. Real-Time Self-Regulation of Emotion Networks in Patients with Depression. PLoS One. 2012;7(6):e38115.
6. Scharnowski F, Hutton C, Josephs O, et al. Improving Visual Perception through Neurofeedback. J Neurosci. 2012;32(49):17830–41.
7. Scharnowski F, Veit R, Zopf R, et al. Manipulating motor performance and memory through real-time fMRI neurofeedback. Biol Psychol. 2015;108:85–97.
8. Langner R, Eickhoff S. Sustaining Attention to Simple Tasks: A Meta-Analytic Review of the Neural Mechanisms of Vigilant Attention. Psychol Bull. 2013;139(4):870–900.
9. Raichle M, MacLeod M, Snyder Z, et al. A default mode of brain function. Proc Natl Acad Sci U S A. 2001;98(2):676–82.
10. Mason M, Norton M, Van Horn J, et al. Wandering Minds: The Default Network and Stimulus-Independent Thought. Science. 2007;315(5810):393–5.
11. Koush Y, Zvyagintsev M, Dyck M, et al. Signal quality and Bayesian signal processing in neurofeedback based on real-time fMRI. Neuroimage. 2012;59(1):478–89.
12. Mueller S, Piper B. The Psychology Experiment Building Language (PEBL) and PEBL Test Battery. J Neurosci Methods. 2014;222:250–9.
13. Hinds O, Ghosh S, Thompson T, et al. Computing moment-to-moment BOLD activation for real-time neurofeedback. Neuroimage. 2011;54(1):361–8.
Figures