4597
Chronic exposure to air pollutants alters the functional network and spatiotemporal dynamics of the resting brain: Graph theory and dynamic functional connectivity analysis.1Psychology, Yonsei University, Seoul, Korea, Republic of, 2Integrative Neurocognitive Functional Imaging Center, Yonsei University, Seoul, Korea, Republic of, 3Cognitive Science Interdisciplinary Program, Yonsei University, Seoul, Korea, Republic of, 4Department of Preventive Medicine, Yonsei University, Seoul, Korea, Republic of, 5Radiology, Yonsei University, Seoul, Korea, Republic of
Synopsis
Detrimental effects of air pollutants on cognitive function are gaining considerable concern. The present study compared high-risk and low-risk group, defined based on the level of exposure to air pollutants, using graph theory-based approach and sliding window correlation analysis. Despite the undifferentiated cognitive functions between the groups, our study demonstrated the changes of the large-scale functional networks and dynamic brain activity of the high-risk group. Thus, our findings provide strong evidence of the influence of chronic high-dose exposure to air pollutants on the neural correlates, and offer new ways to understand the functional neural networks and dynamics.
Purpose
Environmental toxins are increasingly recognized as imminent and considerable concern that impose significant threats on the brain and cognitive function. Although studies focusing on the damaging effect of heavy metals are awash1,2, there is lack of functional magnetic resonance imaging (MRI) studies investigating the detrimental effects of air pollution on functional neural network.Methods
In the study, we recruited 173 participants and ranked them in order of the level of exposure to air pollutants, i.e., particulate matter 10 (PM10) and nitrogen dioxide (NO2), and designated top 57 participants as high-risk group and bottom 57 participants as low-risk group. All participants underwent structural and 6-minute resting-state functional MRI, extensive medical examination, and neuropsychological tests. The study examined (1) the large-scale functional networks using graph theory-based approach3,4, and (2) dynamic functional connectivity (FC) using sliding window correlation analysis5, 6.
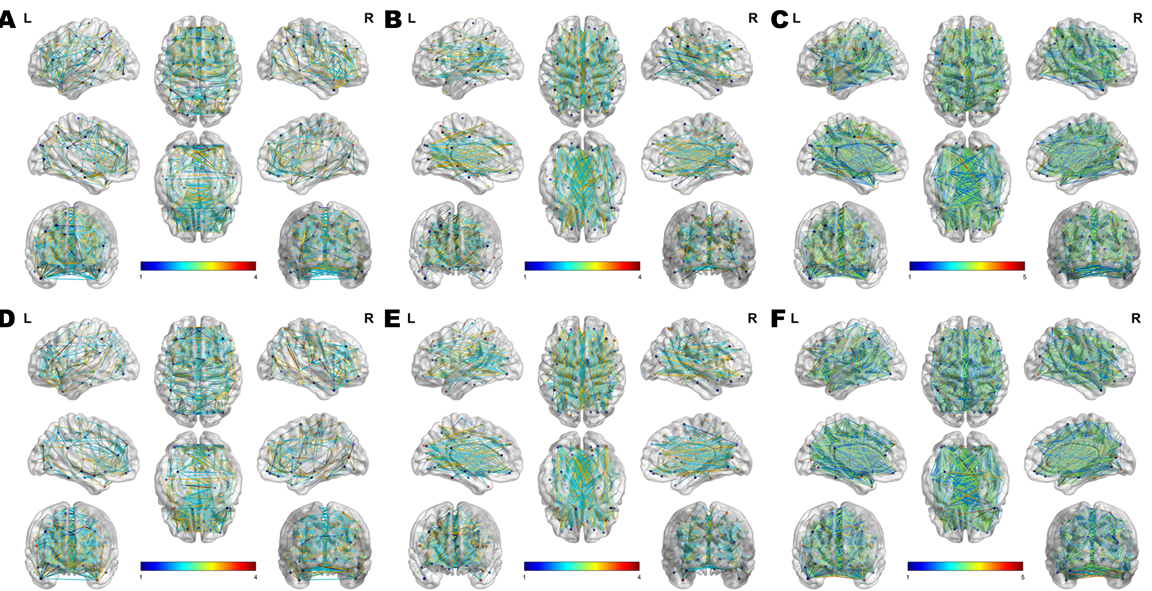
We used two indices that measure the characteristics of dynamic FC: prolonged stability and inconstant fluctuation. Prolonged stability indicates that a series of FCs of a given interregional connection maintains a directionality in either positive or negative manner throughout the scan. In contrast, inconstant fluctuation indicates that FCs alternates between positive and negative range. The level of stability and fluctuation was computed by subtracting the lowest r from the highest r of the series of dynamic FCs for each interregional connection. For the brevity, we are to confine the report to the interregional connections with the prolonged stability below the level of stability of 0.2 and with the inconstant fluctuation above the level of fluctuation of 0.5.
Results
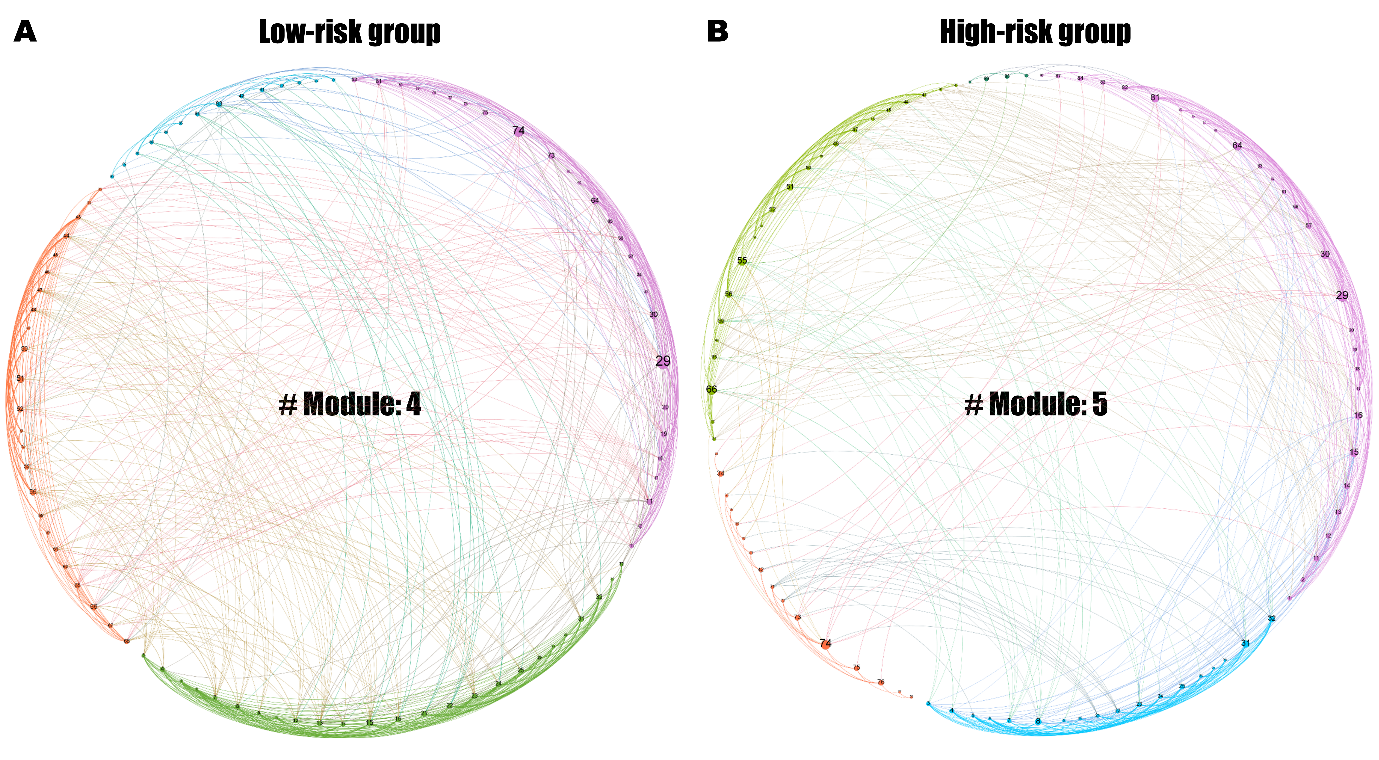
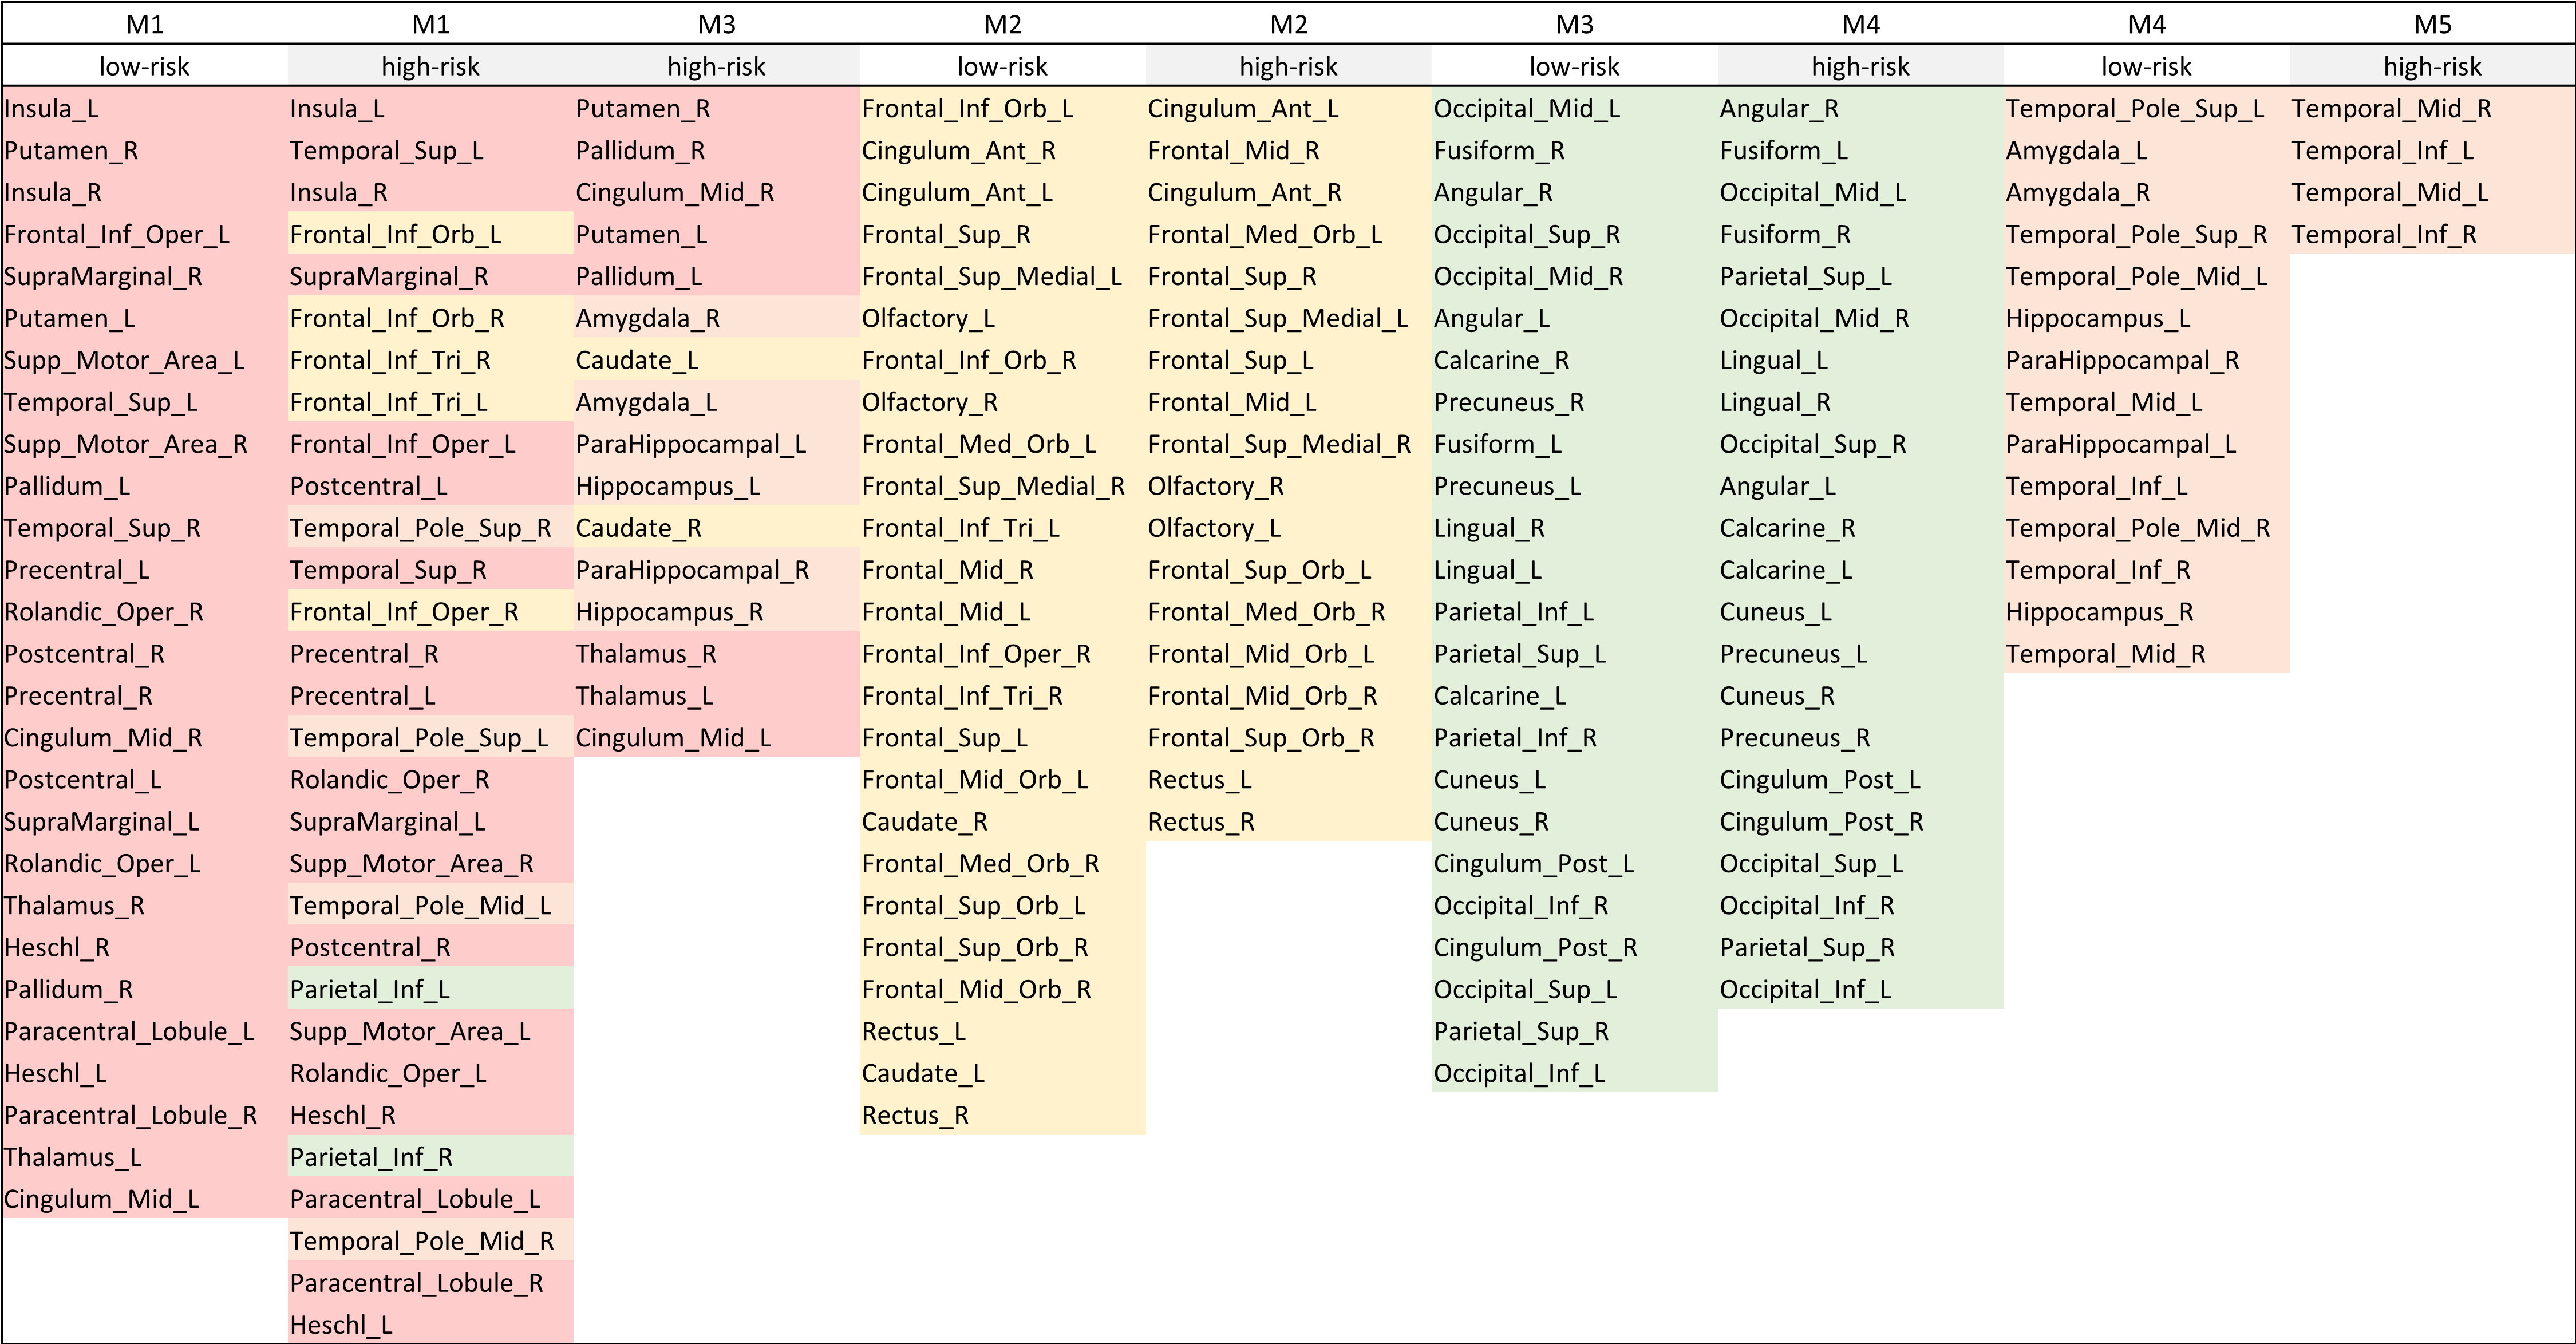
The groups showed no significant demographic and neuropsychologically tested cognitive differences (p > .05). The functional network of the low-risk group was comprised of four modules, and for each module, the left insula, left inferior orbitofrontal cortex (OFC), left middle occipital gyrus, and left superior temporal pole played as a primary hub region, respectively (Fig.1A). The network of the high-risk group had five modules, and the following primary hub region were found for each module: the left insula, left anterior cingulate cortex (CC), right putamen, right angular, and right middle temporal gyrus (Fig.1B).The low-risk group had 40 positively prolonged stability; 12 of them were interhemispheric frontal connections, and 6 were cortical connection mostly with OFC regions. In contrast, the high-risk group had 22 positively prolonged stability; 5 of them were interhemispheric frontal connections, and 1 was the connection between right medial OFC and right rectus. The low-risk group had 9 negatively prolonged stability and 8 of them were cortical connection with occipital regions. The high-risk group had 5 positively negative prolonged stability; most of them was cortical connection with the CC subregions or superior occipital gyrus. In the low-risk group, the inconstant fluctuation was found between the left superior temporal and left olfactory, left insula and left medial superior frontal, and left superior occipital and right rectus. In the high-risk group, the inconstant fluctuation was found between the left SMA and right subregions of basal ganglia, right hippocampus and left lingual gyrus, and left fusiform and left posterior CC.
Discussion
Despite the undifferentiated behavioral functions between the groups, our study showed that brain activities were altered, and provided several novel insights on the changes of brain networks due to the chronic exposure to air pollutants. Although some modules maintained similar members in the both groups, the roles of each regions in the modules were changed. Most of the modules of the low-risk group were divided into smaller modules in the high-risk group indicating that some interregional connections lost the ability to perform efficiently and systematically for a certain function. Moreover, the emergence of a new module with regions from the multiple discrete modules of the low-risk group hinders fast communication between the formerly-closely-connected regions and may discourage the overall cognitive function7.
Reduced number of and changed interregional connections with prolonged stability of the high-risk group may suggest that skeletal connections that hold continuity and primary characteristics of the spontaneous brain activity are modified. Also, change of interregional connections with temporal instability which might work as white noise that boosts functional activity of skeletal connections, as in stochastic resonance, may result in differently modulated network activity over time.
Conclusion
Recent studies revealed the relationship between PM10 and neurodegeneration and neuro-inflammation. Our findings provide strong evidence for influence of chronic high-dose exposure to air pollutants on the neural correlates in various manners. The results offer additional information to understand the functional neural networks and neural dynamics and they are expected to provide better solution in pathogenetic mechanism in neurodegeneration.Acknowledgements
This work was supported by the Korea Ministry of Environment (MOE) under “the Environmental Health Action Program” (grant number 2014001360002).References
1. Yoshida K, Ikeda S, Nakanishi J. Assessment of human health risk of dioxins in Japan. Chemosphere. 2000;40(2):177-85.
2. Liu J, Lewis G. Environmental toxicity and poor cognitive outcomes in children and adults. J Environ Health. 2014;76(6):130-8.
3. Rubinov M, Sporns O. Complex network measures of brain connectivity: uses and interpretations. Neuroimage. 2010;52(3):1059-69.
4. Sporns O. Network attributes for segregation and integration in the human brain. Curr Opin Neurobiol. 2013;23(2):162-71.
5. Hutchison RM, Womelsdorf T, Allen EA, Bandettini PA, Calhoun VD, Corbetta M, et al. Dynamic functional connectivity: promise, issues, and interpretations. Neuroimage. 2013;80:360-78.
6. Shen H, Li Z, Qin J, Liu Q, Wang L, Zeng LL, et al. Changes in functional connectivity dynamics associated with vigilance network in taxi drivers. Neuroimage. 2016;124(Pt A):367-78.
7. Pedersen M, Omidvarnia AH, Walz JM, Jackson GD. Increased segregation of brain networks in focal epilepsy: An fMRI graph theory finding. Neuroimage Clin. 2015;8:536-42.
Figures