4592
Analysis of the network properties of structural brain network of elderly people with obstructive sleep apnea1Department of Biomedical Engineering, Yonsei University, Wonju, Korea, Republic of, 2Department of Radiological Science, Yonsei University, Wonju, Korea, Republic of, 3Institute of Human Genomic Study, College of Medicine, Korea University Ansan Hospital, Ansan, Korea, Republic of, 4Department of Neurology, Seoul National University Bundang Hospital, Seongnam, Korea, Republic of
Synopsis
Obstructive sleep apnea (OSA) is a common and progressive condition that is accompanied by affective, cognitive and autonomic nervous system changes. Recent studies have demonstrated abnormalities in the brains of OSA subjects. However, no study has illustrated alterations in brain structural connectivity caused by OSA. To assess alterations of brain structural connectivity, we constructed a structural brain network from diffusion tensor imaging (DTI) and examined global network properties for control and OSA subjects. OSA subjects showed lower global efficiency, local efficiency and strength. Brain network analysis may improve understanding of global architecture of anatomical connection patterns in OSA.
Purpose
We attempted to verify the changes of structural connection patterns in obstructive sleep apnea (OSA) subjects using brain network analysis.Methods
1. Participants. In this study, we recruited 165 control (age 57.99 ± 6.02) and 135 OSA subjects (age 59.01 ± 5.91). We classified the control and OSA groups using the following criteria: (1) apnea hypopnea index (AHI) higher than 5 were included in OSA group; (2) AHI lower than 5 were included in the control group. The study procedures were approved by the Institutional Review Board of Seoul National University Bundang Hospital and Korea University Ansan Hospital.
2. Data acquisition and pre-processing. All images were acquired using a 1.5T MRI scanner (General Electric, Milwaukee, WI). DTI scanning parameters were as follows: TR = 15000 ms, TE = 93.8 ms, number of diffusion gradients = 15 and b = 1000 s/mm2 following the acquisition of the b0 image. Furthermore, T1-weighted images were obtained with the following parameters: TR = 7.696 ms, TE = 3.372 ms, flip angle = 12˚, slice thickness = 1.6 mm.
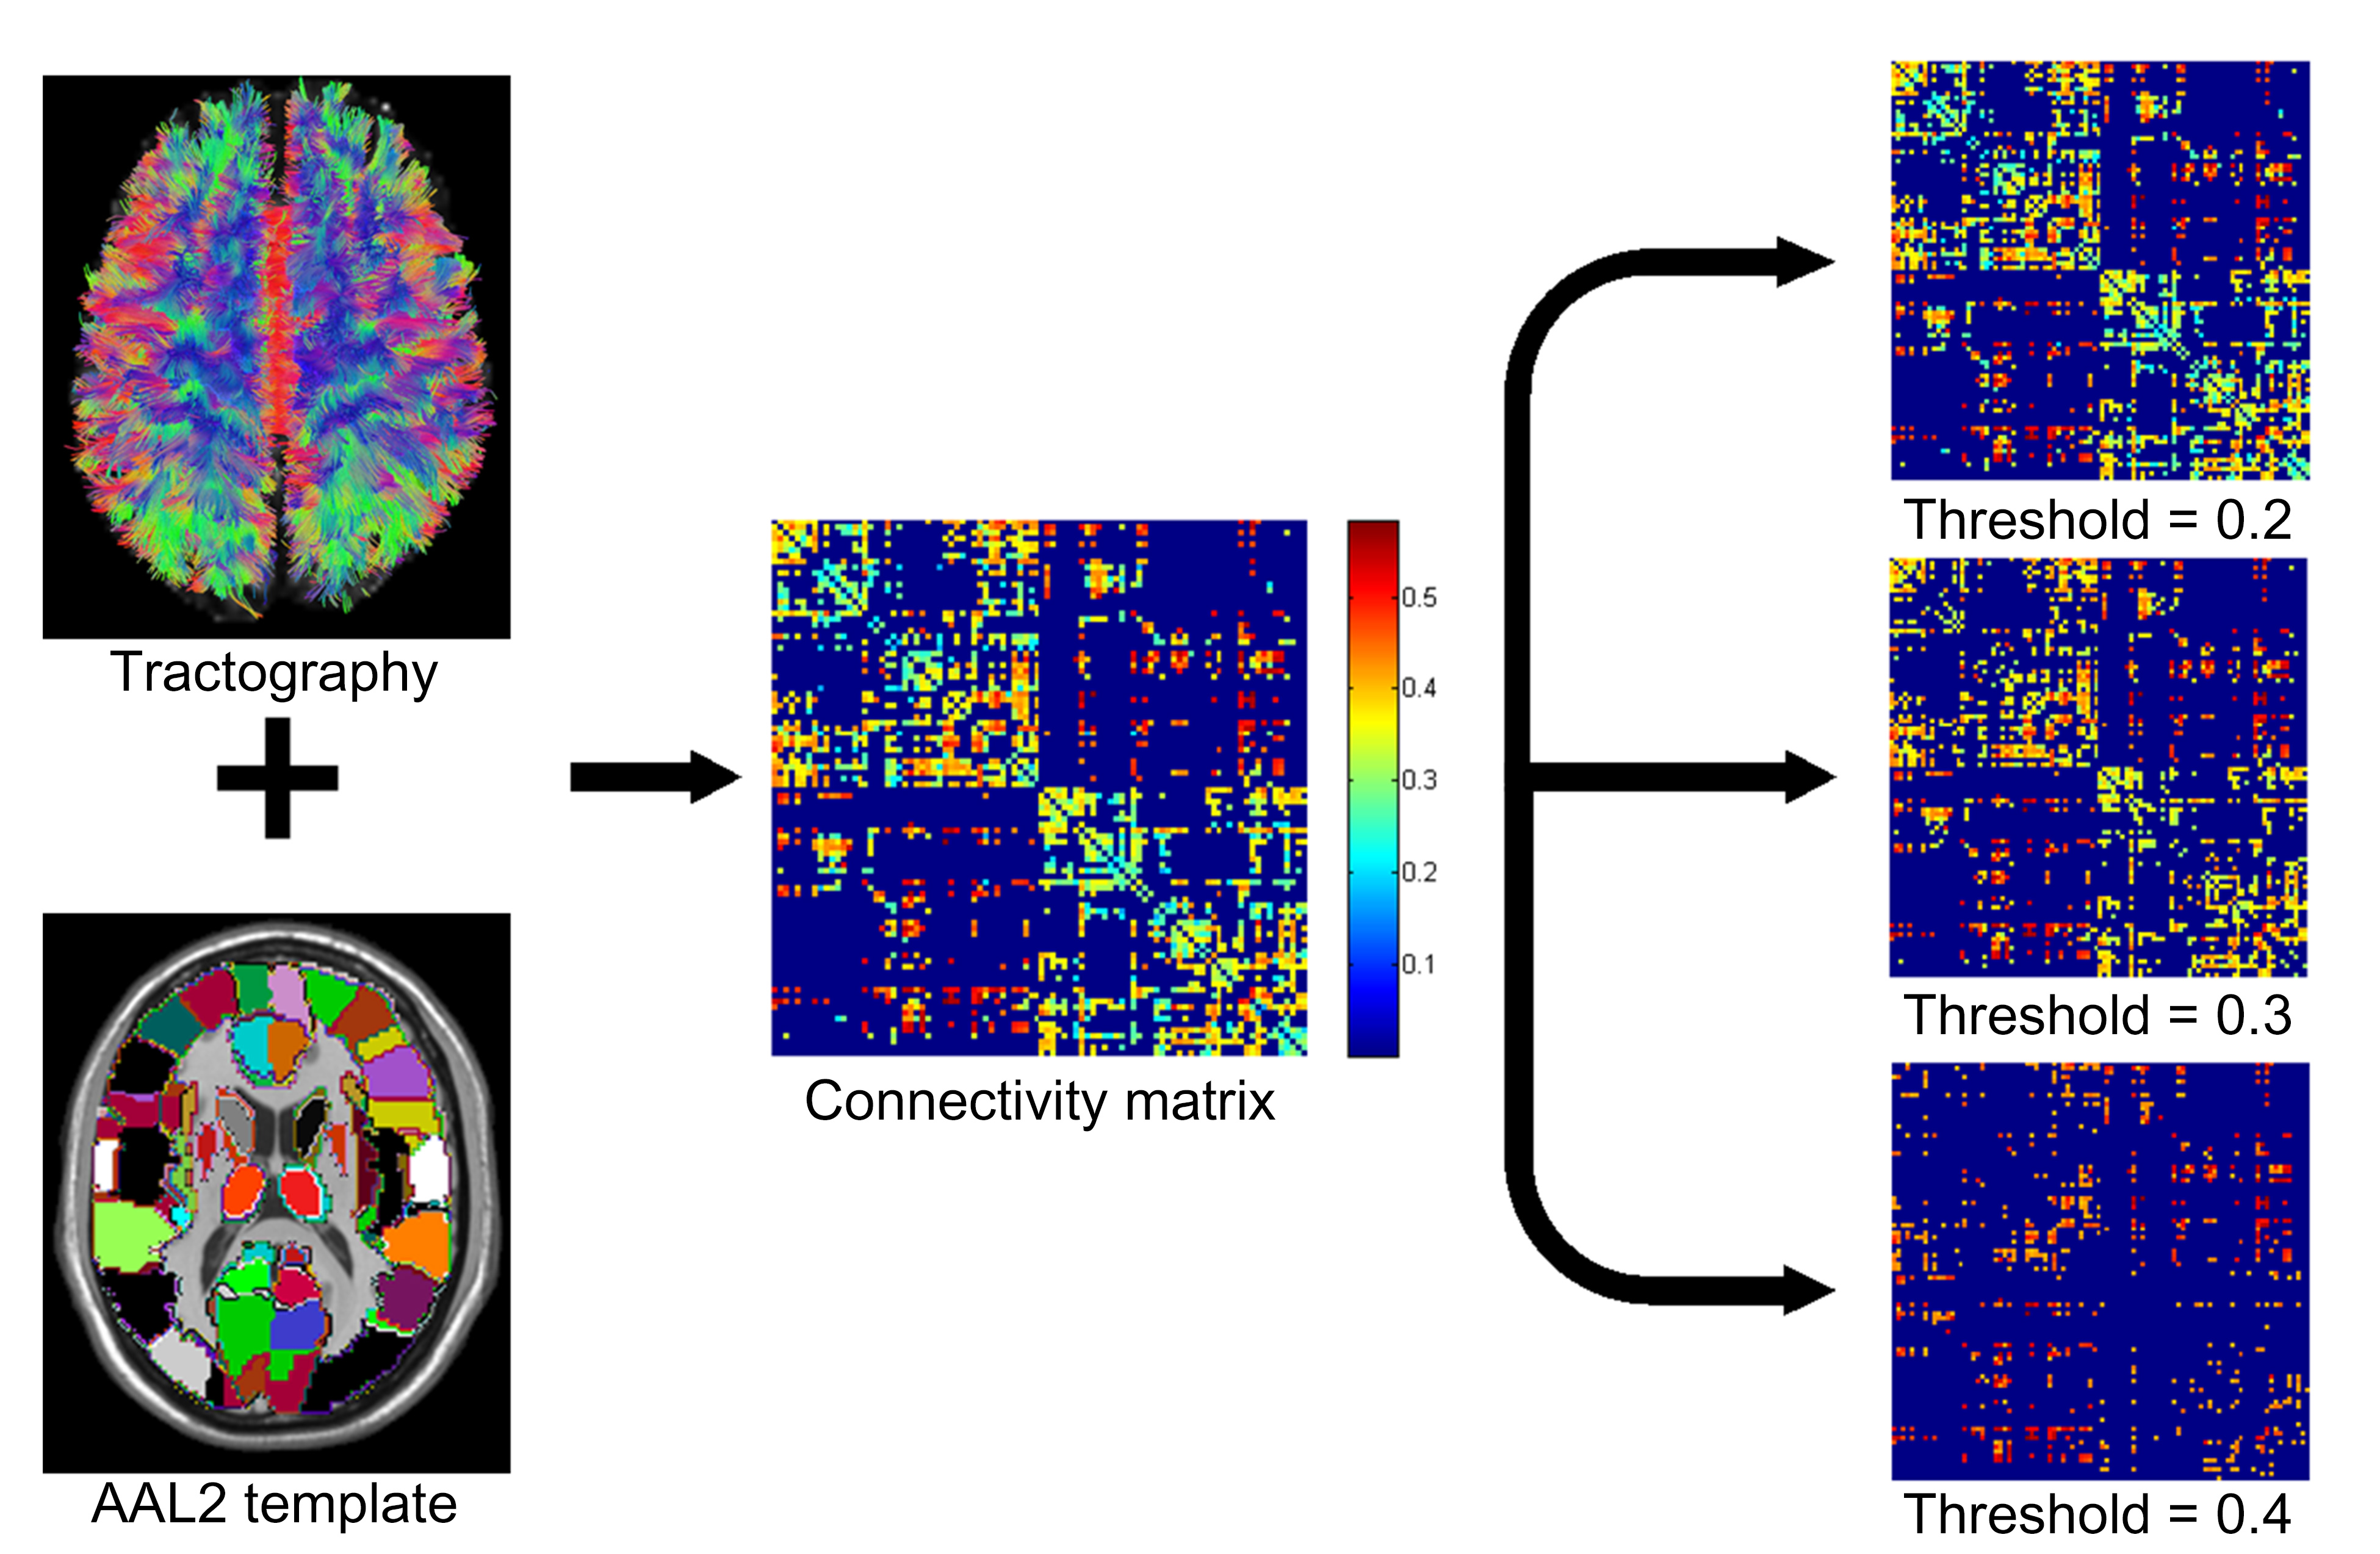
3. Data preprocessing. We corrected distortions caused by eddy currents and head motion by adopting FSL.1 The T1-weighted image of each subject was coregistered to the b0 image using affine transformation. The coregistered T1-weighted image was mapped to the Montreal Neurological Institute space using non-linear transformation and then the transformation parameters were applied to the DTI data using SPM12 (http://www.fil.ion.ucl.ac.uk/spm/software/spm12). We performed tractography to identify anatomical connections with the Euler’s method in DSI studio (http://dsi-studio.labsolver.org).
4. Network Construction. To construct the structural brain network, the parcellation scheme was adopted using the automated anatomical labeling atlas 2 template.2 The cerebrum was parcellated into 94 regions, each representing a node of the brain network. Two nodes were connected by an edge if any endpoints of fiber tract exist in both regions. The weight of each edge was determined by the average value of fractional anisotropy (FA) on all points of tracts which connect two brain regions (Fig. 1).
5. Global properties. We examined the strength, global efficiency and local efficiency as global properties of the network. The strength is defined as sum of weights of connections connected neighbor node and measures the degree of information interaction with other nodes.3 The global efficiency of the brain network measures the efficiency of the parallel information flow in the network4 and reflects integration over the whole network.5 This measure is defined as the inverse of mean path length between any pair of nodes.6 The local efficiency measures the ability of functional segregation and quantifies how well a sub-graph exchanges information.7 This measure is defined as the efficiency of the connections between the nearest neighborhoods of the node.4
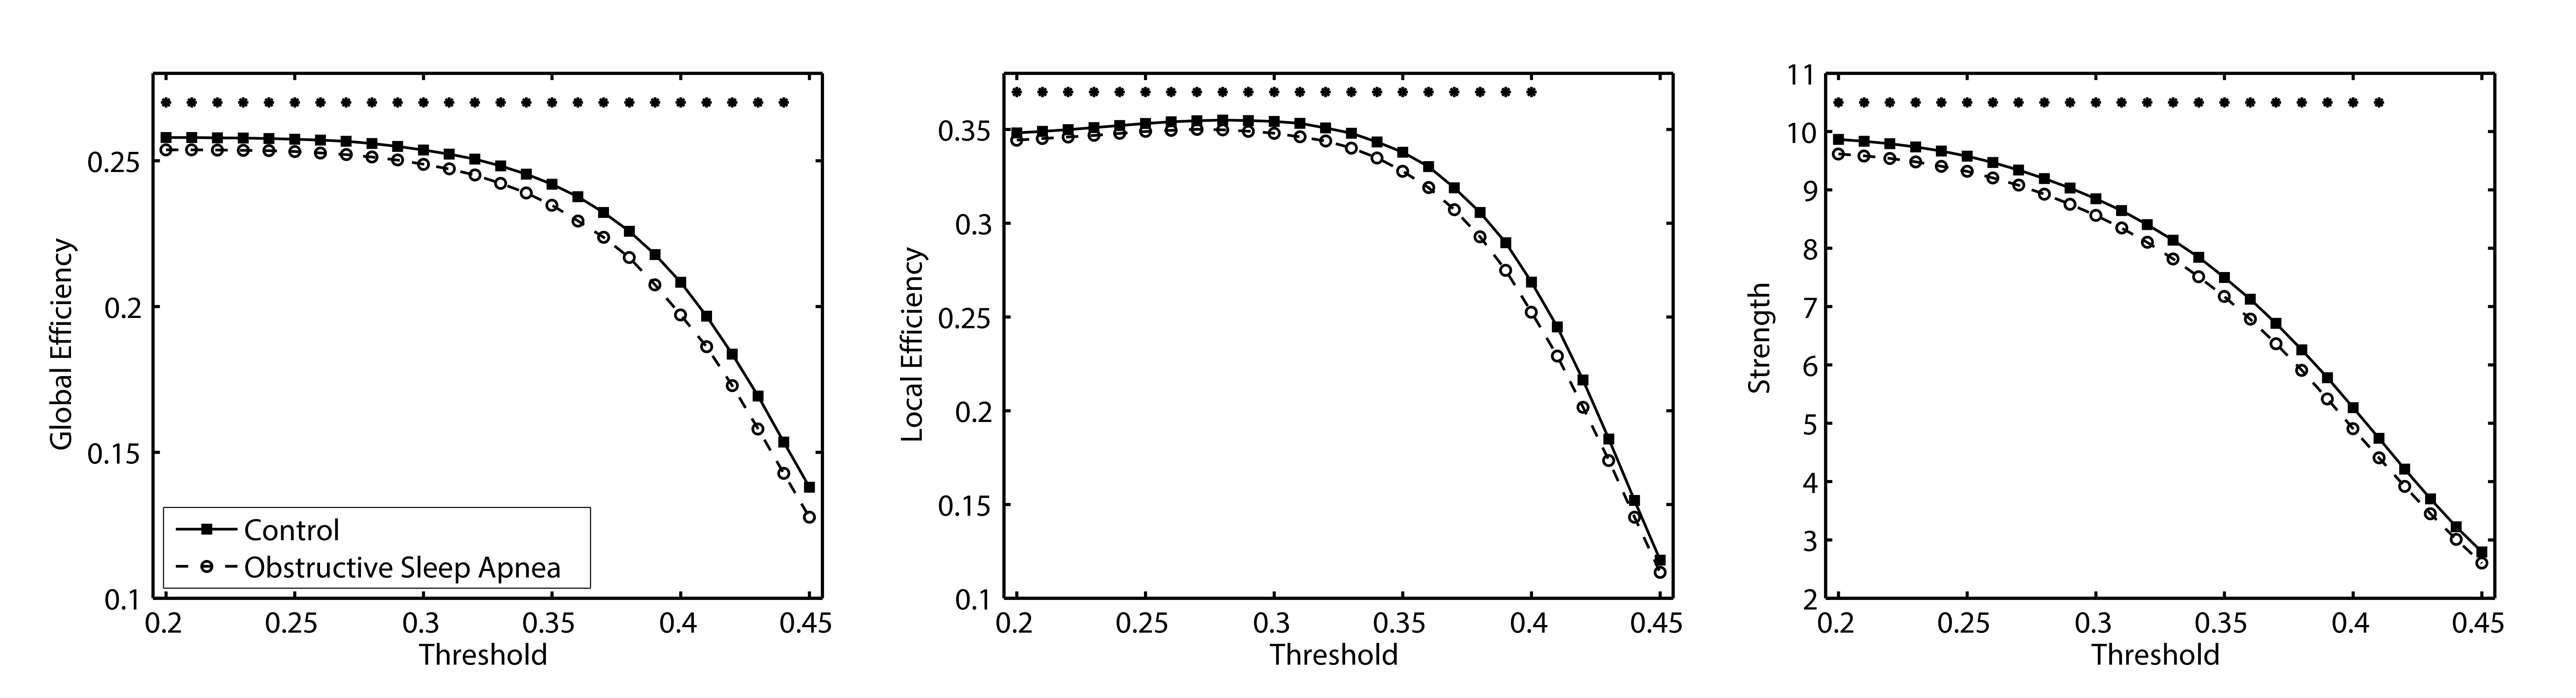
6. Statistical analysis. All network properties were computed over a wide range of FA thresholds (0.2~0.45). Furthermore, to compare the network properties between two groups, we computed the area under curve (AUC) for each network property. It allowed of the precise comparisons of network properties avoiding bias of result due to choice of certain threshold. In this study, to determine the statistical significance we used analysis of covariance (covariate: age, sex, education, drink, smoke, diabetes, and hypertension). A significance level was set at P < 0.05 for all statistical tests.
Results
In this study, we used AUC to determine the significant differences in network properties. OSA subjects showed lower global efficiency (F = 6.3369, P = 0.0124), local efficiency (F = 4.7548, P = 0.0300) and strength (F = 4.6316, P = 0.0322) than control subjects (Fig. 2).Discussion
From the network analysis we verified abnormal global architecture in OSA subjects. In this study, OSA subjects showed lower strength, global efficiency and local efficiency. This finding suggests that the OSA subjects may lack the interaction, integration and segregation of information which is generated multiple brain regions. This can imply that brain connection may affect the injury of brain tissue mismatch of oxygen demand and supply to brain tissues due to OSA.8Conclusion
In this study, we performed network analysis based on DTI data to examine altered brain connectivity in OSA subjects. The changes which are hardly visible with standard structural MRI were found in the network analysis for OSA subjects. Brain network analysis is useful to measure abnormal connections in the human brain in neurological or psychiatric disorders.6Acknowledgements
This research was supported by the Brain Research Program through the National Research Foundation of Korea (NRF) funded by the Ministry of Science, ICT & Future Planning (2016M3C7A1905385).References
1. Jenkinson M, Beckmann CF, Behrens TE, et al. Fsl. Neuroimage. 2012;62:782-790.
2. Rolls ET, Joliot M, Tzourio-Mazoyer N. Implementation of a new parcellation of the orbitofrontal cortex in the automated anatomical labeling atlas. Neuroimage. 2015;122:1-5.
3. Qin J, Wei M, Liu H, et al. Altered anatomical patterns of depression in relation to antidepressant treatment: Evidence from a pattern recognition analysis on the topological organization of brain networks. J Affect Disord. 2015;180:129-137.
4. Latora V, Marchiori M. Efficient Behavior of Small-World Networks. Phys Rev Lett. 2001;87(19):198701.
5. Lawrence AJ, Chung AW, Morris RG, et al. Structural network efficiency is associated with cognitive impairment in small-vessel disease. Neurology. 2014;83:304-311.
6. Rubinov M, Sporns O. Complex network measures of brain connectivity: Uses and interpretations. Neuroimage. 2010;52(3):1059-1069.
7. Bullmore ET, Bassett DS. Brain graphs: graphical models of the human brain connectome. Annu Rev Clin Psychol. 2011;7:113-140.
8. Kumar R, Pham TT, Macey PM, et al. Abnormal myelin and axonal integrity in recently diagnosed patients with obstructive sleep apnea. Sleep. 2014;37(4):723-732.
Figures