4591
Differentiation of Functional Activity within the Thalamus during Rest and Visual Task1Dep. of Magnetic Resonance, Max Planck Institute for Biological Cybernetics, Tuebingen, Germany
Synopsis
The presented study explores the capability of high resolution functional MRI (fMRI) at 9.4 Tesla to study functional changes in the primary visual cortex and the human thalamus during rest and natural picture viewing. We found increased intrinsic thalamic connectivity during both eyes open (EO) and eyes closed (EC) condition in the viewing task compared to rest.
Introduction
Alpha
waves in the range of 7.5-12.5 Hz1 play an important role in visual perception
and processing2. EEG studies have shown that variations in
the alpha rhythm are most prominent3 when subjects change visual perception
from eyes open (EO) to eyes closed (EC) condition. As the visual input to the
cortex is driven by lateral geniculate
nucleus (LGN), changes in alpha power suggests that the EEG activity is
mediated by the thalamus4–6.
However,
the functional relationship between the thalamus and visual cortex is still
under investigations. A number of studies
comparing BOLD and alpha activity have yielded inconsistent results with
positive, negative or no correlations7–15. Using
resting state fMRI (rsfMRI) and ICA analysis it has been shown that the visual cortex and thalamus share at least one
functional component with a similar positive time course16. In
addition, correlation between seed regions in the visual cortex and
other cortical areas were repeatedly observed17–23. However, no significant correlation was found between the thalamus and the primary
visual cortex.
In this study,
we want to explore the capability of high resolution fMRI at ultra-high-field
to study changes in the spontaneous brain activity using rsfMRI as well as by
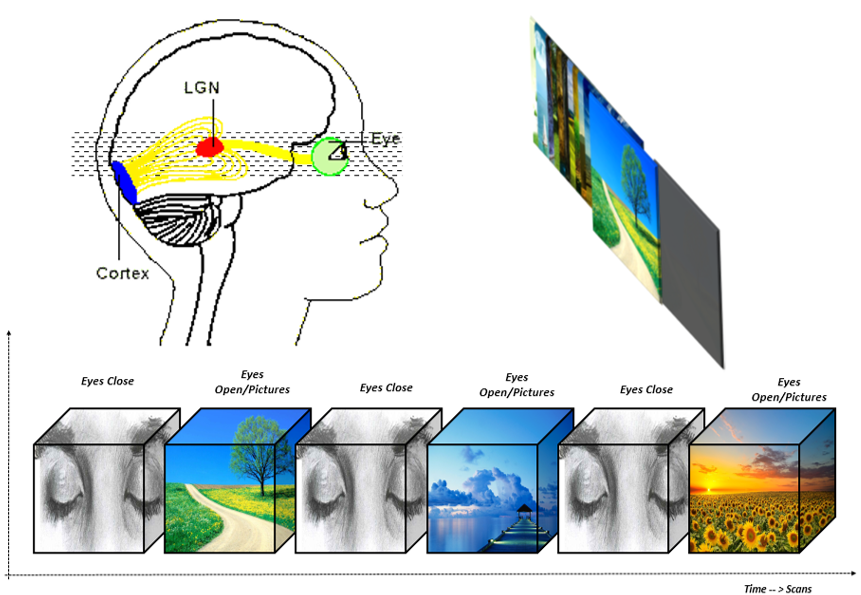
applying a natural viewing picture task with EC and EO condition (s. Fig. 1).Methods
fMRI Acquisition: The data acquisition was performed at 9.4 T Siemens (Erlangen, Germany). A modified distortion corrected EPI sequence with 22 slices, TR of 2 sec., 0.9 mm isotropic resolution, and 20 scans were acquired covering the thalamus and part of visual cortex in 6 right-handed male subjects (age 26-34 years).
rsfMRI and Task: First, a rsfMRI session was performed under EC condition (acquisition time 6.73 min). The consecutive visual task last for one minute and contained different 12 natural landscape pictures each appearing for 5 second. The visual task started with EC condition, and the volunteers were instructed by the inflation of an air balloon in their right hand to open the eyes and to close their eyes at the end of the block (s. Fig. 1). In total 3 blocks of EC and 3 blocks EO were acquired in the visual task. The task paradigm was designed by using the Presentation software®.
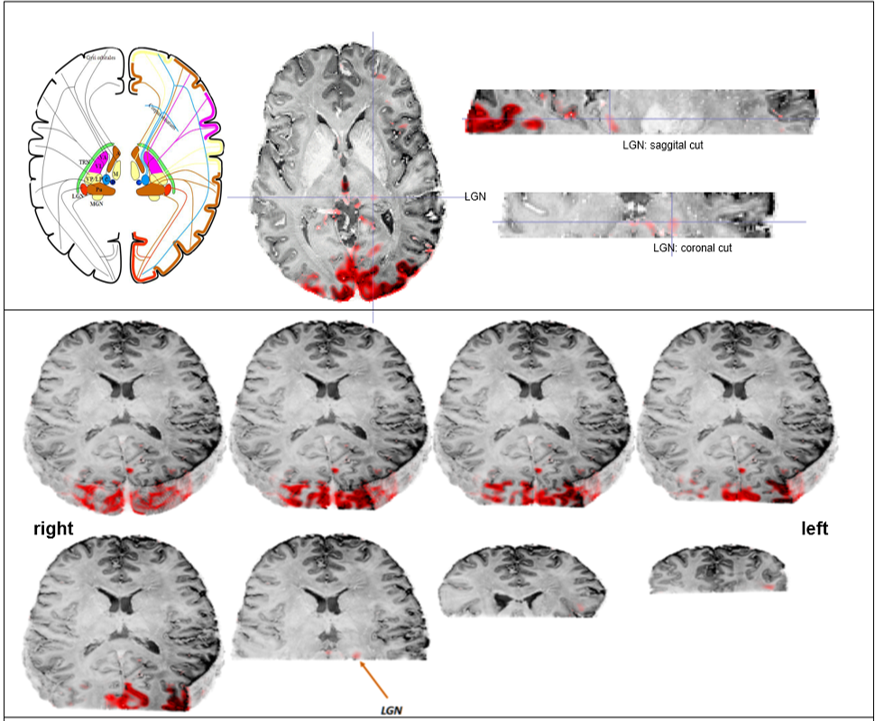
fMRI Analysis: fMRI data were distortion and motion corrected. A visual inspection of the motion correction data was done, and smoothing with a 3 mm kernel was applied. Skull extraction was performed using the Mean EPI image mask to remove voxels outside the brain. The GLM Bayesian-I model was used to calculate the task activation maps (s. Fig. 2).
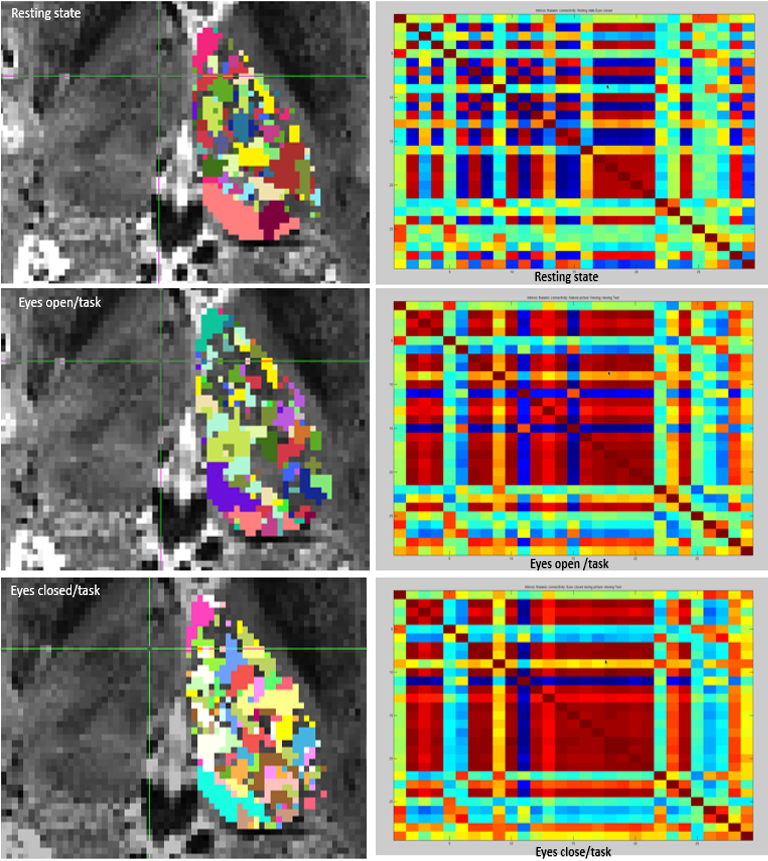
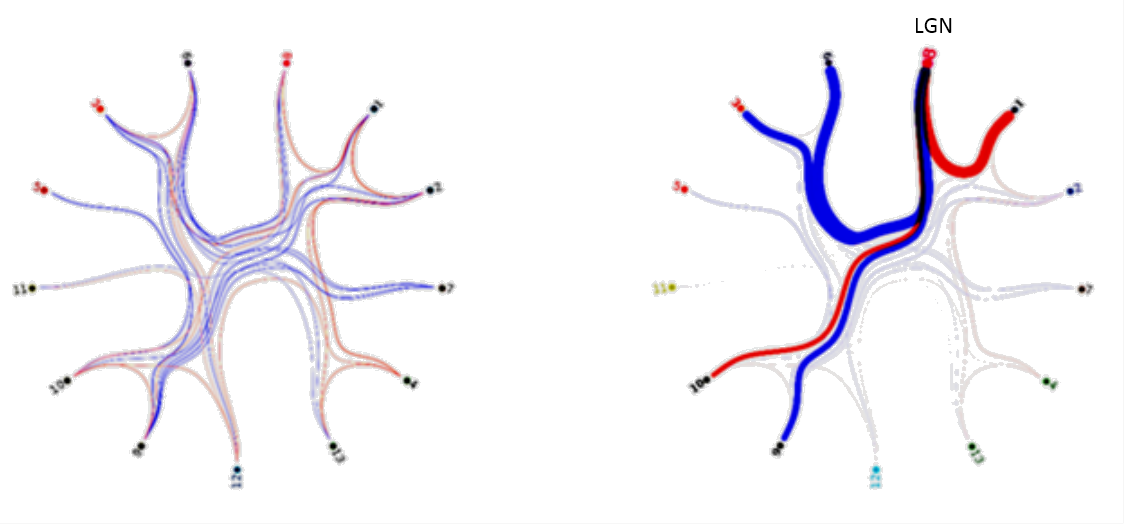
ICA Analysis: 29 sub-compartments in both thalami were obtained using a probabilistic-ICA16. Session specific ICA parcellations reveal intrinsic spatio-temporal correlations but also variability in their spatial configuration and location during different conditions (s. Fig. 3). Session-specific parcellated (nodes x nodes) time course matrices were used for functional connectivity analysis (s. Fig. 3). The session-specific sets of node time series were calculated using dual regression of the resting state ICA clusters to calculate network consistency, hierarchy and pairwise causality using FSL (s. Fig. 4).
Results
The GLM analysis of EO minus EC during the task revealed activations in the primary visual cortex, as well as in the left lateral geniculate nucleus (LGN) (Fig. 2). To detect interthalamic communication during rest, EO and EC condition, we performed an ICA with dimensionality of 29 and extracted their time courses for rest, picture viewing task and eyes close during task session and calculated correlation between every node of the time series (Fig. 3). This intrinsic thalamic connectivity displayed weaker connections with a lower number of correlated nodes at rest and stronger connectivity during the EO and EC task condition. An estimation of the effective intrathalamic connectivity revealed enhanced communication during the visual task suggesting that the LGN communicates to other thalamic nuclei in enabling visual picture processing (Fig. 4).Discussion and Conclusion
We found activation in the primary visual cortex and the left LGN during picture viewing task as reported by several other visual studies. The human thalamus maintains recurrent cortical dynamics during rest and relays information to the cortical areas during task and therefore exhibits a distinct different interconnectivity profile during rest and task. This stronger thalamic-interconnectivity modulation during task might not be only due to visual perception, but can also be caused by an enhanced information flow during cognitive and awareness processing. Probably such thalamic integration is essential and therefore, the LGN displayed effective connectivity with other thalamic parcels.Acknowledgements
This work was supported by the German research council (DFG) Grant GZ: GR 833/11-1.References
1. Gerrard, P. & Malcolm, R. Mechanisms of modafinil: A review of current research. Neuropsychiatr. Dis. Treat. 3, 349–364 (2007).
2. Palva, S. & Palva, J. M. New vistas for α-frequency band oscillations. Trends Neurosci. 30, 150–158 (2007).
3. da Silva, F. H., van Lierop, T. H., Schrijer, C. F. & van Leeuwen, W. S. Organization of thalamic and cortical alpha rhythms: spectra and coherences. Electroencephalogr. Clin. Neurophysiol. 35, 627–639 (1973).
4. Purpura, D. P. Physiological basis of the alpha rhythm. Electroencephalogr. Clin. Neurophysiol. 27, 222–223 (1969).
5. Lopes da Silva, F. H., Vos, J. E., Mooibroek, J. & Van Rotterdam, A. Relative contributions of intracortical and thalamo-cortical processes in the generation of alpha rhythms, revealed by partial coherence analysis. Electroencephalogr. Clin. Neurophysiol. 50, 449–456 (1980).
6. Morison, R. S. & Bassett, D. L. Electrical Activity of the Thalamus and Basal Ganglia in Decorticate Cats. J. Neurophysiol. 8, 309–314 (1945).
7. Danos, P., Guich, S., Abel, L. & Buchsbaum, M. S. Eeg alpha rhythm and glucose metabolic rate in the thalamus in schizophrenia. Neuropsychobiology 43, 265–272 (2001).
8. Feige, B. et al. Cortical and subcortical correlates of electroencephalographic alpha rhythm modulation. J. Neurophysiol. 93, 2864–2872 (2005).
9. Goldman, R. I., Stern, J. M., Engel, J. & Cohen, M. S. Simultaneous EEG and fMRI of the alpha rhythm. Neuroreport 13, 2487–2492 (2002).
10. Moosmann, M. et al. Correlates of alpha rhythm in functional magnetic resonance imaging and near infrared spectroscopy. NeuroImage 20, 145–158 (2003).
11. Sadato, N. et al. Neural networks for generation and suppression of alpha rhythm: a PET study. Neuroreport 9, 893–897 (1998).
12. Larson, C. L. et al. Relations between PET-derived measures of thalamic glucose metabolism and EEG alpha power. Psychophysiology 35, 162–169 (1998).
13. Lindgren, K. A. et al. Thalamic metabolic rate predicts EEG alpha power in healthy control subjects but not in depressed patients. Biol. Psychiatry 45, 943–952 (1999).
14. Schreckenberger, M. et al. The thalamus as the generator and modulator of EEG alpha rhythm: a combined PET/EEG study with lorazepam challenge in humans. NeuroImage 22, 637–644 (2004).
15. Laufs, H. et al. EEG-correlated fMRI of human alpha activity. NeuroImage 19, 1463–1476 (2003).
16. Beckmann, C. F., DeLuca, M., Devlin, J. T. & Smith, S. M. Investigations into resting-state connectivity using independent component analysis. Philos. Trans. R. Soc. Lond. B. Biol. Sci. 360, 1001–1013 (2005).
17. Cordes, D. et al. Mapping functionally related regions of brain with functional connectivity MR imaging. AJNR Am. J. Neuroradiol. 21, 1636–1644 (2000).
18. Cordes, D. et al. Frequencies contributing to functional connectivity in the cerebral cortex in ‘resting-state’ data. AJNR Am. J. Neuroradiol. 22, 1326–1333 (2001).
19. Kiviniemi, V. et al. Slow vasomotor fluctuation in fMRI of anesthetized child brain. Magn. Reson. Med. Off. J. Soc. Magn. Reson. Med. Soc. Magn. Reson. Med. 44, 373–378 (2000).
20. Kiviniemi, V., Kantola, J.-H., Jauhiainen, J. & Tervonen, O. Comparison of methods for detecting nondeterministic BOLD fluctuation in fMRI. Magn. Reson. Imaging 22, 197–203 (2004).
21. Lowe, M. J., Mock, B. J. & Sorenson, J. A. Functional connectivity in single and multislice echoplanar imaging using resting-state fluctuations. NeuroImage 7, 119–132 (1998).
22. Tian, L. et al. Stabilities of negative correlations between blood oxygen level-dependent signals associated with sensory and motor cortices. Hum. Brain Mapp. 28, 681–690 (2007).
23. Stein, T. et al. Functional Connectivity in the Thalamus and Hippocampus Studied with Functional MR Imaging. Am. J. Neuroradiol. 21, 1397–1401 (2000).
Figures