4590
Vascular-metabolic and GABAergic inhibitory modulation of neural variability. A combined fMRI and PET study1Guangdong Key Laboratory of Mental Health and Cognitive Science, South China Normal University, Guangzhou, People's Republic of China, 2Brain and Consciousness Research Centre, Taipei Medical University-Shuang Ho Hospital, New Taipei City, Taiwan, 3Department of Radiology, Taipei Medical University - Shuang Ho Hospital, New Taipei City, Taiwan, 4Mind, Brain Imaging and Neuroethics Research Unit, Institute of Mental Health Research, University of Ottawa, Ottawa, Canada, 5GE Healthcare, Taipei, Taiwan, 6GE Healthcare MR Research China, Beijing, People's Republic of China, 7Applied Emotion and Motivation Research, Institute for Psychology and Education, Universität Ulm, Ulm, Germany, 8Department of Nuclear Medicine, Shuang-Ho Hospital, Taipei Medical University, New Taipei City, Taiwan, 9Brain and Mind Research Institute, Centre for Neural Dynamics, Faculty of Medicine, University of Ottawa, Ottawa, Canada
Synopsis
We sought to investigate the mechanism involved in temporal variability (TV) changes between two basic behavioral states, namely having the eyes open (EO) or eyes closed (EC). The aim of this study was to use the change between the EC and EO states to identify the potential mechanisms involved in TV modulation.
Purpose
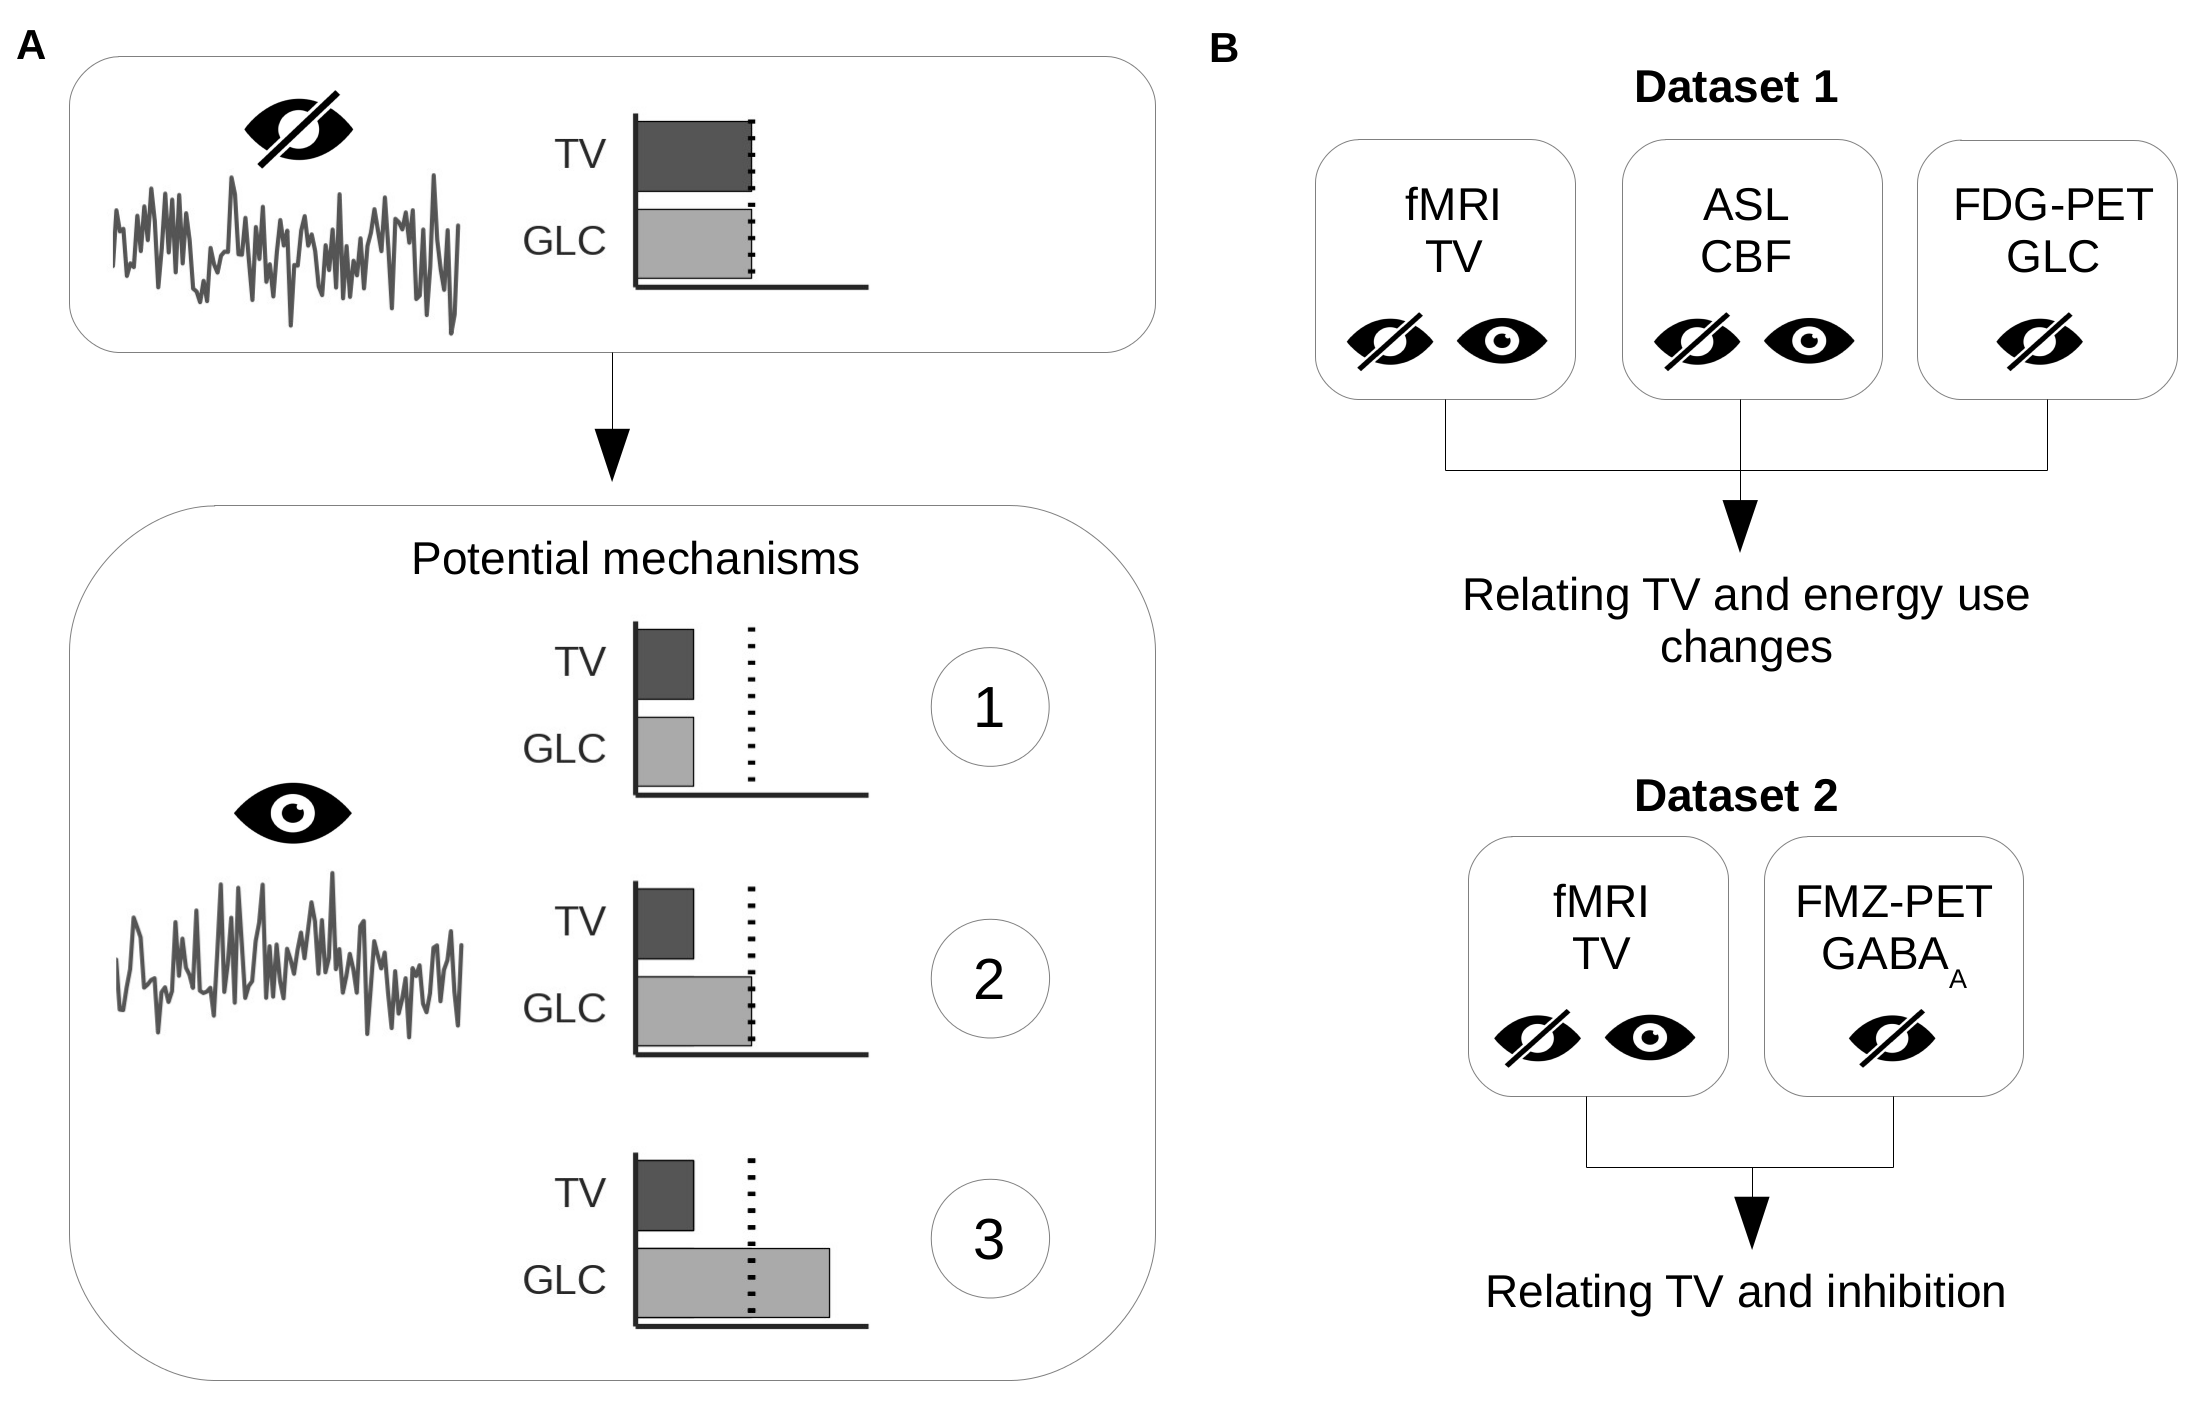
Neural activity varies continually from moment to moment. Such temporal variability (TV) has been highlighted as a functionally specific brain property playing a fundamental role in cognition. We sought to investigate the mechanism involved in TV changes between two basic behavioral states, namely having the eyes open (EO) or eyes closed (EC). The first aim of this study was thus to use the change between the EC and EO states to identify the potential mechanisms involved in TV modulation. We hypothesized that changes in TV between EC and EO would be negatively correlated with cerebral blood flow (CBF) changes. Further specification of the potential mechanisms of TV modulation requires information about the particular neural systems involved. Across the cortex, overall neural activity is primarily a balance between excitatory glutamatergic and inhibitory GABAergic activity1. We can therefore hypothesise that modulation of TV in this region occurs, at least in part, through the action of the GABAergic system (in combination with a stimulus-induced change in excitatory activity) (Figure 1A).Method
MR images were acquired on a GE MR750 3 Tesla scanner using a standard 8-channel head coil. A high-resolution T1-weighted anatomical image was acquired first. Following this, the blood-oxygen level dependent (BOLD) and CBF imaging was carried out, with the order of these scans counterbalanced across participants. EO and EC runs were carried out for both BOLD and CBF. The EO/EC orders for BOLD and CBF were also counterbalanced across participants. The lights in the scanner room were turned off during scanning. During both types of scans, participants were instructed to lie still, to stay awake, and to not focus their attention on anything in particular. In EC runs the participants kept their eyes closed throughout and a black screen was presented to ensure that they were exposed to little light. During EO runs a grey screen was presented. In these runs participants were instructed to keep their eyes open and to look towards the screen. Participants were asked after scanning if they had remained awake; none reported falling asleep. BOLD fMRI was used to quantify TV while [18F]-fluoro-deoxyglucose PET (FDG-PET) was used as the primary measure of glucose consumption (GLC) in a group of healthy participants (n = 17). Cerebral blood flow (CBF), as measured with arterial spin labeling (ASL), was used as an additional measure of energy consumption due to the coupling between CBF and glucose uptake in the same group2. For the second aim, we utilized [18F]-flumazenil PET (FMZ-PET) data as a measure of GABAA receptors3, along with BOLD fMRI data from the same participants to quantify TV in a separate group (n = 27) (Figure 1B).Result
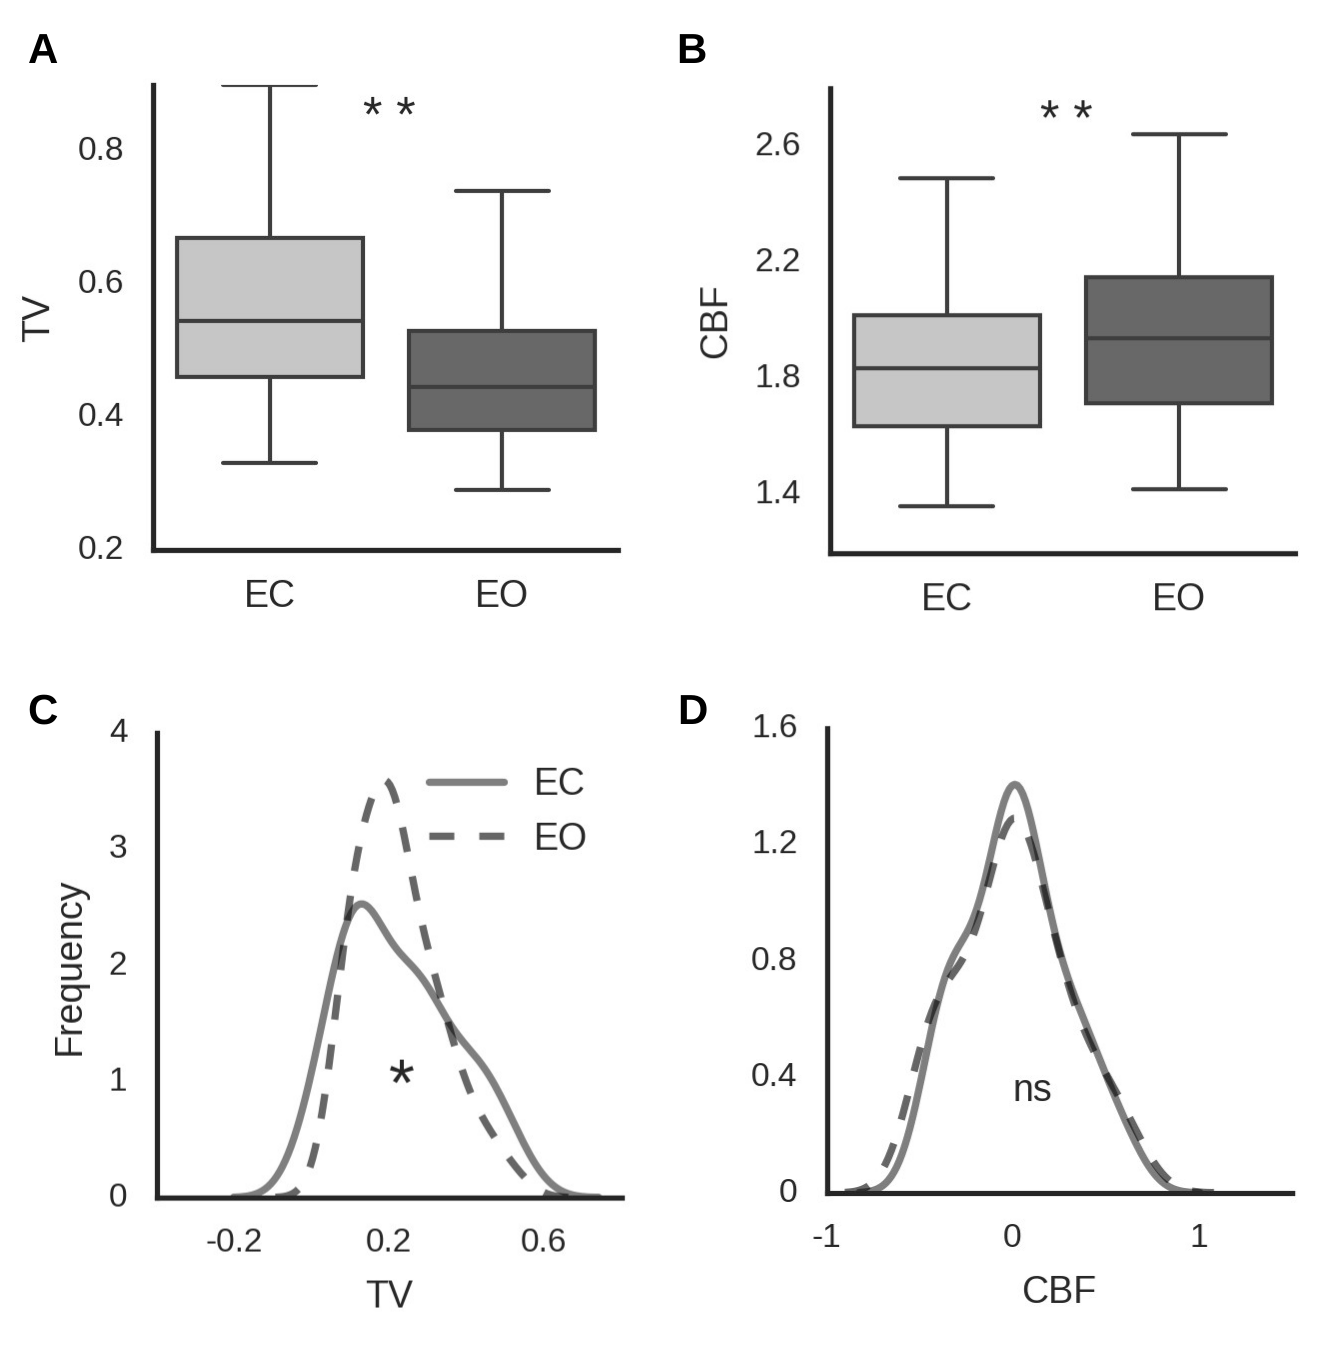
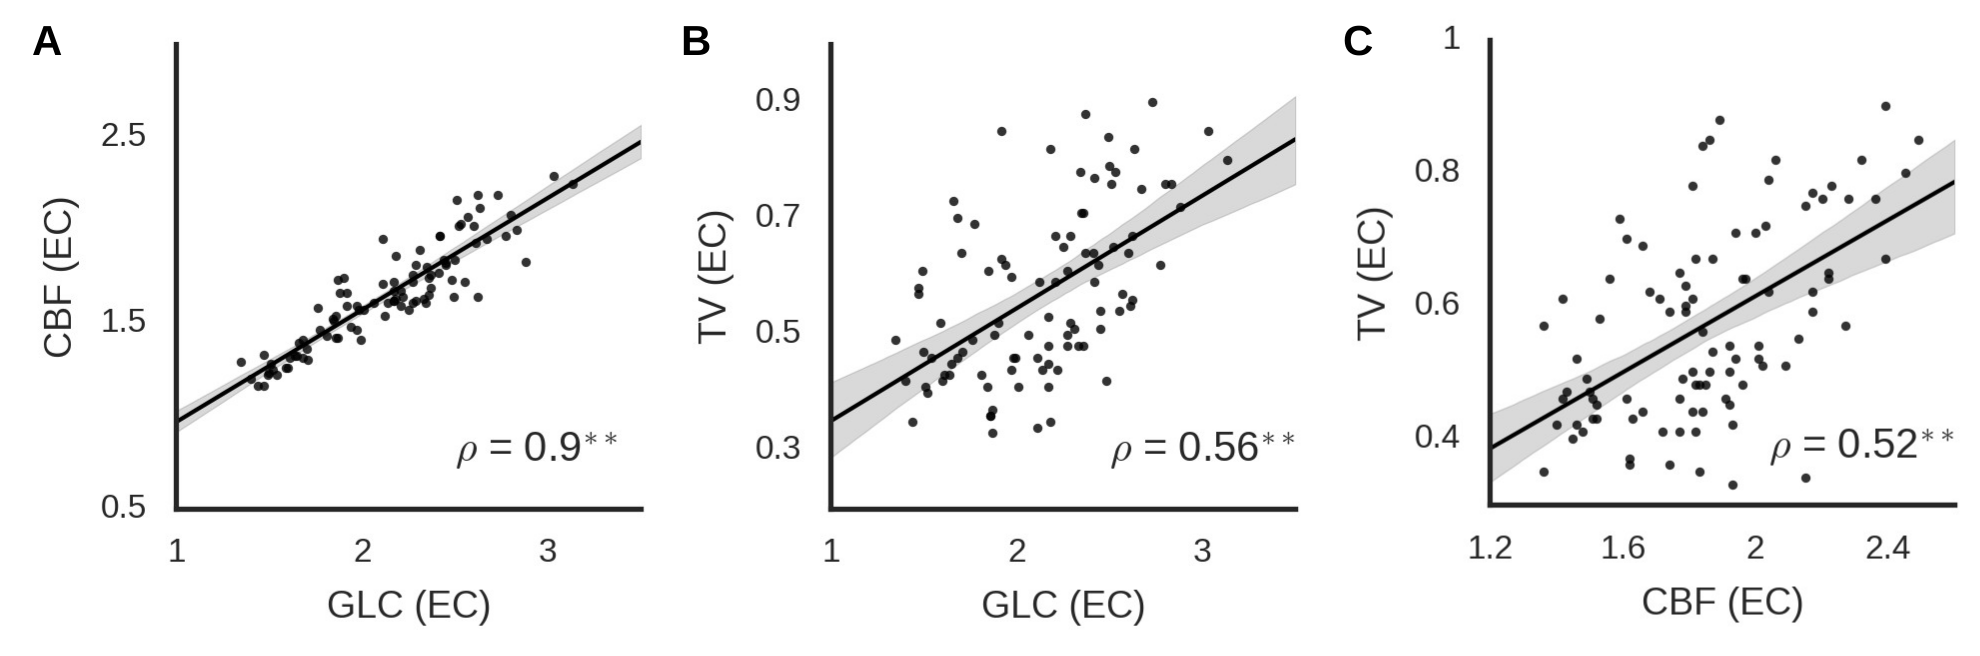
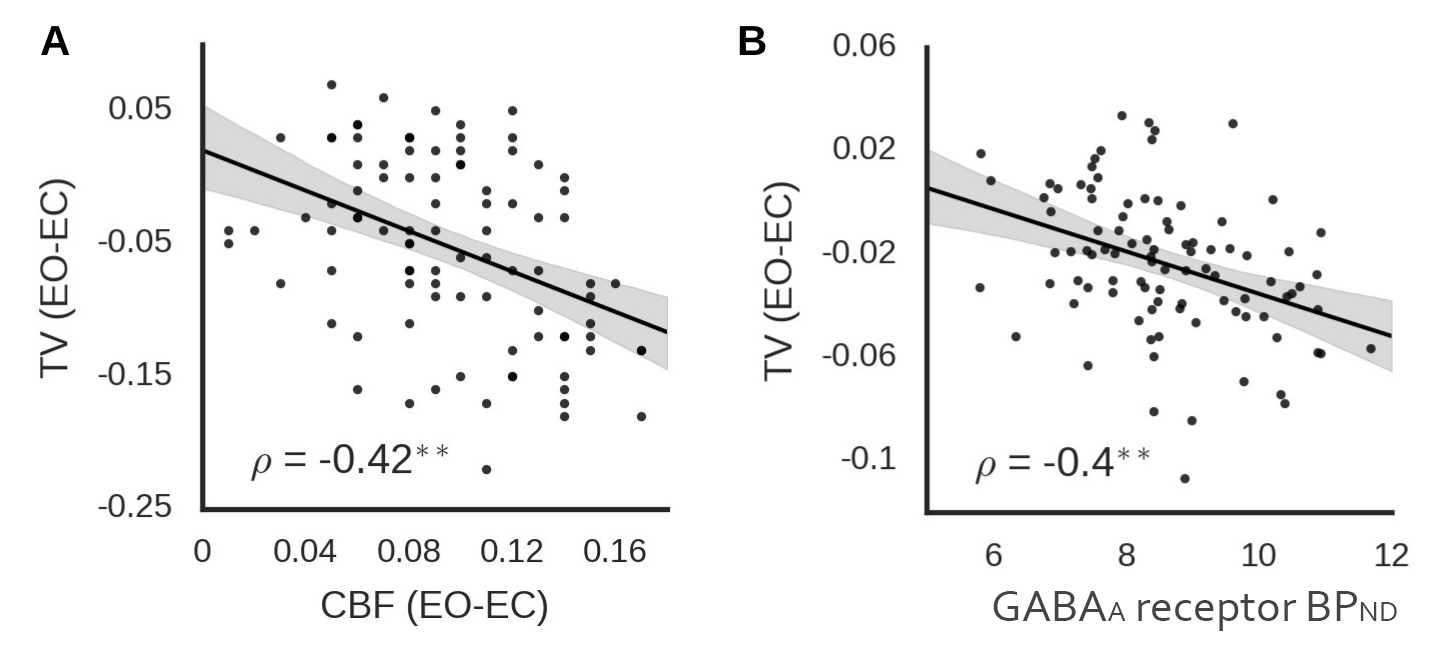
Focusing on an EO vs EC sensitive region in the occipital cortex (identified in an independent sample), we show that TV is constrained over time and spatially in the EO condition compared to EC (Figure 2). The shape of the distribution differs between eyes-open and eyes-closed in the case of temporal variability but not blood flow. As can be seen, the kurtosis of the temporal variability distribution for eyes-closed (-0.81 [-0.31 -1.18]) was lower than that for eyes-open (0 [-0.67 1.17]; difference pFDR < 0.001). Importantly, this reduction in potential activity states is correlated with an increase in energy consumption (Figure 3) and with regional GABAA receptor density (Figure 4).Discussion and Conclusion
Using a combination of BOLD fMRI, ASL, FDG-PET, and FMZ-PET in two independent groups of participants, we show that TV in the visual cortex is positively correlated with energy consumption in the same region. The level of TV is reduced with the opening of the eyes while CBF is increased, suggesting that the constraint of activity over time is an active process that is likely to involve an increase in inhibitory activity. These findings provide insight into the neural processes underlying TV in the human brain, as well as into the mechanisms potentially involved in regulating this when the behavioral state alters.Acknowledgements
No acknowledgement found.References
1. Isaacson JS, Scanziani M., “How inhibition shapes cortical activity,” Neuron. 72:231–243, 2011.
2. Galazzo IB, et al., “Cerebral metabolism and perfusion in MR-negative individuals with refractory focal epilepsy assessed by simultaneous acquisition of 18F-FDG PET and arterial spin labelling,” NeuroImage Clin. 11:648–657, 2016.
3. Prevett MC, et al., “Benzodiazepine-GABAA receptors in idiopathic generalized epilepsy measured with [11C]flumazenil and positron emission tomography,” Epilepsia. 36:113–121, 1995.
Figures