4587
Associative areas and cerebellum show non-linear modulation of fMRI signal when using the non-dominant hand1UCL Institute of Neurology, Queen Square MS Centre, University College London, London, United Kingdom, 2Department of Diagnostic Radiology, Faculty of Applied Medical Science, KAU, Jeddah, Saudi Arabia, 3Department of Neurosciences, Rehabilitation, Ophthalmology, Genetics and Maternal and Child Health, University of Genoa, Genoa, Italy, 4Department of Brain and Behavioural Sciences, University of Pavia, Pavia, Italy, 5Brain Connectivity Centre, C. Mondino National Neurological Institute, Pavia, Italy, 6Wellcome Centre for Imaging Neuroscience, University College London, London, United Kingdom, 7Brain MRI 3T Mondino Research Center, C. Mondino National Neurological Institute, Pavia, Italy
Synopsis
We investigated linear and non-linear BOLD-grip force (GF) relationships in the brain using dominant (DH) and non-dominant hands (NDH). The NDH revealed widespread brain activations compared to DH, irrespective of GF. Looking at the BOLD-GF effects, both hands showed increased activations with increased GF within the contralateral M1 and ipsilateral anterior cerebellum. Non-linear BOLD-GF relationships (up to 4th order) were found, typically in posterior M1, premotor, sensory, parietal, and cerebellar areas. Finally, the consistent bilateral involvement of the cerebral and cerebellar areas suggests their involvement in error tracking or in synkinetic processes between DH and NDH.
Purpose
Cell recordings in animal studies have shown that neuronal firings in different motor areas have non-linear components in response to different forces[1], which is very important for developing physiologically-sound motor control models. Only a few recent neuroimaging studies in humans have detected similar findings with paradigms using mainly the dominant hand (DH)[2,3]. Here we investigated areas exhibiting linear and non-linear BOLD functional magnetic resonance imaging (fMRI) responses to variable grip force (GF) using the non-dominant hand (NDH) in healthy volunteers (HV) and compared results with DH findings.Methods
Subjects: 13 (5 females; mean age 31.0 (±4.48) years) right-handed HV performed a power grip task with an MR-compatible squeezeball using both hands unimanually.
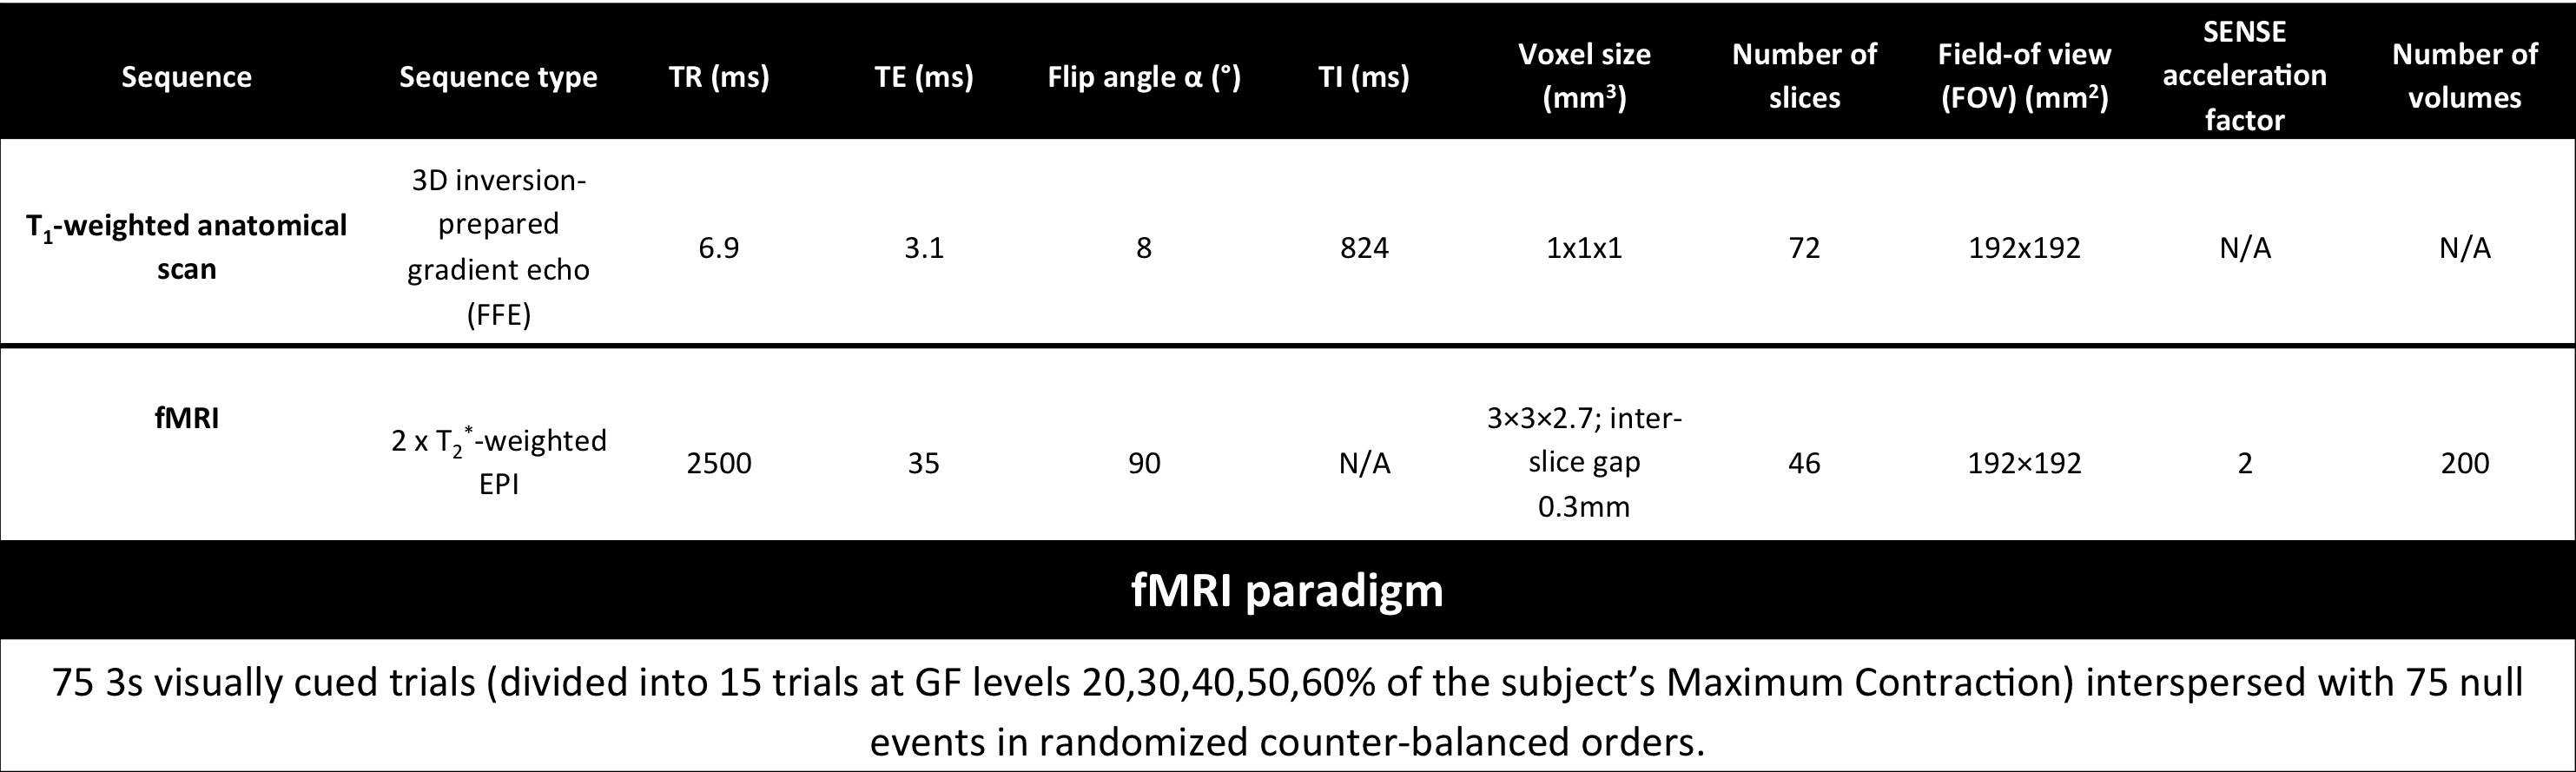
MRI: A 3.0T Philips Achieva scanner with a 32-channel head coil was used. Acquisition and paradigm details are given in figure 1.
Image pre-processing and analyses were performed using SPM12. A standard pre-processing pipeline was followed including slice timing, realignment, co-registration, normalization (using a symmetrical T1 template[4]) and smoothing (8mm kernel).
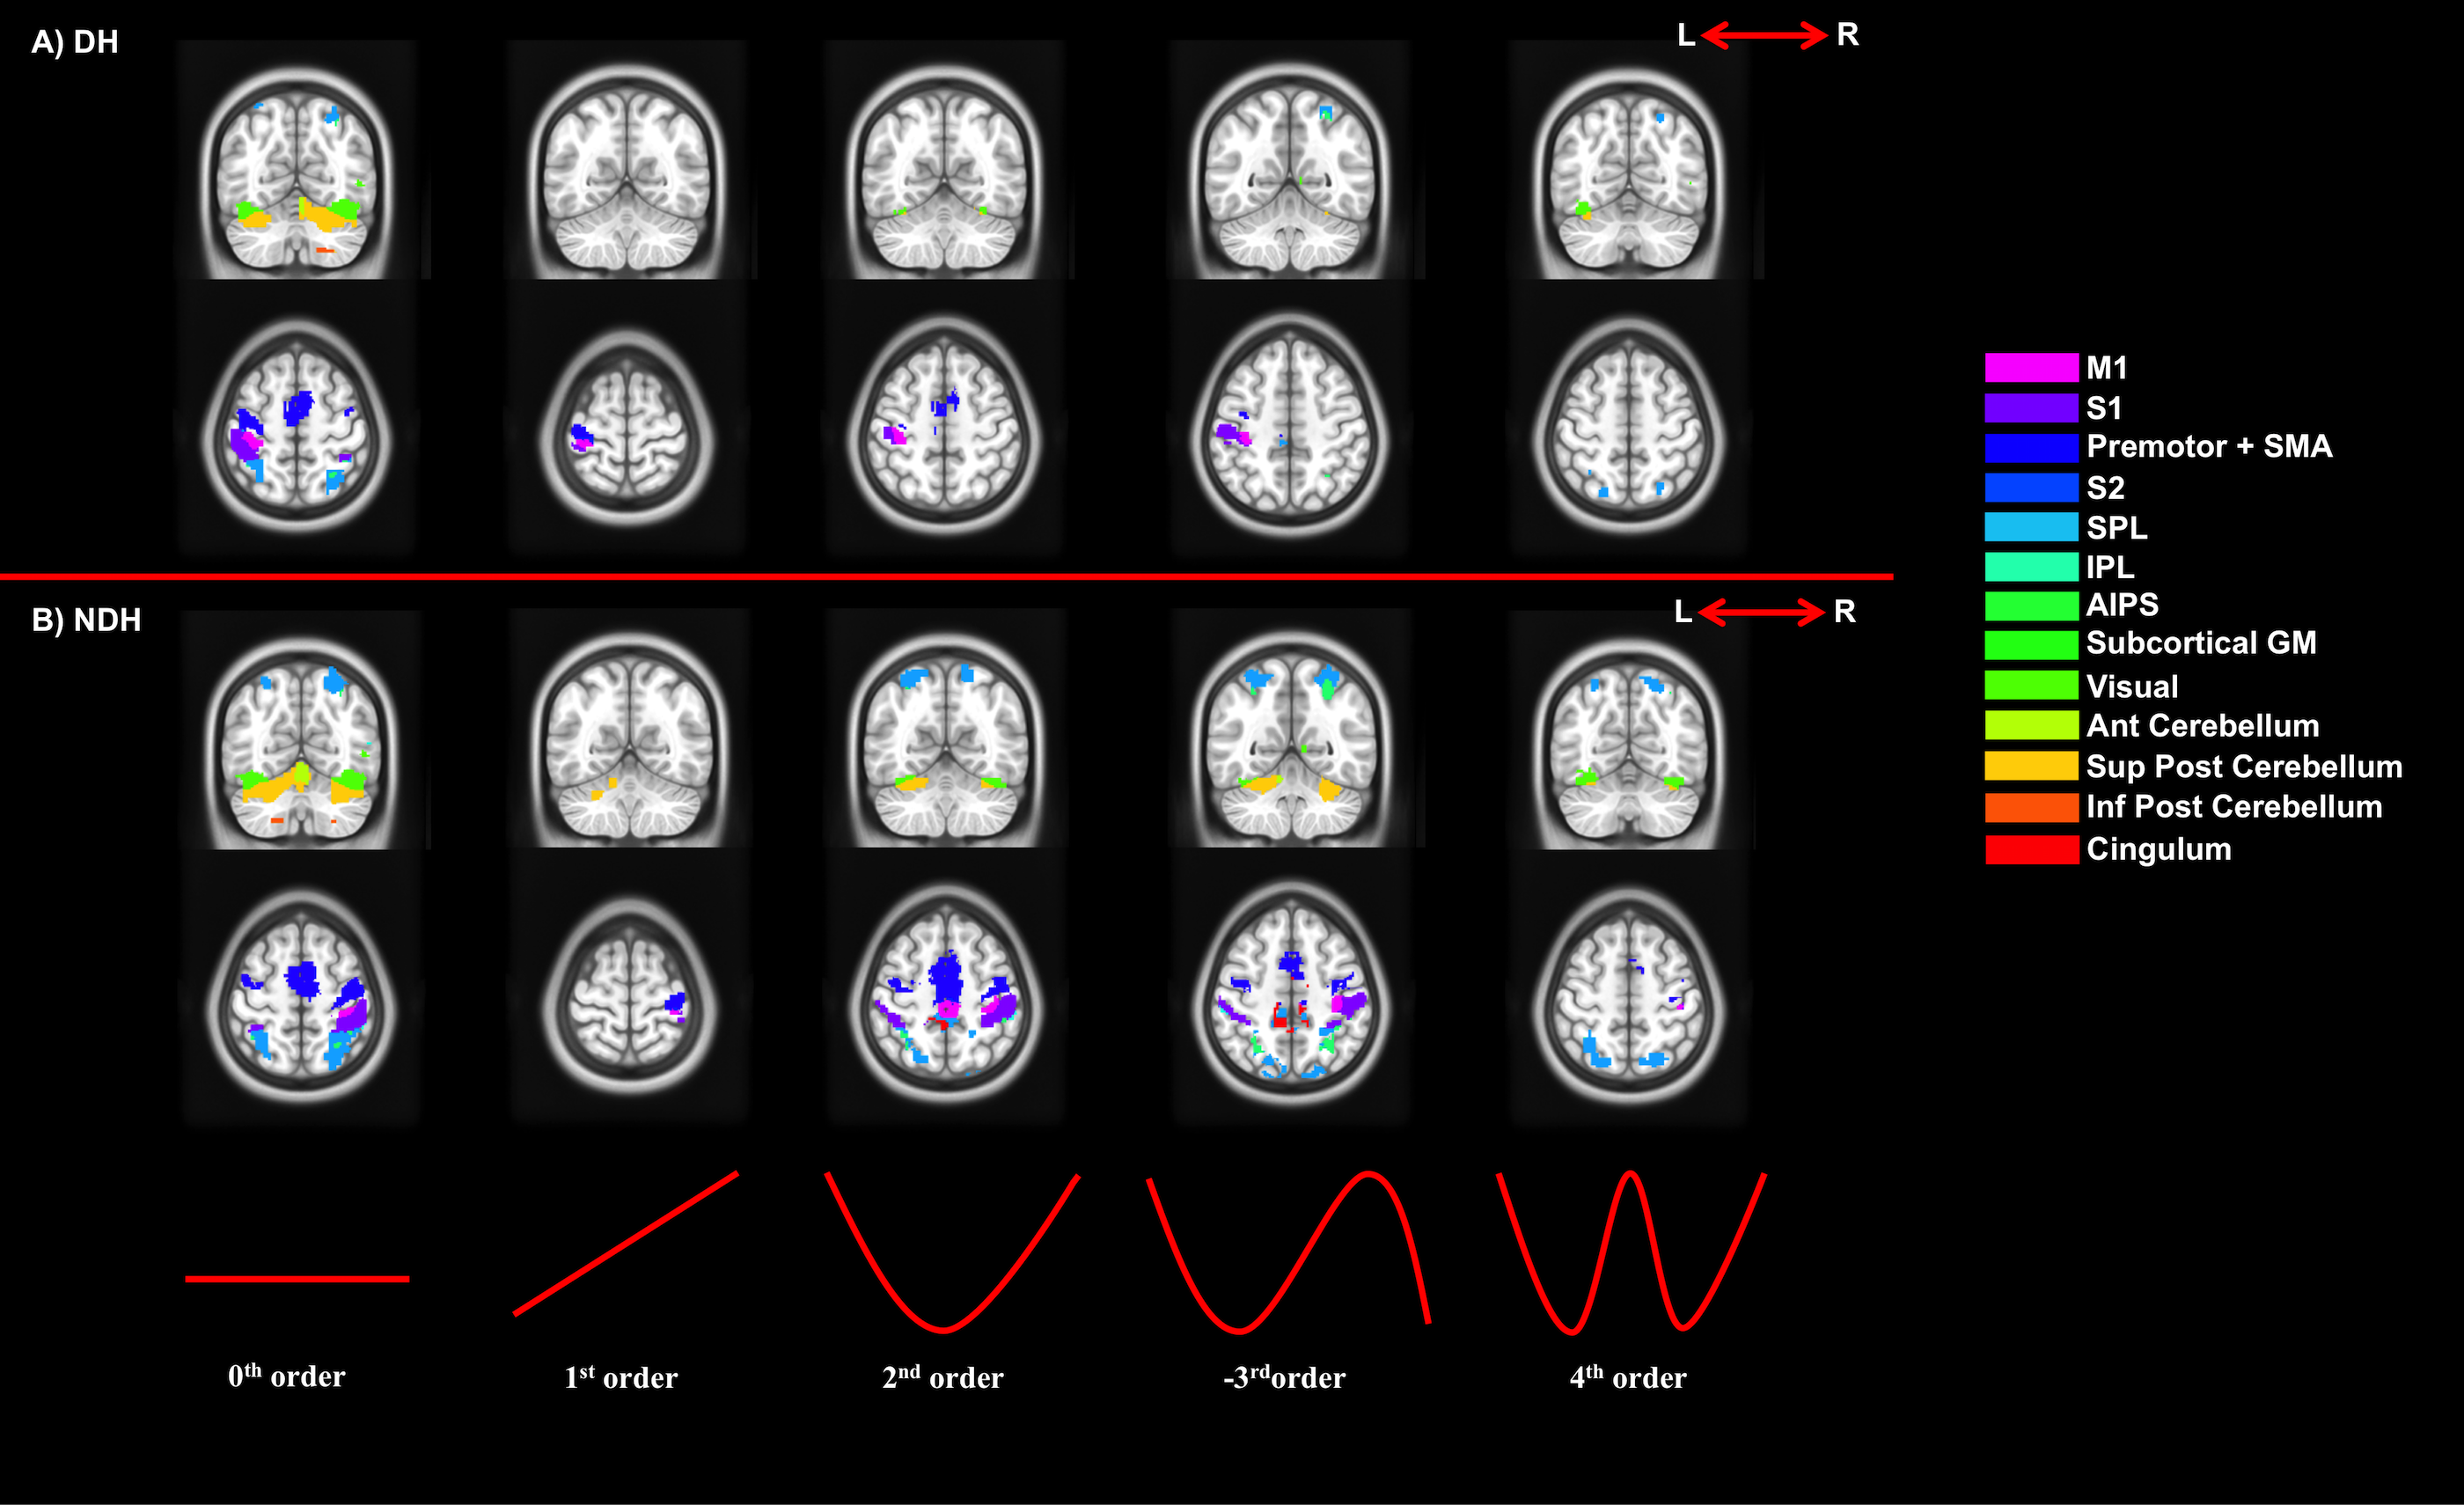
Statistical analysis was performed at two levels: 1) Within-subjects: A parametric specification was chosen to avoid categorical variability. Parametric covariates were modelled using a set of orthogonalized polynomial expansions up to the 4th order and specified by the integral of the grip responses[5]. Movement parameters were included as regressors of no interest. T-statistics were used for the effects of each polynomial coefficient. The resulting contrast images (CIs) at each order were also flipped about the mid-sagittal line and re-sliced with respect to the un-flipped CIs generating fDH and fNDH CIs. This allows the comparison of contralateral and ipsilateral activations, investigating functional consistency between the two hands, as opposed to right and left hemispheres for anatomical comparison. 2) Between-subjects: The “within-subject” CIs were entered into random effects analyses (RFXs). Three types of RFX analysis were performed:
1) One sample t-tests – testing individual linear and non-linear effects for each hand.
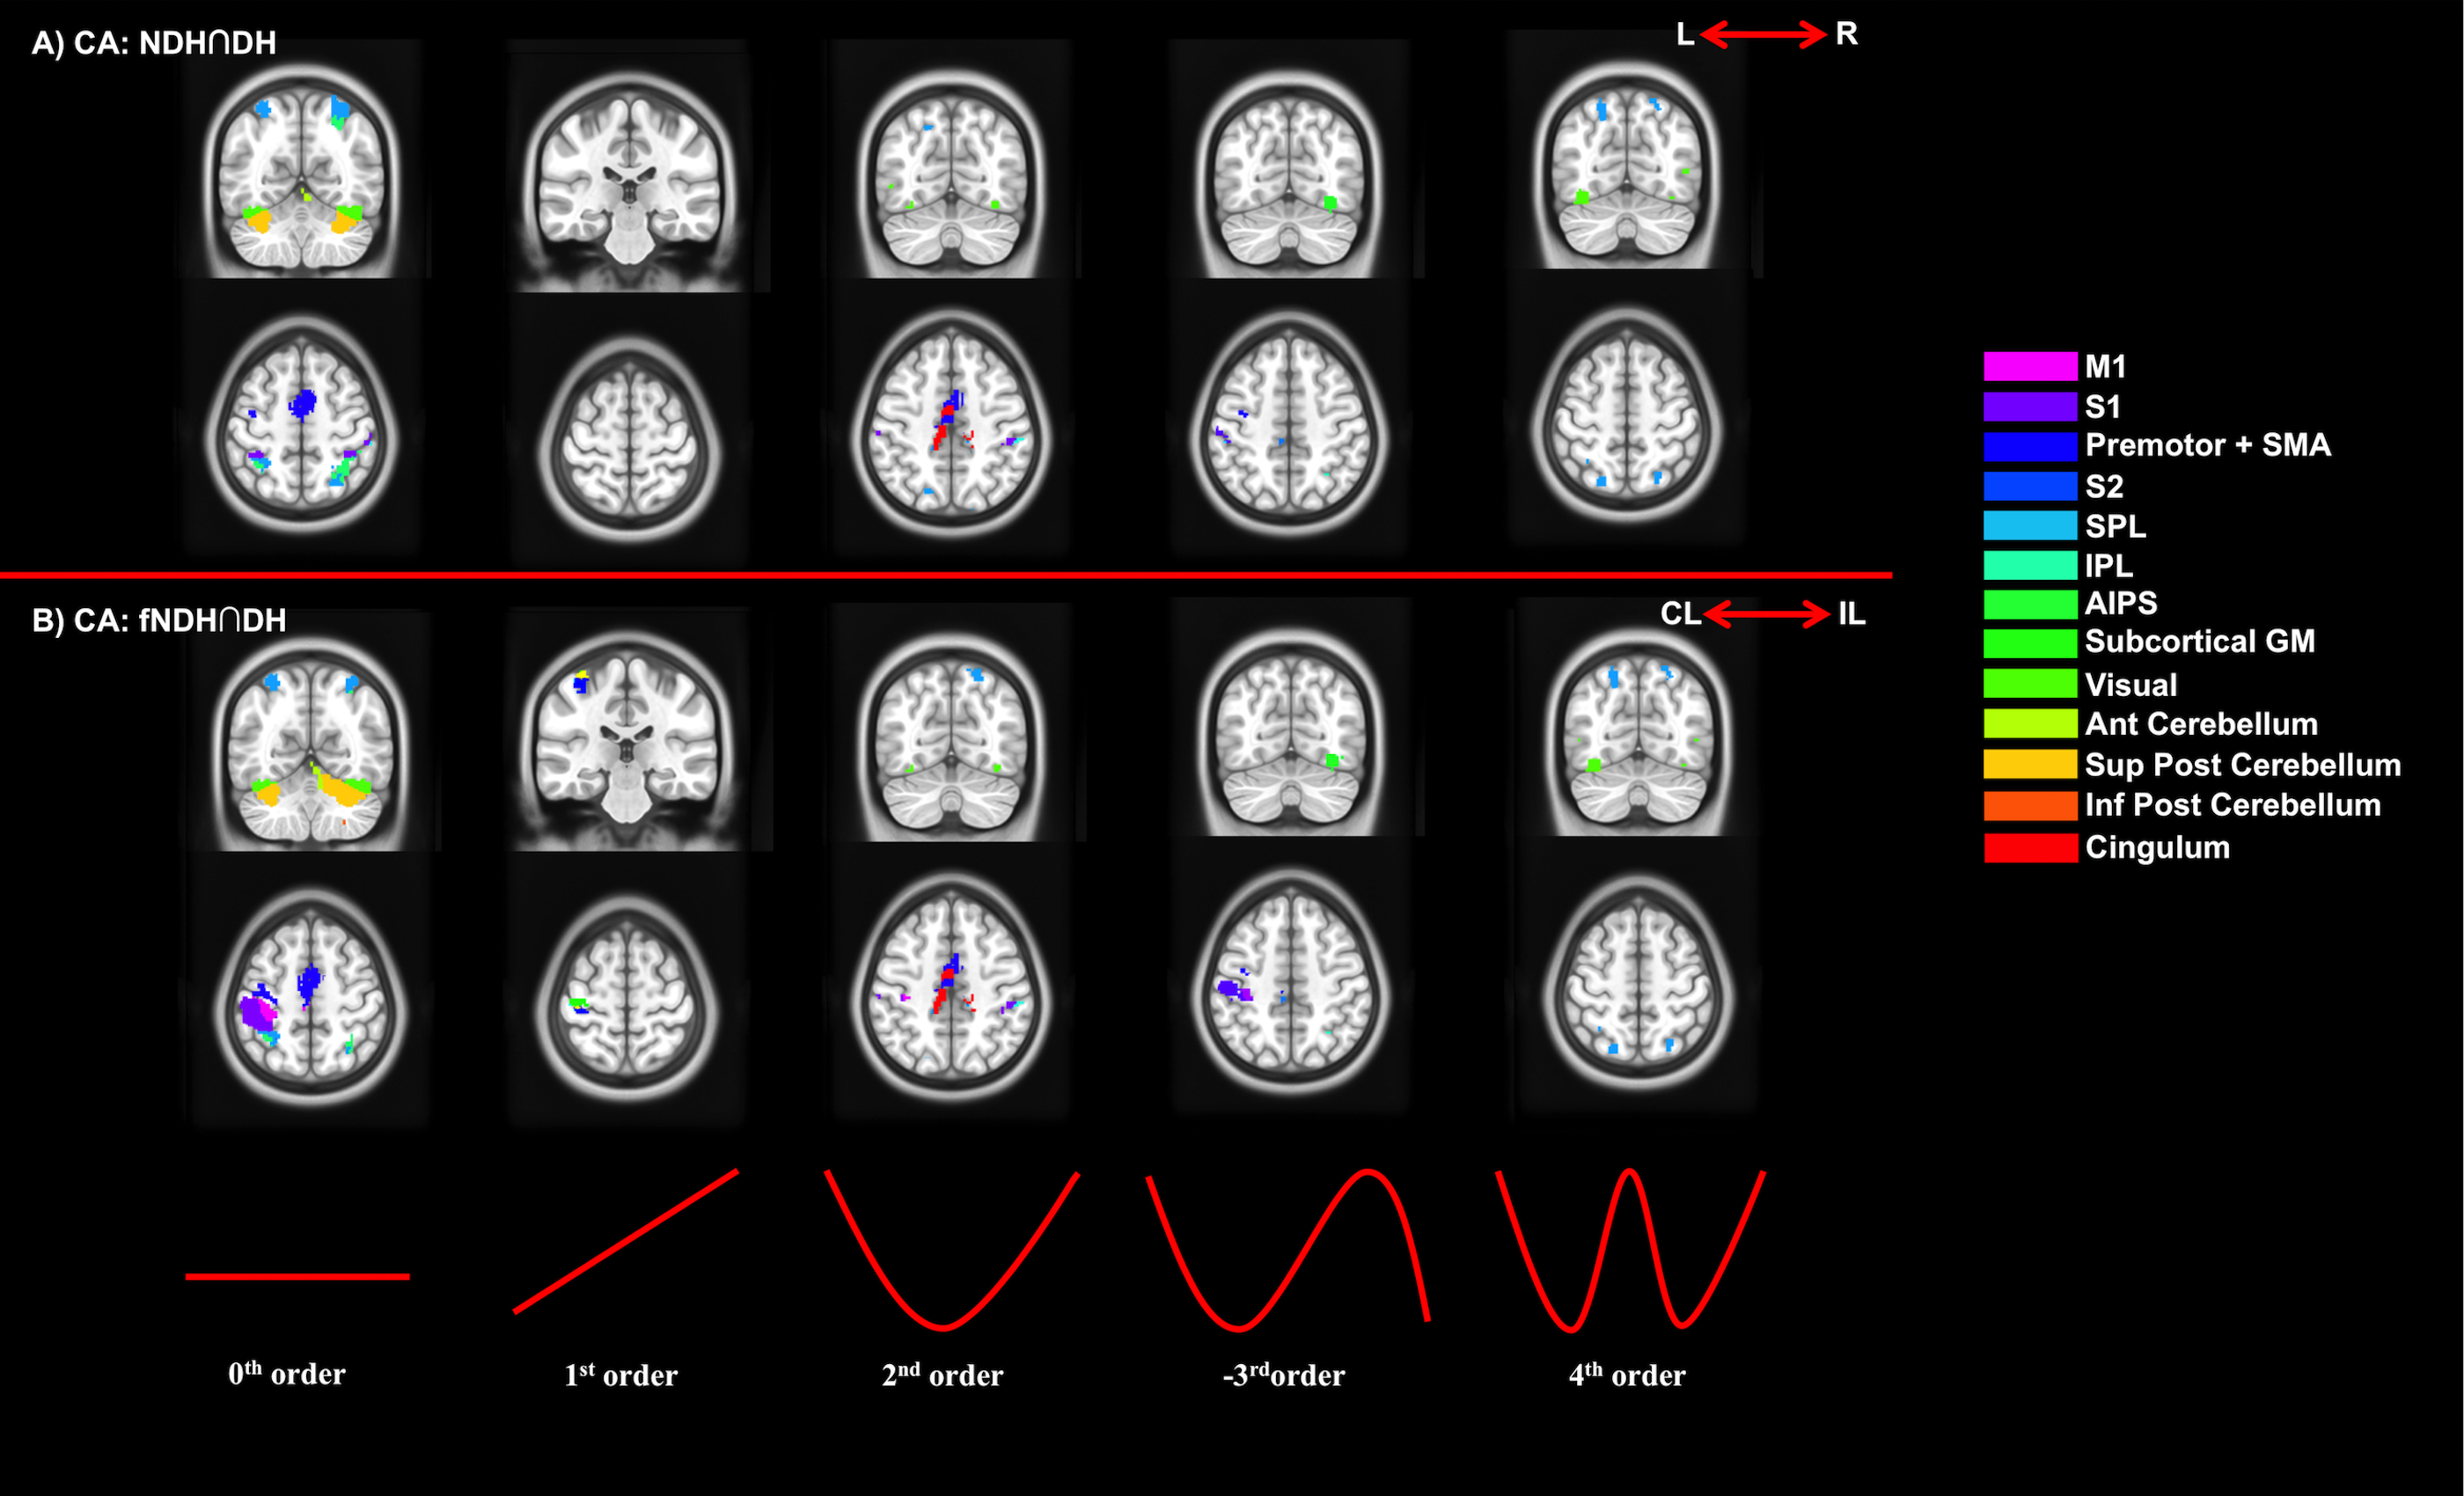
2) Conjunction analysis (CA): Testing anatomically (a) and functionally (b) consistent activations:
a. Right and left hemisphere activations independently of handedness by testing DH and NDH group CIs;
b. Contralateral and ipsilateral hemisphere activations with respect to performing the task with the DH or NDH by testing group DH and fNDH CIs.
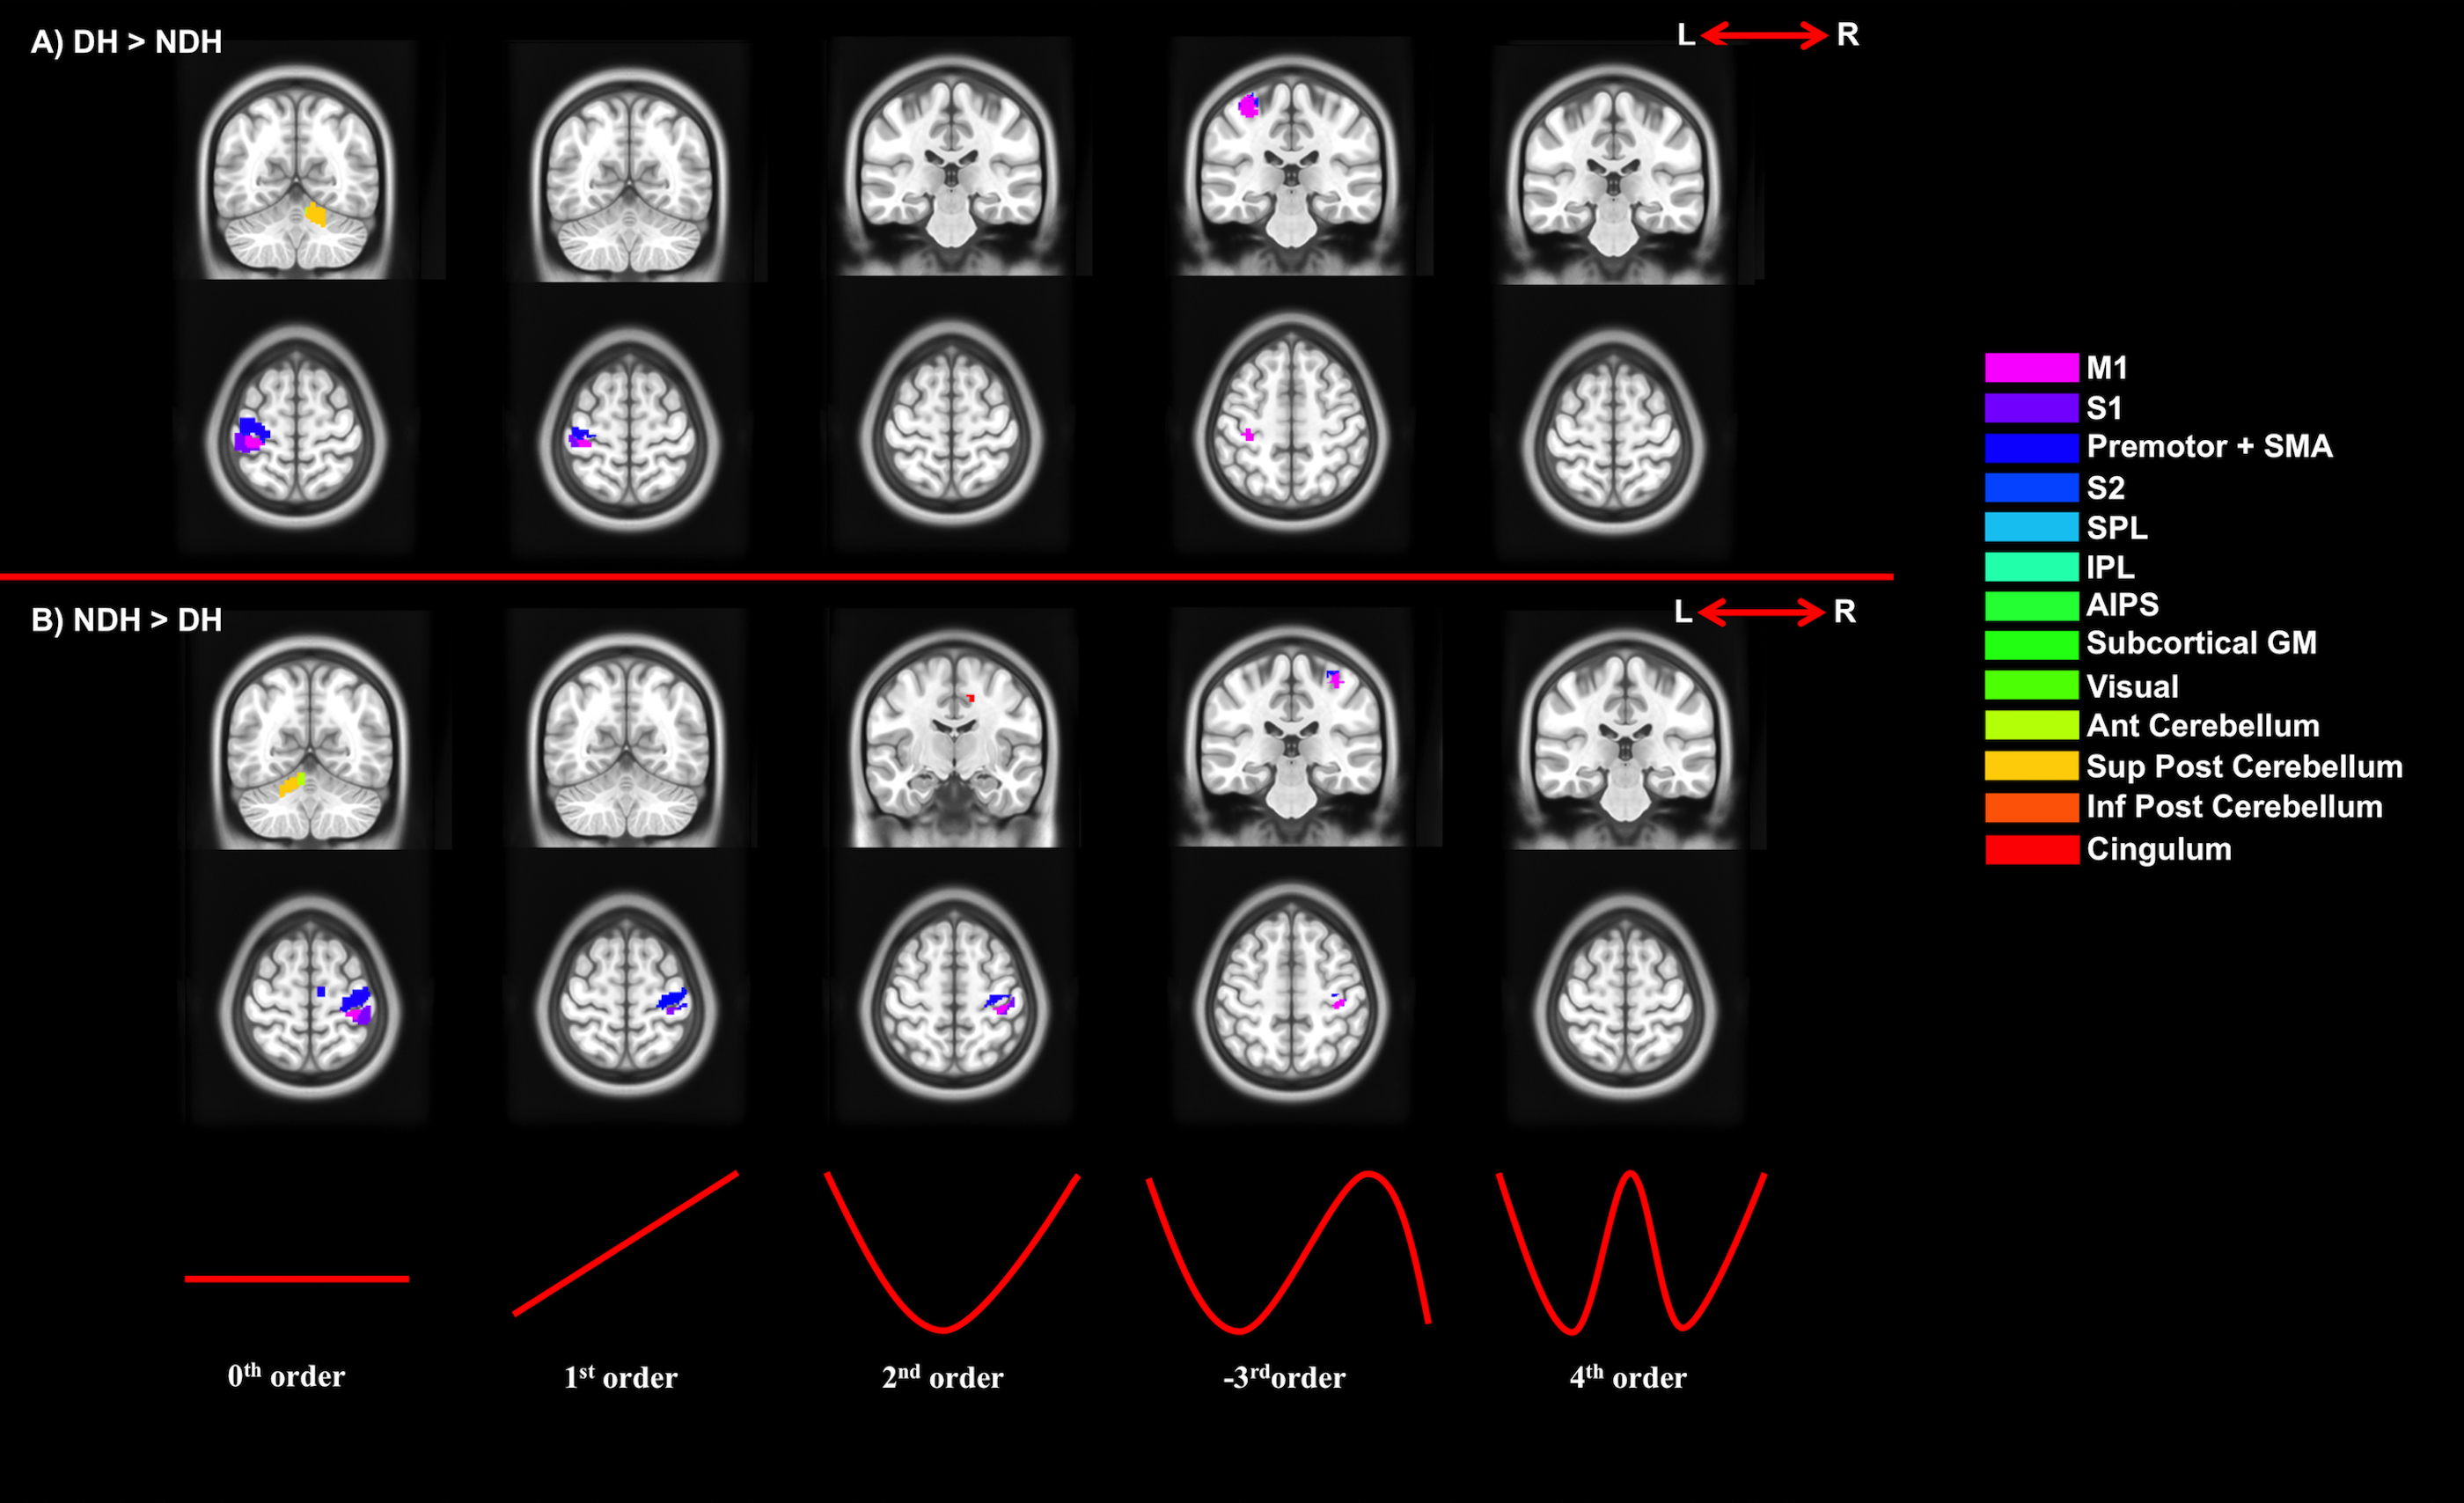
3) Paired t-tests to assess:
a. Specificity of activations (DH vs NDH);
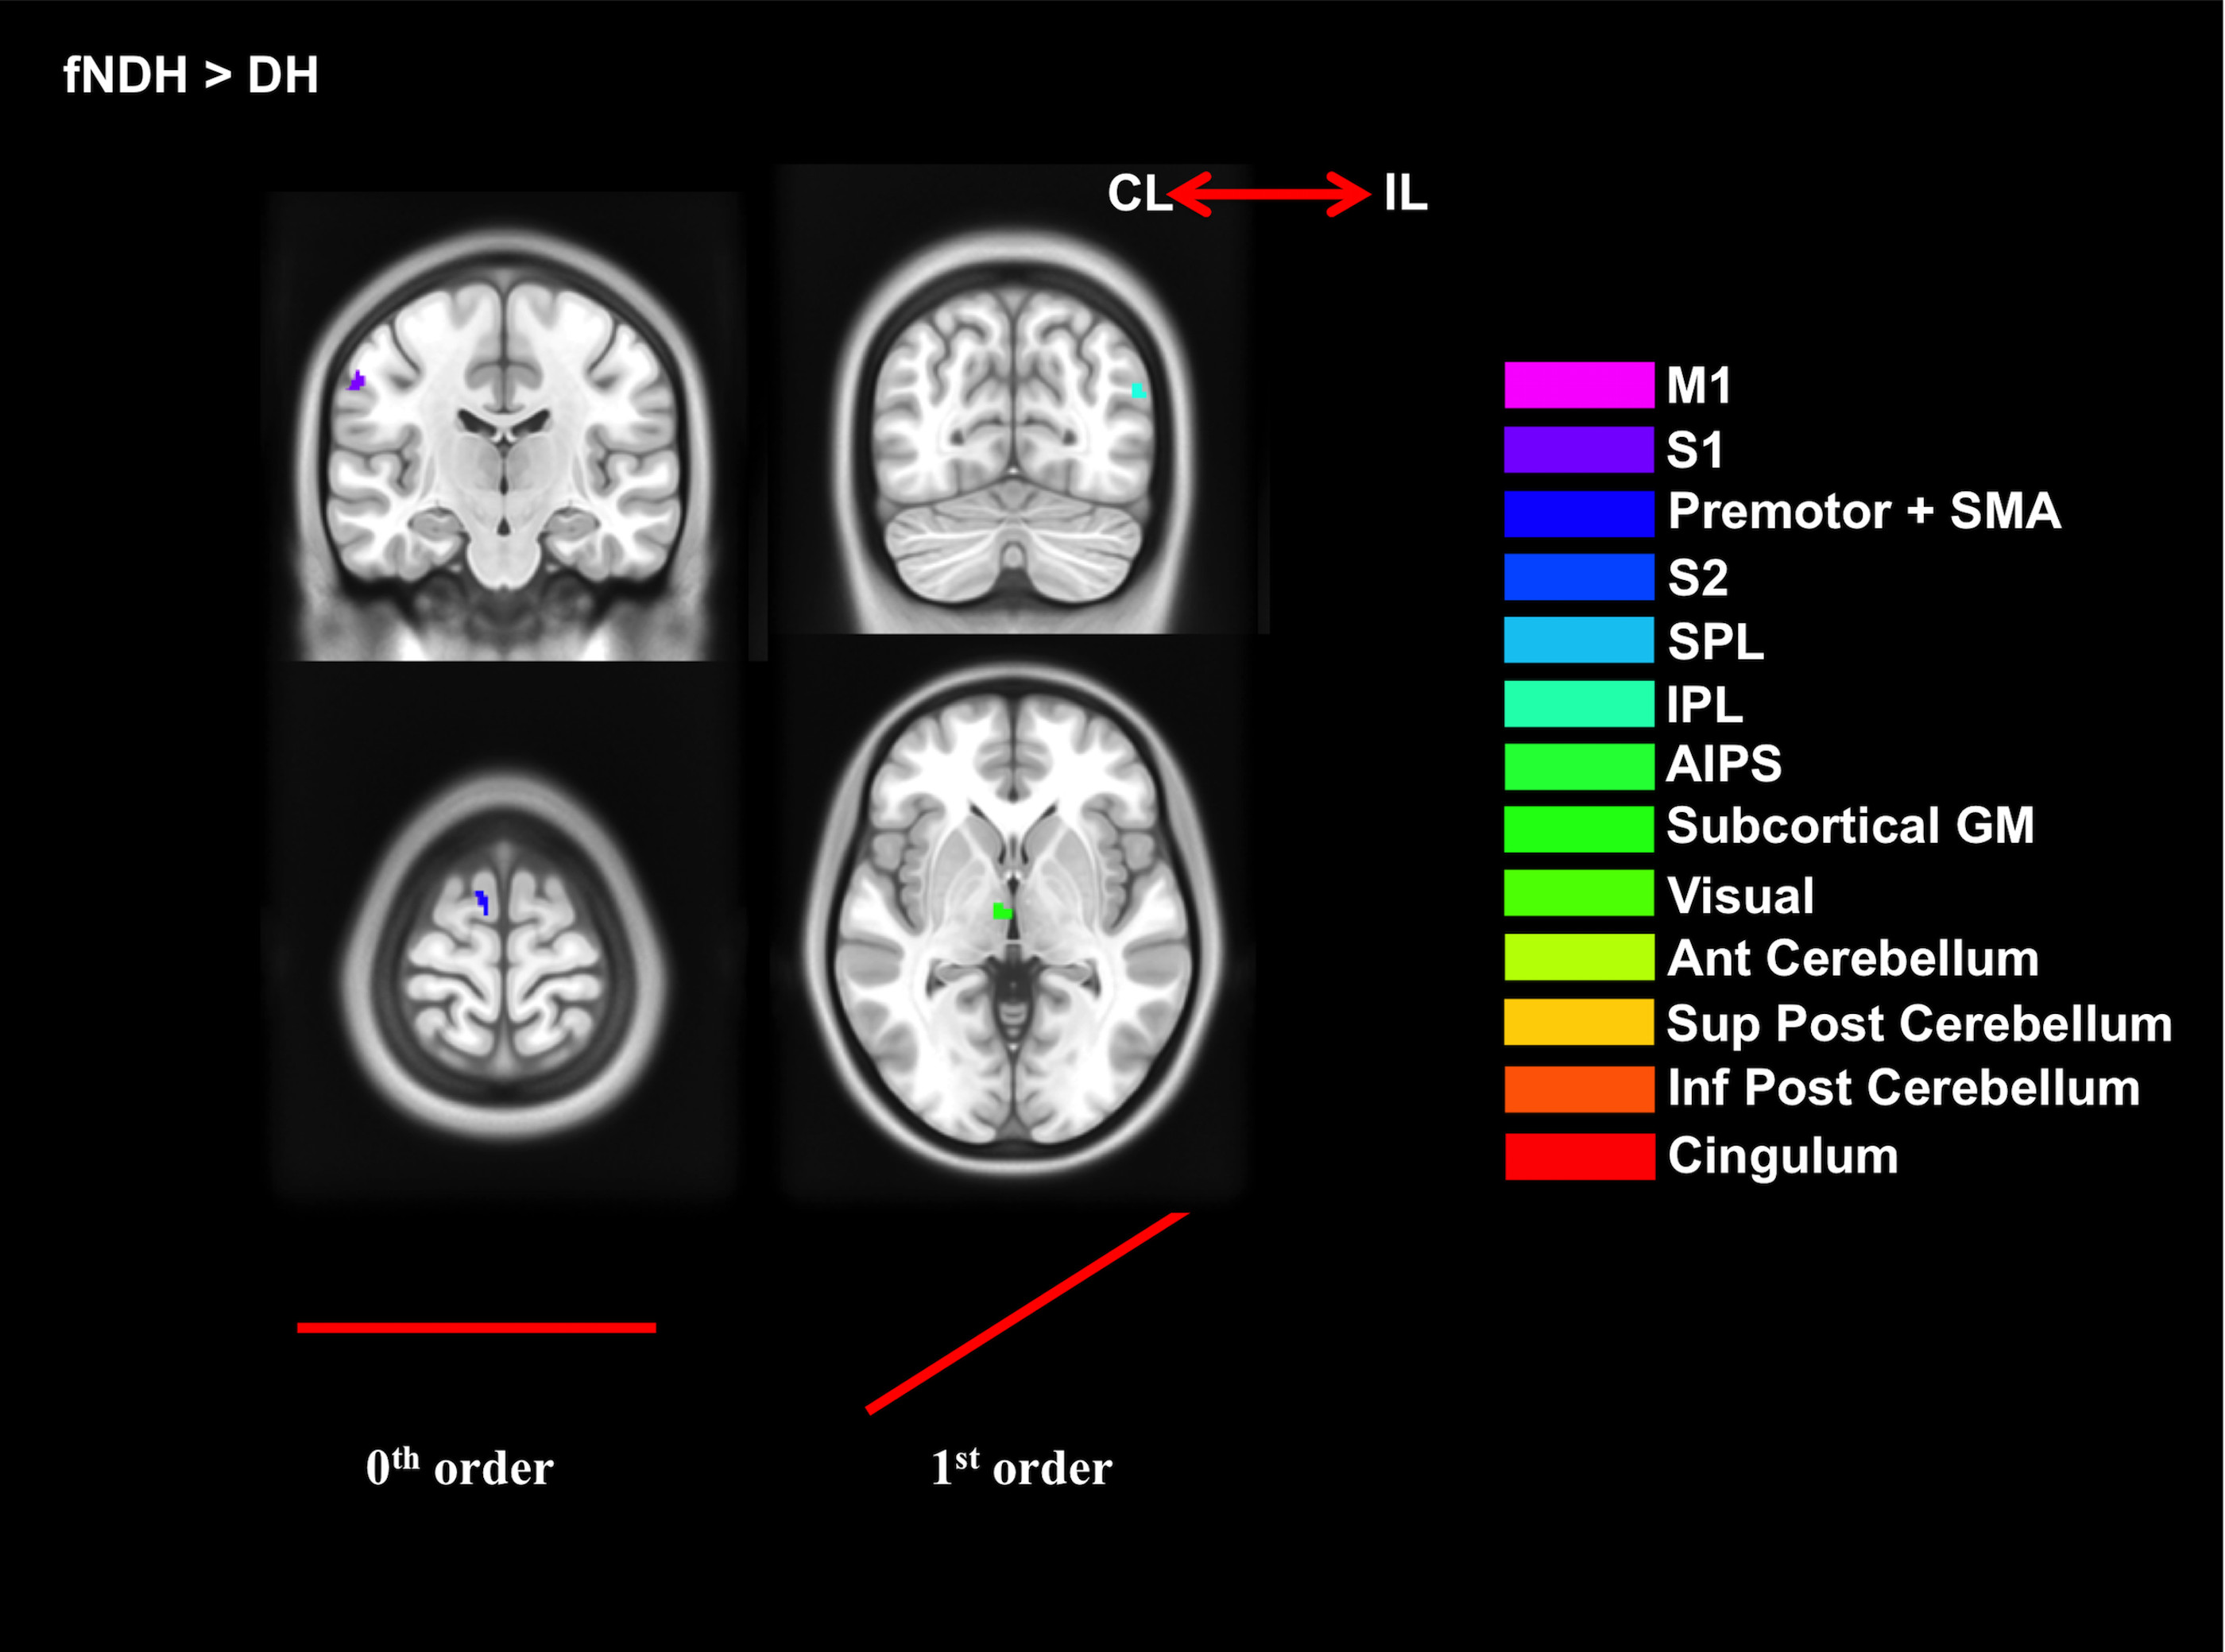
b. Strength of activations (DH vs fNDH).
The significance level was set at P<0.05 (FWE corrected) at cluster level (>10 voxels) (initial uncorrected threshold P<0.0001; T=5.11). Significant clusters were masked with an anatomical atlas[6].
Results
Figures 2-5 summarise the results, showing individual (2), conjunction (3) and paired t-tests (4-5).
We confirmed the presence of major activated motor areas irrespective of GF (0th order). Performing the NDH task revealed widespread stronger brain activations compared to DH, irrespective of GF, including different motor and non-motor regions. Both hands showed increased activations with increased GF within the contralateral M1 and ipsilateral anterior cerebellum. Non-linear BOLD-GF relationships (up to 4th order) were found, typically in posterior M1, premotor, sensory, parietal, and cerebellar areas. NDH showed stronger and symmetrically bilaterally widespread effects compared to DH in the non-linear orders. This was detected in parts of motor, supplementary and associative areas and was shown in the direct-paired t-test comparisons too. CA showed that M1, premotor, sensory, cingulum and anterior cerebellar areas have functionally consistent activations and that the NDH-activated areas that were also functionally active using the DH, localised especially in the right hemisphere.
Conclusion
We demonstrated the presence of non-linear BOLD responses to GF modulation independently of hand used. With both hands, the 0th order effect highlights areas involved in gripping; 1st order positive linear response areas relate to force generation[3]; higher-order effects localise with motor control areas involved in motor planning, attention and complex sensory-feedback. As for DH, NDH shows areas of low BOLD response at intermediate GF (+2nd order analysis) suggestive of an optimum metabolic response[2].
When comparing anatomical consistency between DH and NDH, many secondary motor areas are bilaterally activated. Interestingly, the cingulum activates monolaterally in DH and bilaterally in NDH, where we also observe an increased recruitment of the right hemisphere, suggesting the presence of subconscious data elaboration due to the increased difficulty of performing the task. The consistent bilateral involvement of the cerebellum and associative areas suggests their role in error tracking[7] or in synkinetic processes between DH and NDH.
Functional comparisons (CA analysis) confirm that DH and NDH consistently involve specific functional areas, which are also showing consistent BOLD-GF relationships, with the NDH recruiting more extended local and network-wide areas, overall supporting the increased demand of using the non-preferred hand[8].
Acknowledgements
MS society of the UK; National Institute for Health Research, University College London; AA was supported by KAU (Saudi Arabia), UKSACB and MOHE. MP was supported by the AKWO association, Lavagna (Italy). KJF was supported by the Wellcome trust.References
1. Ashe J. Force and the motor cortex. Behavioural brain research 1997;87(2):255-69.
2. Alahmadi AA, Samson RS, Gasston D, Pardini M, Friston KJ, D'Angelo E, Toosy AT, Wheeler-Kingshott CA. Complex motor task associated with non-linear BOLD responses in cerebro-cortical areas and cerebellum. Brain Struct Funct 2016;221(5):2443-58.
3. Keisker B, Hepp-Reymond MC, Blickenstorfer A, Meyer M, Kollias SS. Differential force scaling of fine-graded power grip force in the sensorimotor network. Hum Brain Mapp 2009;30(8):2453-65.
4. Fonov V, Evans AC, Botteron K, Almli CR, McKinstry RC, Collins DL, Brain Development Cooperative G. Unbiased average age-appropriate atlases for pediatric studies. Neuroimage 2011;54(1):313-27.
5. Buchel C, Wise RJ, Mummery CJ, Poline JB, Friston KJ. Nonlinear regression in parametric activation studies. Neuroimage 1996;4(1):60-6.
6. Eickhoff SB, Stephan KE, Mohlberg H, Grefkes C, Fink GR, Amunts K, Zilles K. A new SPM toolbox for combining probabilistic cytoarchitectonic maps and functional imaging data. Neuroimage 2005;25(4):1325-35.
7. Imamizu H, Miyauchi S, Tamada T, Sasaki Y, Takino R, Putz B, Yoshioka T, Kawato M. Human cerebellar activity reflecting an acquired internal model of a new tool. Nature 2000;403(6766):192-5.
8. Callaert DV, Vercauteren K, Peeters R, Tam F, Graham S, Swinnen SP, Sunaert S, Wenderoth N. Hemispheric asymmetries of motor versus nonmotor processes during (visuo)motor control. Hum Brain Mapp 2011;32(8):1311-29.
Figures