4585
In vivo evidence of negative fMRI response without decrease in neuronal activity: a combined optogenetic fMRI and electrophysiology study1Biomedical Research Imaging Center, University of North Carolina Chapel Hill, Chapel Hill, NC, United States, 2Neurology, University of North Carolina Chapel Hill, Chapel Hill, NC, United States, 3Neurobiology, University of North Carolina Chapel Hill, Chapel Hill, NC, United States, 4Biomedical Research Imaging Core, University of North Carolina Chapel Hill, Chapel Hill, NC, United States, 5Biomedical Engineering, Duke University, Durham, NC, United States, 6Biomedical Research Imaging Center, Unveristy of North Carolina Chapel Hill, Chapel Hill, NC, United States
Synopsis
Neurovascular coupling is the central principle of functional magnetic resonance imaging (fMRI), and thus critical for the interpretation of most fMRI data. While the strong majority of studies support such a tight coupling between neuronal and vascular activity changes in the cortex, the case may not be so straightforward in brain areas containing different cell types such as the striatum, wherein negative fMRI response has been observed to be positively correlated with1, 2, or uncorrelated with electrophysiologically-measured neuronal activity3, 4. Thus, the rodent striatum is an attractive platform to mechanistically dissect the rules governing neurovascular coupling, providing a novel case in which known coupling rules are violated. Taking this path, we began by asking a simple yet critical question: are neuronal activity increases in striatum causal in striatal negative fMRI response? Our results, employing an optogenetic-fMRI approach coupled with correlative in vivo electrophysiology, reveal that, indeed, selective excitation of striatal neurons drives large-scale local negative fMRI response. However, complementary electrophysiological data also described here suggests that the link between striatal neuronal activity and hemodynamics is more complicated than straightforward negative coupling
Purpose
Neurovascular coupling is the central principle of functional magnetic resonance imaging (fMRI), and thus critical for the interpretation of most fMRI data. While the strong majority of studies support such a tight coupling between neuronal and vascular activity changes in the cortex, the case may not be so straightforward in brain areas containing different cell types such as the striatum, wherein negative fMRI response has been observed to be positively correlated with1, 2, or uncorrelated with electrophysiologically-measured neuronal activity3, 4. Thus, the rodent striatum is an attractive platform to mechanistically dissect the rules governing neurovascular coupling, providing a novel case in which known coupling rules are violated. Taking this path, we began by asking a simple yet critical question: are neuronal activity increases in striatum causal in striatal negative fMRI response? Our results, employing an optogenetic-fMRI approach coupled with correlative in vivo electrophysiology, reveal that, indeed, selective excitation of striatal neurons drives large-scale local negative fMRI response. However, complementary electrophysiological data also described here suggests that the link between striatal neuronal activity and hemodynamics is more complicated than straightforward negative coupling.Methods
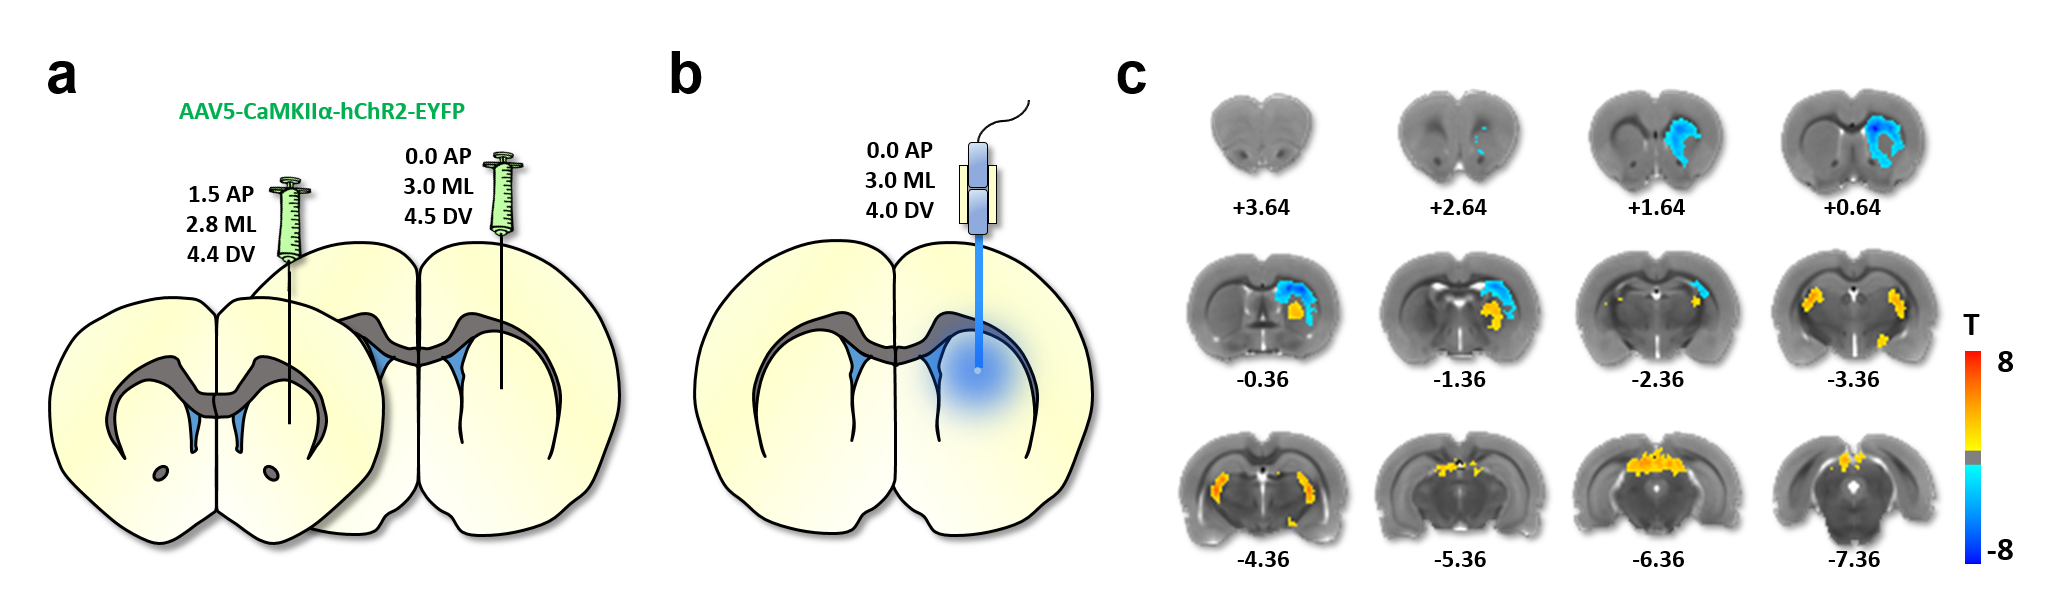
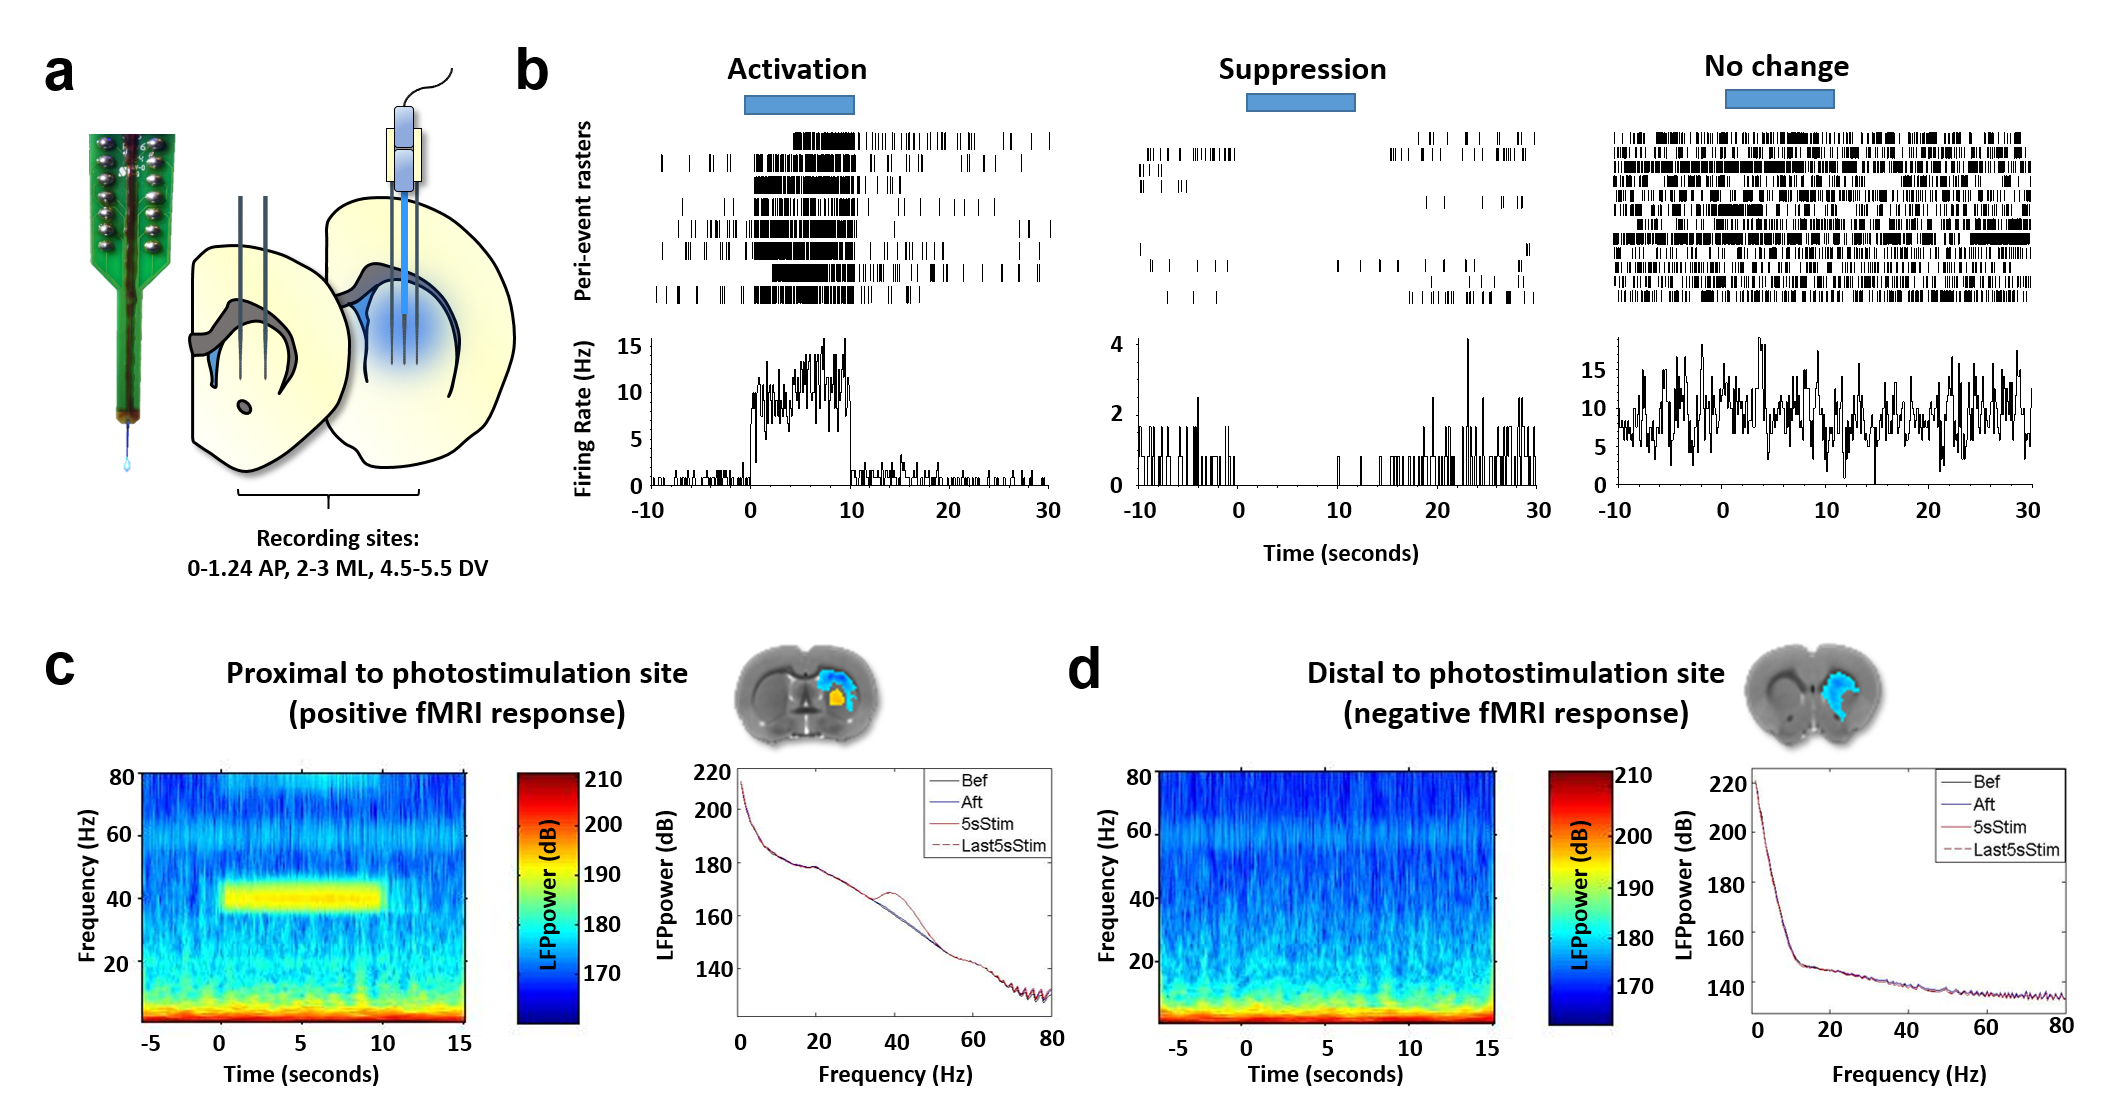
Wildtype Sprague-Dawley rats were prepared for optogenetic-fMRI (n=12) or electrophysiology recordings (n=20 cells from 4 rats) via two-microinjections with AAV- CaMKIIα-ChR2-EYFP into striatum. During optogenetic-fMRI, each rat was endotracheally intubated and ventilated with 0.5% isoflurane and medical air, in addition to dexmedetomidine (0.05mg/kg/hr,i.v.) and pancuronium bromide (0.05mg/kg/hr,i.v.). CBV-fMRI was achieved by delivering monocrystalline iron oxide contrast agent (30mg-Fe/kg,i.v.). Single shot GE-EPI sequence (BW=300kHz, TR=1000ms, TE=8.107ms, matrix=80x80, FOV=2.56x2.56cm2, slice thickness=1mm) were acquired using a Bruker 9.4T scanner and a home-made surface-coil. General-Linear-Model was used5 with group activity maps threshholded at p<0.001 and cluster size of 20 (FDR-corrected). For electrophysiology, animal preparation was identical to fMRI. Electrophysiological data was collected using a NeuroNexus-optoelectrode with a Blackrock Cerebus system, analyzed by custom-written Matlab scripts and the Blackrock offline spike sorter. For single unit analyses, data was band-pass filtered between 250Hz-5kHz and the spike counts were determined by a threshold at 3-standard-deviations. Data was aligned to the stimulus onset, and averaged across trials to construct the peri-stimulus-time-histogram (PSTH). To investigate modulation of the rhythmic brain activity, local field potential (LFP) was analyzed by low-pass filtering the raw continuous data with a butterworth 2nd order filter with 300 Hz cut-off, followed by convolution with a Morlet wavelet transformation for spectral plots.Results
The experimental setups for optogenetic-fMRI and electrophysiology of the striatum are shown in Fig 1a,b and 2a, respectively. Optogenetic stimulation of striatal neurons elicited a spatially complex fMRI response, comprising a small area of increases proximal to the optic fiber tip, surrounded by widespread decreases encompassing most of the striatum (Fig 1c). The large-scale fMRI signal decreases within the same nucleus was both noteworthy and surprising. Although the data presented here reflect CBV decreases, a similar pattern was observed using BOLD measurements (data not shown). In an effort to identify the electrophysiological correlates of this unique striatal fMRI signal, in vivo extracellular recordings were undertaken in striatal ChR2-expressing rats, using an identical stimulation paradigm. When the stimulating light source was located proximal to the recording sites (i.e., a location where positive fMRI signals may be expected), we noted both local field potential changes (increases in beta and gamma range power), alongside a small number of modulated units (Fig 2b). However, when recordings were taken distally to the photostimulation source (using the same fiber placement and wattage as in our fMRI experiment), we observed no light-evoked change in either firing rate or LFPs (Fig. 2b&c). This is particularly remarkable in that these distal recordings were undertaken using identical condition and sampling areas in which, based on our earlier fMRI experiment, robust negative fMRI responses would be expected.Discussion
In this study, we provide direct causal evidence that activation of striatal neurons drives striatal negative fMRI signals. One relatively straightforward hypothesis, tested here during electrophysiological experiments, is stimulation-evoked recruitment of feedforward inhibitory neurotransmission6, 7. However, extracellular recordings revealed no evidence of large-scale, photostimulation-evoked inhibition in striatum. This finding is particularly interesting in the context of prior studies that have also failed to identify such a relationship, yet using far more indirect sources of striatal activity modulation1, 2. Alternative hypotheses, outside of traditional neurovascular coupling, must thus be considered to explain our findings. One possibility, currently being evaluated by our group, is that excitation of striatal neurons drives the local release of potent vasoconstrictive compounds that uncouple local fMRI and electrophysiological signals. This study suggests caution in interpreting the striatal fMRI signals.Acknowledgements
We thank members of the Shih lab for valuable discussions concerning the experiments described in this manuscript. M.D was supported by CDF-HFSP. Y.Y.I.S. was supported by NINDS R01 NS091236, NIMH R01 MH111429, R41 MH113252, R21 MH106939, NIAAA U01 AA020023, R01 AA025582, American Heart Association 15SDG23260025, and is an Ellen Schapiro & Gerald Axelbaum Investigator and Young Investigator Award recipient of the Brain & Behavior Research Foundation. Dr. Patricia Jensen at NIEHS is duly acknowledged for providing Hoxb1-hm3Dq mice. Yu-Wei Chen is acknowledged for helping with immunohistochemical analysisReferences
1. Mishra AM, Ellens DJ, Schridde U, et al. Where fMRI and electrophysiology agree to disagree: corticothalamic and striatal activity patterns in the WAG/Rij rat. The Journal of neuroscience : the official journal of the Society for Neuroscience 2011;31:15053-15064. 2. Shih YY, Chen CC, Shyu BC, et al. A new scenario for negative functional magnetic resonance imaging signals: endogenous neurotransmission. The Journal of neuroscience : the official journal of the Society for Neuroscience 2009;29:3036-3044. 3. Hsu YH, Chang C, Chen CC. Negative cerebral blood volume fMRI response coupled with Ca(2)(+)-dependent brain activity in a dopaminergic road map of nociception. NeuroImage 2014;90:43-51. 4. Shih YY, Huang S, Chen YY, et al. Imaging neurovascular function and functional recovery after stroke in the rat striatum using forepaw stimulation. Journal of cerebral blood flow and metabolism : official journal of the International Society of Cerebral Blood Flow and Metabolism 2014;34:1483-1492. 5. Leite FP, Tsao D, Vanduffel W, et al. Repeated fMRI using iron oxide contrast agent in awake, behaving macaques at 3 Tesla. Neuroimage 2002;16:283-294. 6. Gittis AH, Nelson AB, Thwin MT, Palop JJ, Kreitzer AC. Distinct roles of GABAergic interneurons in the regulation of striatal output pathways. The Journal of neuroscience : the official journal of the Society for Neuroscience 2010;30:2223-2234. 7. Tepper JM, Wilson CJ, Koos T. Feedforward and feedback inhibition in neostriatal GABAergic spiny neurons. Brain research reviews 2008;58:272-281.Figures