4581
How does acute hypertensive crisis affect brain volume? A structural MRI study1National Magnetic Resonance Research Center (UMRAM), Ankara, Turkey, 2Department of Neurology, Faculty of Medicine, Hacettepe University, Ankara, Turkey, 3Department of Radiology, Faculty of Medicine, Hacettepe University, Ankara, Turkey, 4Department of Emergency Room, Faculty of Medicine, Hacettepe University, Ankara, Turkey
Synopsis
Acute elevations in systemic blood pressure can lead to a wide spectrum of central nervous system manifestations, including catastrophic scenarios like intracerebral hemorrhage. We hypothesized that brain swelling occurs in hypertensive crisis patients, assessed by structural MRI. We prospectively collected MRI data from a consecutive series of patients admitted to the emergency department with a diagnosis of hypertensive urgency but no neurologic symptoms. A second MRI was obtained at 3-months follow-up of blood pressure normalization. MRI analysis revealed reductions in cortical and sub-cortical gray matter after normalization of blood pressure.
Target audience:
This study can be of interest to researchers who work in the field of neurology, neuroscience, cerebral hemodynamics, specifically hypertension related pathophysiologic changes.Purpose:
Acute elevations in systemic blood pressure can lead to a wide spectrum of central nervous system manifestations, including catastrophic scenarios like intracerebral hemorrhage [1]. We hypothesized that brain swelling occurs in hypertensive crisis patients, assessed by structural MRI.Methods:
IRB was obtained for this study and all the participants gave signed consent form.
We prospectively collected Magnetic resonance imaging (MRI) data from a consecutive series of patients admitted to the emergency department with a diagnosis of hypertensive emergency but no neurologic symptoms. Twenty-five patients with hypertensive crisis (F/M: 15/10, 55.20 ± 18.96 years) were included in the study. A second MRI was obtained at 3-months follow up of blood pressure normalization.
Image Acquisition: In order to evaluate structural brain differences, MRI was performed in all participants on a 1.5 T system equipped with 8-channel phase-array head coil system (Magnetom Symphony Tim, Siemens, Germany). Imaging protocol applied whole brain sagittal 3D T1-weighted (W) magnetization prepared recalled gradient-echo (MPRAGE) (TR/TE/TI; 1910/3.5/1100 ms, Bandwidth: 130 Hz/px, Slice thickness: 1 mm, FOV: 195*260, matrix: 173p*256, number of slices: 176) sequences.
Data Processing and Analysis: To determine the effect of volume loss of in cortical and subcortical structures, we used Freesurfer Version 5.3.0 (http://surfer.nmr.mgh.harvard.edu/) volumetric segmentation including the removal of non-brain tissue (skull, eyeballs and skin), using an automated algorithm with the ability to successfully segment the whole brain without any user intervention and cortical surface reconstruction methods to obtain regional measures of cortical volumes (mm3). The automated procedures for volumetric measures of the different brain structures was described by Fischl et al.[2]. The reconstructed cortical surface models for each participant were checked to confirm segmentation accuracy and regions with poor segmentation accuracy due to poor image quality or misregistration were excluded from analyses. Cortical surfaces were automatically parcellated and combined to create average cortical thickness and volume for total gray matter (GM) and for frontal, temporal, parietal, and occipital lobar regions. Significant differences in whole brain volume were compared for the patients on admission and at 3 months follow-up the General Linear Model (GLM) embedded in the QDEC (Query, Design, Estimate and Contrast) interface of Freesurfer v5.3.0 (http://surfer.nmr.mgh.harvard.edu), with group as a predictor and volume as response. The cluster-corrected significance level was set to 5% and Monte Carlo null hypothesis simulations were applied. Statistical significance between volumetric measurements of the two time-points was tested using t-test and Wilcoxon test.
Results:
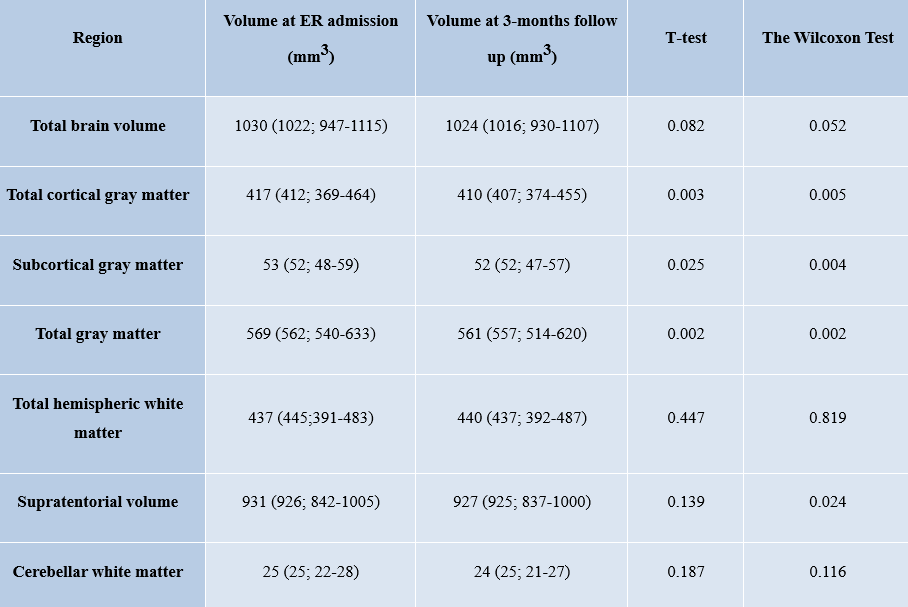
Patients with hypertensive crisis showed significant reductions in the total cortical gray matter, subcortical gray matter and total gray matter volume reductions at 3 months follow-up MRI of normalization of blood pressure and discharge from ER (p < 0.05) (Table 1). However no selective gray matter structure could be identified in group comparisons when GLM embedded in QDEC. White matter volume on the other hand did not show any volumetric change in this period.Conclusions:
Statistically significant cortical and sub-cortical gray matter volume reductions occur in after normalization of blood pressure, we expect some different pathophysiologic abnormality may occur in hypertensive conditions of the brain other than white matter edema.Acknowledgements
References
1. Rincon, Fred, and Stephan A. Mayer. "Clinical review: Critical care management of spontaneous intracerebral hemorrhage." Critical Care 12.6 (2008): 1.
2. Fischl, Bruce, et al. "Whole brain segmentation: automated labeling of neuroanatomical structures in the human brain." Neuron 33.3 (2002): 341-355.
Figures