4580
Sickle hemoglobin vs. normal hemoglobin: Any changes in susceptibility?1Mallinckrodt Institute of Radiology, Washington University in St. Louis, St. Louis, MO, United States, 2Washington University in St. Louis, St. Louis, MO, United States, 3Washington University in St. Louis
Synopsis
Alterations in cerebral oxygenation may be helpful as an imaging biomarker to predict stroke risk in sickle cell disease (SCD). Such measurement requires the knowledge of susceptibility properties of sickle hemoglobin, HbS. In this study, we aimed at measuring volume susceptibility difference between fully-oxygenated and full-deoxygenated blood, Δχo, of HbS and HbA. The measured Δχo of HbA is consistent with literature reported range, and Δχo of HbS is greater than that of HbA. However, this difference does not reach statistical significance.
Introduction
Sickle cell disease (SCD) patients have a high risk of stroke. This risk may result from abnormal cerebral hemodynamics and oxygenation. MR-measured quantitative cerebral oxygenation may provide insight into tissue vulnerability in SCD. The knowledge of the volume susceptibility difference between fully-oxygenated and full-deoxygenated blood, denoted as Δχo, is required for the quantification of oxygenation. In SCD, the aggregation of Hemoglobin S (HbS) leads to the sickle shape of the red blood cells. Thus far, little is known about the susceptibility of HbS. The aim of this study is to measure Δχo for HbS. For comparison, Δχo of HbA was also measured in normal subjects.Methods
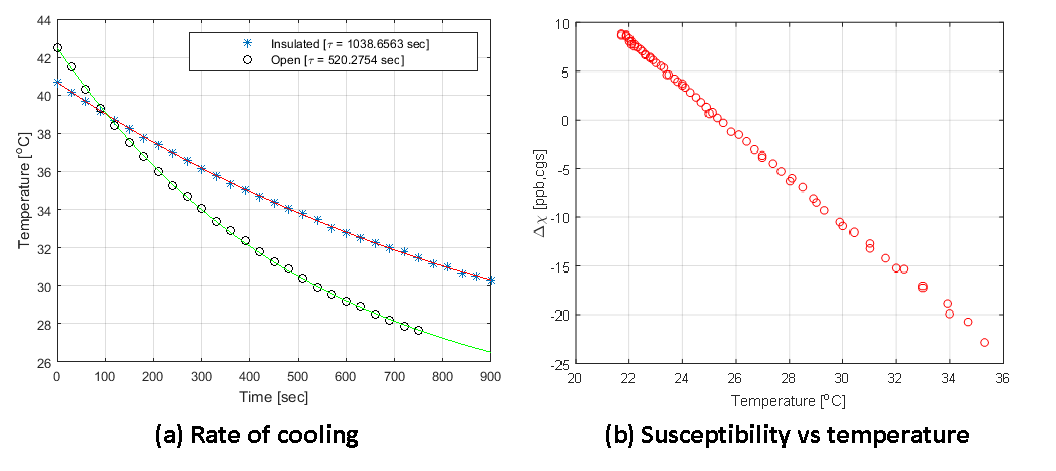
6 healthy volunteers and 6 SCD patients were recruited with informed consent. Blood samples were drawn at various oxygenation states: (1) baseline, (2) reduced oxygenation due to exercise, (3) recovery from deoxygenated state, and (4) elevated oxygenation due to oxygen inhalation. Two samples were drawn per state. Heparin was added to avoid clotting. One blood sample was taken to the hospital laboratory in a 37-degree-Celcius water bath for venous co-oximetry and blood gas testing. Furthermore, hemoglobin analysis was performed to quantify HbS, HbA, and HbF percentages. The second blood sample was placed in a water bath with a temperature maintained at 37.3 - 37.5°C for three minutes prior to imaging. All imaging was performed on a 3T Siemens mMR Biograph scanner. A custom insulated phantom holder was used to maintain the blood sample temperature. In order to measure the effectiveness of the insulated holder, a fiber-optic temperature probe was used to measure the temperature change in distilled water. For blood imaging, an 8-echo gradient recalled echo (GRE) sequence was used with TE(i)=3.36+(i-1)*4.55 ms for i = 1,2,…,8. TR=40 ms. Matrix size = 192x54. Voxel size = 0.75x0.75x5 mm. The acquisition time of the GRE sequence is 2.5 seconds. Susceptibility, Δχ, was measured through a linear fit to the unwrapped phase across the echoes. After that, Δχ0 was quantified.
A multivariate generalized linear mixed model with random patient effect was fit to the MR-measured susceptibility. For the full cohort and the patient population exhibiting sickle cell disease, the main effects included in the model were deoxygenated HbA and deoxygenated HbS, with a type I error rate of .05 for determining the regression coefficients and overall model significance. Possible interaction between the clinical predictors was statistically assessed. The univariate effect of deoxygenated HbA on the susceptibility within the controls was estimated using the same linear mixed model with random patient effect.
Results
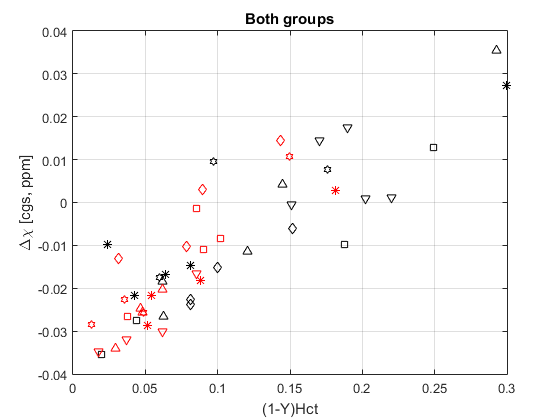
Figure 1 (a) shows that the temperature loss of samples placed in our custom holder is cut in half. Figure 1 (b) exhibits the linear relationship between susceptibility and temperature. Figure2 is a scatter plot of Δχ values obtained from all subjects. Due to a non-significant regression coefficient for the interaction term (p = 0.2765), the following reduced model was used:
Δχ = Hct(1-Y)pA Δχ0,A+ Hct(1-Y) pSΔχ0,S+ α0
where Hct is the hematocrit level, Y is the oxygenation level, pA is the percentage of HbA, pS is the percentage of HbS, Δχ0,A is the regression coefficient for deoxygenated HbA, Δχ0,S is for deoxygenated HbS, and α0 is the model intercept. SCD patients have various percentage levels of HbS (64.6-93.8%). Δχ0’s and their 95% confidence intervals were 0.302 (0.222, 0.382) [cgs, ppm] and 0.210 (0.177, 0.243) [cgs, ppm] for HbS and HbA, respectively. Δχ0 of HbS is higher than that of HbA. However, since the 95% confidence intervals overlap, this difference is not statistically significant. In the univariate analysis of the control group, Δχ0 of HbA was found to be 0.208 (0.160, 0.255) [cgs, ppm] with random patient effect.
Discussion
Thus far, Δχ0 of HbA has been reported to be within (0.18,0.27) ppm 1-3. Our result for Δχ0 of HbA (0.210 (0.177, 0.243)) is more similar to that published by Weisskoff et al1. It is also worth noting that, to the best of our knowledge, in all of the published studies, various blood oxygenation levels was achieved by ex vivo manipulation such as exposure to gases, while, in our study, oxygenation alteration was achieved in vivo before blood drawing. In addition, our statistical model accounts for repeated blood sampling from the same subject.Conclusion
The measured Δχo of HbA is consistent with literature reported range, and Δχo of HbS is greater than that of HbA. However, this difference does not reach statistical significance. Our current cohort may not provide enough statistical power to detect this difference. Our findings in this study provide a groundwork for qBOLD measurements in SCD.Acknowledgements
No acknowledgement found.References
1. Weisskoff RM, Kiihne S. MRI susceptometry: image-based measurement of absolute susceptibility of MR contrast agents and human blood. Magn Reson Med 1992; 24: 375–383
2. Spees WM, Yablonskiy DA, Oswood MC, Ackerman JJ. Water proton MR properties of human blood at 1.5 Tesla: magnetic susceptibility, T(1), T(2), T*(2), and non-Lorentzian signal behavior. Magn Reson Med 2001; 45: 533–542
3. Jain, V., Abdulmalik, O., Propert, K. J. and Wehrli, F. W. (2012), Investigating the magnetic susceptibility properties of fresh human blood for noninvasive oxygen saturation quantification. Magn Reson Med, 68: 863–867
Figures