4575
Serial MRI of Lateral Ventricular Enlargement to Measure Rate of Brain Atrophy in Patients with Ischemic Stroke1UTHealth Science Center of Houston, Houston, TX, United States
Synopsis
The primary objective of this longitudinal study is to determine the rate of ipsilesional and contralesional lateral ventricular volume (LVv) enlargement in six mild chronic ischemic stroke patients who underwent serial brain MRI at four time points over one year. Infarct volumes, National Institutes of Health Stroke Scale (NIHSS), LVv, gray matter volume (GMv) and white matter volume (WMv) were also measured. Our results show the ipsilesional increase in LVv and the decrease in WMv suggests post-stroke progression of unilateral atrophy. These changes appear to be independent of the decrease in NIHSS during this same period. This study suggests that MRI can detect pathology that is not reflected by NIHSS.
Introduction
More than 50% of stroke survivors continue to show residual neurological deficits. Post-stroke lateral ventricular (LV) enlargement has been associated with global brain atrophy and neurologic deficits. Very few studies have tracked post-stroke progression of ventricular enlargement over time and its potential relationship to lesion location, size, and severity1-2. Assessing the rate of chronic brain shrinkage is crucial for the development and monitoring of preventive interventions.
Evans index (EI) or Frontal and Occipital horn Ratio (FOR), are two measuring methods, but they are subjective and fail to provide ipsi- versus contralateral LV enlargement3. Recent development in quantitative methods using either fully or semi-automated MRI volumetry enable accurate measurement of LV enlargement, changes in gray matter (GMv) and white mater (WMv) volumes. In this study, we used serial brain MRI volumetry to measure ipsilesional and contralesional LV enlargement as well as cortical GMv and WMv to determine the rate of post-stroke brain atrophy.
Methods
Human Protection and Enrollment: The study was approved by our institutional IRB. Six patients (5 males and 1 females) labelled P1 through P6, with ischemic stroke were enrolled. National Institutes of Health Stroke Scale (NIHSS) and MRI were obtained at one, three, six and 12 months after stroke onset.
MRI Data Acquisition Protocol: MRI scans were performed on 3.0 T Philips Intera (Philips Healthcare, Best, The Netherlands) using 8-channel head coil. The imaging protocol included 3D high-resolution T1-weighted (TE/TR=3.66ms/8.2sec), T2-weighted (TE/TR= 251ms/2.5sec) and fluid-attenuated inversion recovery (FLAIR; TE/TR/TI=294 ms/4.8 sec/1.6 sec). All images were acquired with field-of-view (FOV) = 256 mm x 256 mm and acquisition matrix = 256 x 256 x 180.
Lesions, LV, GM, WM Volume Measurements: The T1w, T2w, and FLAIR images at one month were registered to the later follow-up scans using SPM12 (http://www.fil.ion.ucl.ac.uk/spm/software/spm12/). Infarct volumes were measured on 3D FLAIR images by two raters using region-growing algorithm. The LV volume (LVv), GMv, and WMv were measured by automated brain segmentation of high resolution T1 weighted structural images using FreeSurfer v5.3.0 (http://surfer.nmr.mgh.harvard.edu/). The LVv was also delineated manually for the reliability and quality assurance. The contralesional measurements served as control. Volumes were normalized to the intracranial volume and reported as percent change. The rate of atrophy was measured by subtracting the images acquired at latter time points from the first time point images.
Results
The patients had
baseline NIHSS scores in the range 4-20. A Pearson’s correlation showed a high
concordance of 0.92 between manual and automated LV volumes. The median infarct
volumes at 1 and 12 month were 16.5 ml (range 10.3 – 42.5 ml) and 15.16 ml (6.0
– 53.7 ml), respectively. There was no significant change in infarct volume
between 1 and 12 months (paired t-test, p-value = 0.726).
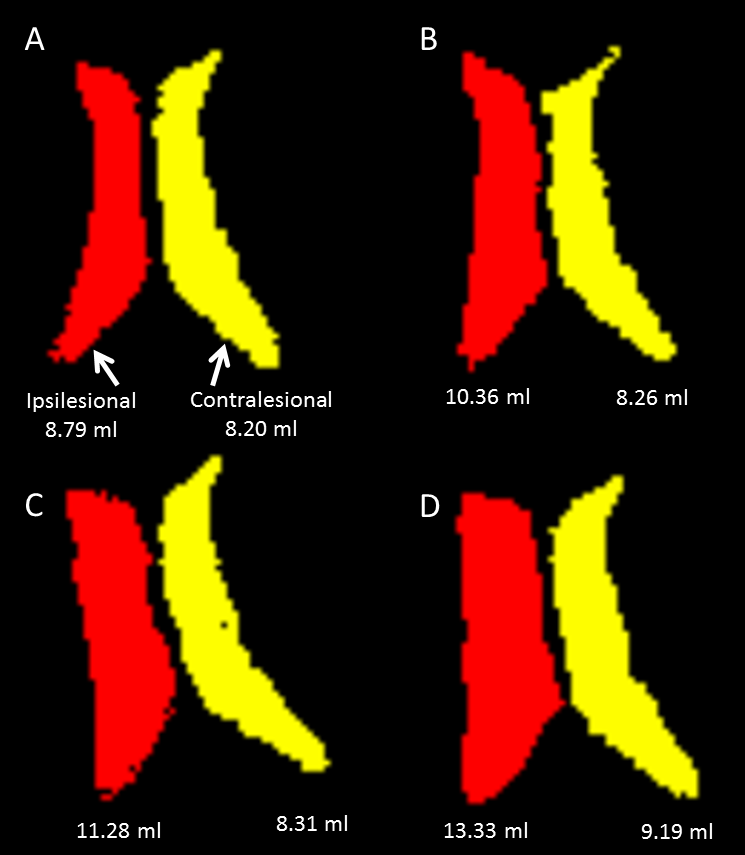
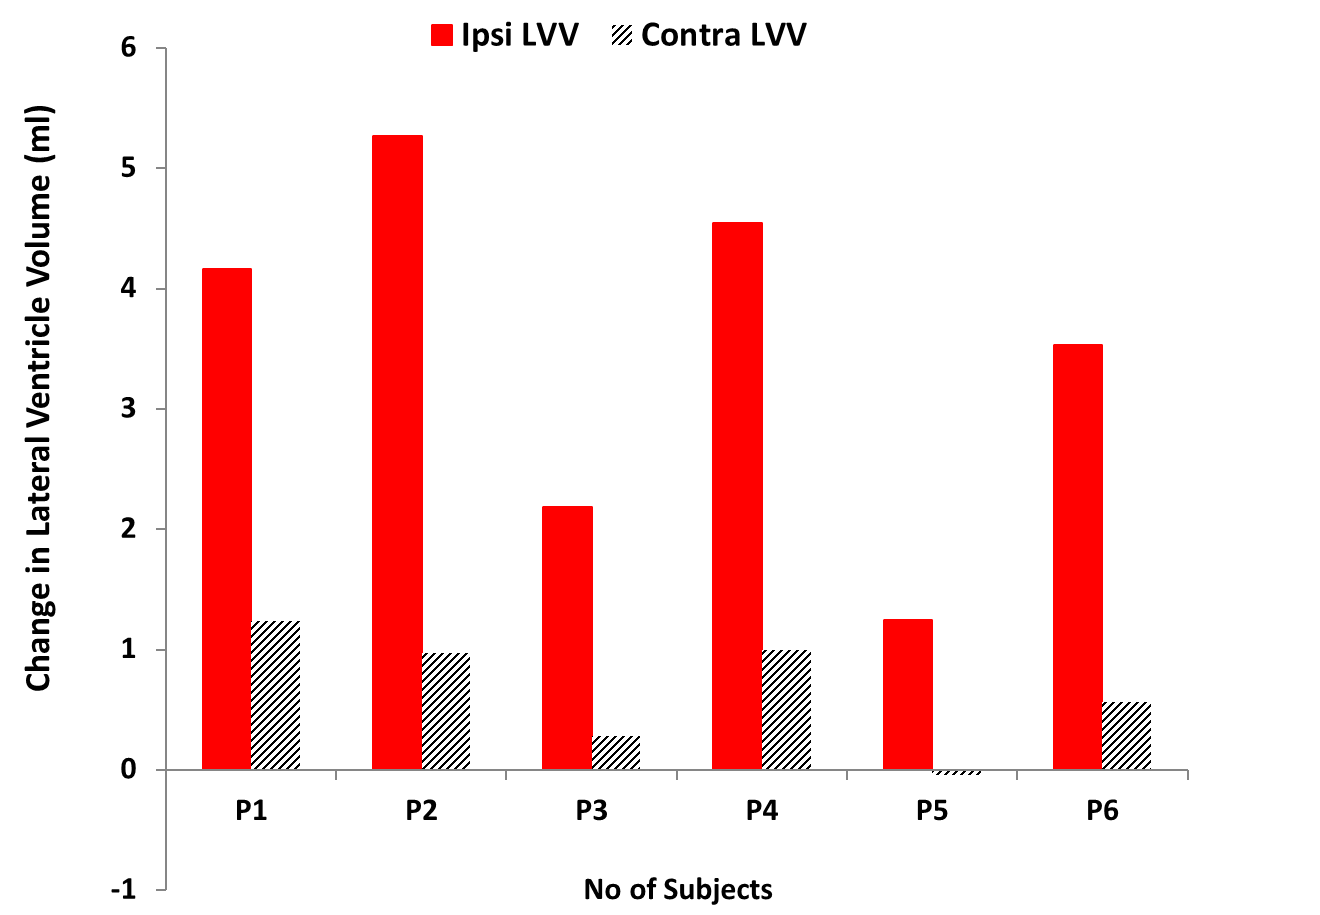
Lateral Ventricle Volume: Figure 1 demonstrates progressive ipsilesional (red) LV enlargement, with minimal change in the contralesional LV (yellow) in on patient, P4, who was enrolled with severe disability with an NIHSS score of 20. Fig. 2 illustrates the ipsi- and contralesional absolute LV enlargement (∆LVv) over 12 months for each patient. The maximum increase in ipsilesional LVv was recorded in P2 (5.3 ml) with largest lesion volume (42.5 ml) and NIHSS of 4 at 1 month, whereas the minimum was in P5 (1.23 ml) with relatively small lesion volume (14.2 ml) and NIHSS of 5 at 1 month. There was a significant increase (P<0.05) in ipsilesional LVv enlargement compared to the contralesional.
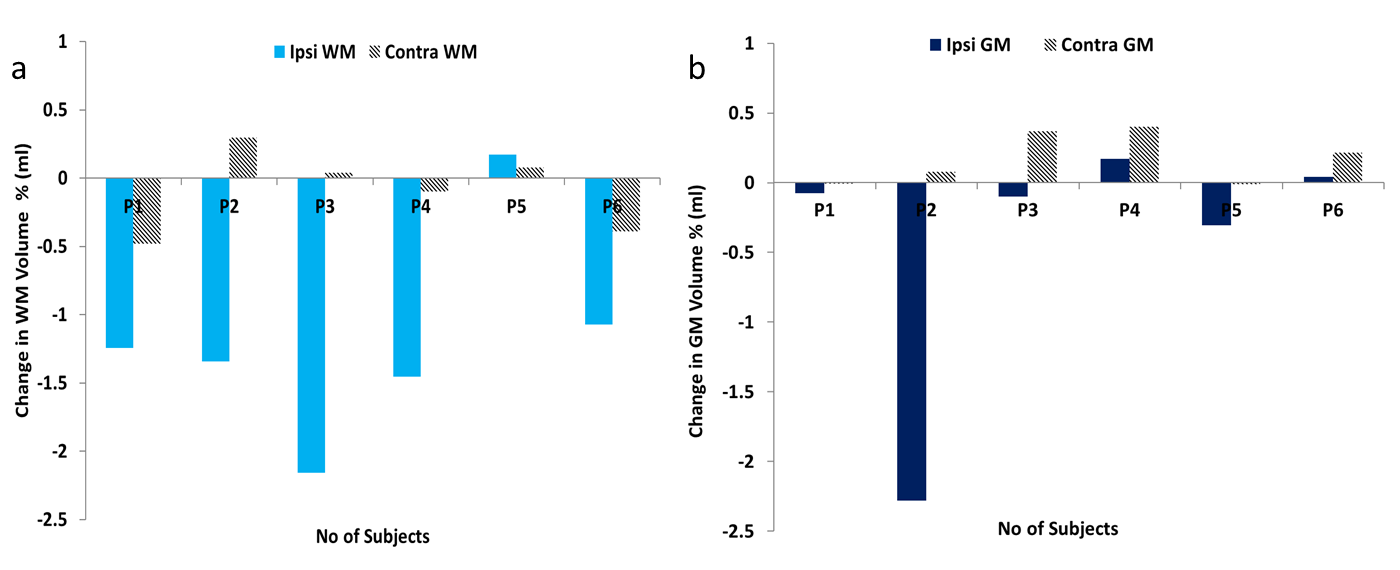
GM and WM Volume: Figure 3 shows percent volume change in the ipsi- and contralesional cortical white matter (3a) and gray matter (3b). The maximum decrease in ipsilesional WMv and GMv was recorded in P2 -2.15% and -2.28% respectively. There was a significant decrease (P<0.05) in ipsilesional WMv compared to the contralesional, but not in GMv (P=0.15).
Discussion
Serial MR imaging enabled the assessment of the rate of unilateral ventricular enlargement, and demonstrated the continual unilateral LV enlargement and decreased WMv in stroke patients despite continual decline in NIHSS. These measurements provide evidence of the underlying chronic pathological progression, and underscore the value of serial MRI volumetry as a noninvasive tool for monitoring secondary complications. These chronic changes measured with MRI may provide insight into permanent brain injury that was not detected with the clinical scores that showed a decrease in deficits on the traditional stroke severity score, NIHSS, over 12 month. Finally, the high correlation between manual and automated LVv measurement demonstrates the reliability of the semi-automated methods.Acknowledgements
This work is funded by the Bentsen Stroke Program at UT-HEALTH, Howard Hughes Medical Institute.References
1. Zhang X, Ding L, Yang L, et al. Brain Atrophy Correlates with Severe Enlarged Perivascular Spaces in Basal Ganglia among Lacunar Stroke Patients. PloS one 2016;11:e0149593.
2. Breteler MM, van Amerongen NM, van Swieten JC, et al. Cognitive correlates of ventricular enlargement and cerebral white matter lesions on magnetic resonance imaging. The Rotterdam Study. Stroke; a journal of cerebral circulation 1994;25:1109-1115.
3. Ambarki K, Israelsson H, Wahlin A, Birgander R, Eklund A, Malm J. Brain ventricular size in healthy elderly: comparison between Evans index and volume measurement. Neurosurgery 2010;67:94-99; discussion 99.
Figures