4573
Cerebral perfusion and reactivity in Impaired Glucose Tolerance and Type-2 Diabetes using arterial spin labeling1Academic Unit of Radiology, University of Sheffield, Sheffield, United Kingdom, 2Neuroimaging in Cardiovascular Disease (NICAD) Network, University of Sheffield, Sheffield, United Kingdom, 3Department of Psychology, University of Sheffield, Sheffield, United Kingdom, 4Academic Unit of Diabetes, University of Sheffield, Sheffield, United Kingdom
Synopsis
This study evaluates cerebral perfusion and cerebrovascular reserve (CVR) in impaired glucose tolerance and patients with type-2 diabetes using QUASAR Arterial Spin Labeling. CVR was evaluated as the change in gray matter CBF in response to a pharmacological stimulus. The developed processing pipeline was based on published QUASAR theory, modified to account for excessive motion and partial volume effects. Results show that baseline CBF is within the expected range. In patients with T2DM and IGT there is a significantly lower value of Cerebrovascular Reserve compared to healthy, normoglycaemic individuals.
Background
Type-2 diabetes mellitus (T2DM) affects 415 million people globally and complications include cardiovascular disease, stroke and variations in cognition[1]. Insulin resistance which characterizes T2DM may affect vascular endothelial cell vasodilatory function. Impaired Glucose Tolerance (IGT) is a pre-diabetic condition also characterized by insulin resistance. One of the ways to assess endothelial function is to use a vasodilating stimulus such as acetazolamide (ACZ) and evaluate any resultant change in Cerebral Blood Flow (CBF). The difference between baseline perfusion and perfusion after ACZ injection is indicative of Cerebrovascular Reserve (CVR) or Reactivity. Arterial Spin Labeling (ASL) has emerged over the past 20 years as an endogenous contrast agent-based technique for perfusion evaluation. Quantitative STAR Labeling of Arterial Regions (QUASAR) ASL [2] is an ASL variant, which samples the output signal at multiple time-points rendering the technique robust to changes in arterial transit time. ASL has been proved adept for quantification of CBF in GM.Purpose
This study aims to: a) unravel pathophysiological patterns in cerebral perfusion and cerebrovascular reserve (CVR) using QUASAR ASL and b) evaluate changes in brain volume using structural MRI, associated with T2DM and IGT.
Methods
Data from 42 volunteers (10 IGT subjects, 12 T2DM patients and 20 matched normoglycaemic controls (HV)) were collected at 3T (Achieva, Philips Healthcare,Best, NL ). The MR protocol comprised of the following scans: 4 QUASAR ASL scans (TR/TE/ΔTI/TI1 =4000/23/300/40ms, voxel size=3.75*3.75*7mm3, 64*64 matrix, 7 slices, 13 timepoints, 84 dynamics, FA:35/11.7o) and one 3D MPRAGE scan (TR/TE = 7.1/3.2ms, FA = 8°, isotropic voxel=0.9mm3, Matrix = 256x256,180 slices). The first QUASAR scan was acquired at baseline, subsequently intravenous ACZ was injected to the participants over a 15min period, followed by 3 further QUASAR scans.
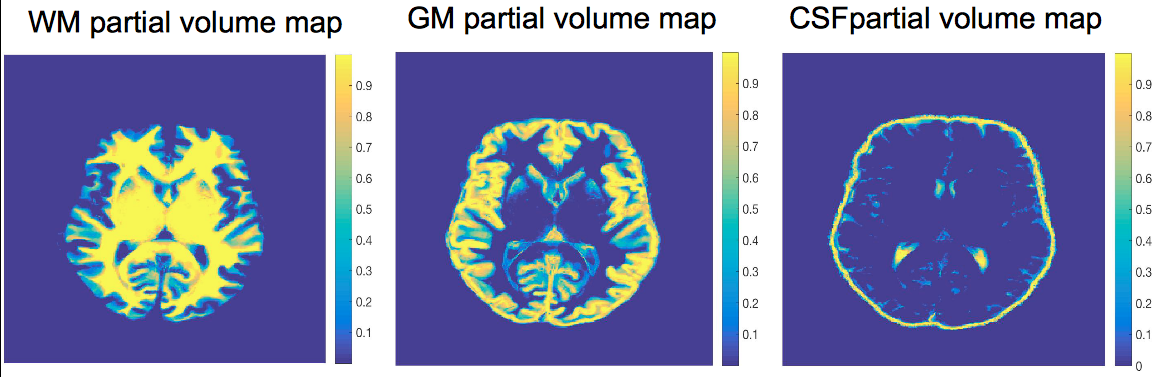
The data were processed using in-house software based on Petersen et al theory [2] modified to account for the presence of an EPI artifact and low signal to noise ratio. A technique was used for partial volume correction based on Asllani et al [3]. Partial volume maps were generated using spatial fuzzy c-means (SFCM) clustering of the high resolution MPRAGE image (fig.1) [4]. CBF was calculated for each scan for GM. CVR was evaluated as the percentage difference between the first and the maximum CBF value of the 3 post-ACZ scans. Total brain volume and GM volume were calculated using the PV maps generated using SFCM clustering. Group mean comparisons for GM and total brain volume were made using one-way analysis of variance (ANOVA) and for CVR using analysis of co-variance (ANCOVA) to include as a covariate GM volume to assess possible influences of atrophy.
Results
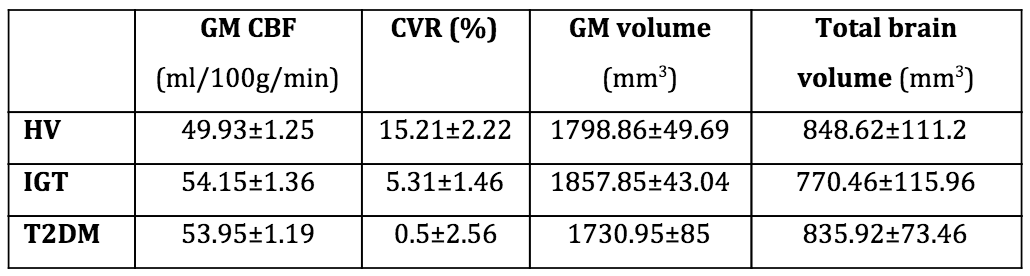
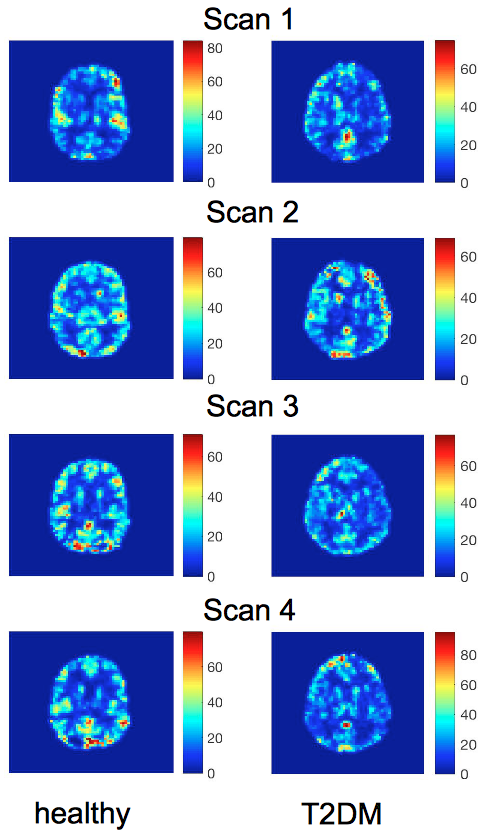
Results about GM CBF at baseline, CVR, GM and total brain volume can be found in table 1. Administration of ACZ demonstrated significant differences in GM mean CVR between the groups (p<0.01), with the GM volume being non-significant (p=0.84) (example CBF maps shown in Fig.2). Total brain volume and GM volume were not significantly different between groups (total: p=0.43, GM: p=0.13).Discussion
In this study QUASAR ASL, which is robust to arterial transit time was used. In terms of the CBF results, the values are in line with the upper reported limit potentially due to the fact that partial volume correction was used. GM CVR was significantly different between the considered groups, with IGT and T2DM subjects having lower CVR than HV, similar to previously reported findings [5, 6]. Three post-ACZ scans were performed, accounting for the different inter-subject response times to a vasodilating stimulus. These findings suggest alteration in endothelial response to a pharmacological agent dependent on glycaemic status. This is an important observation, particularly for IGT which has a similar pattern in perfusion parameters as T2DM.Conclusions
QUASAR ASL is a promising technique for evaluation of perfusion in conditions such as diabetes as it is insensitive to arterial transit time. Using this perfusion imaging technique, we have shown that GM CVR is reduced in T2DM and in IGT compared to healthy individuals. This finding implies that there is impaired endothelial function in IGT and T2DM. To validate this finding a larger cohort will have to be examined.Acknowledgements
No acknowledgement found.References
1. Diabetes UK, Diabetes: Facts and Stats, 2015. https://www.diabetes.org.uk/About_us/What-we-say/Statistics/
2. Petersen, E.T., T. Lim, and X. Golay, Model-free arterial spin labeling quantification approach for perfusion MRI. Magnetic Resonance in Medicine, 2006. 55(2): p. 219-232.
3. Asllani, I., A. Borogovac, and T.R. Brown, Regression algorithm correcting for partial volume effects in arterial spin labeling MRI. Magn Reson Med, 2008. 60(6): p. 1362-71.
4. Chuang, K.S., et al., Fuzzy c-means clustering with spatial information for image segmentation. Comput Med Imaging Graph, 2006. 30(1): p. 9-15.
5. Last, D., et al., Global and Regional Effects of Type 2 Diabetes on Brain Tissue Volumes and Cerebral Vasoreactivity. Diabetes Care, 2007. 30 (5): p. 1193-99.
6. Selvarajah, D., et al., A preliminary study of brain macrovascular reactivity in impaired glucose tolerance and type-2 diabetes: Quantitative internal carotid artery blood flow using magnetic resonance phase contrast angiography. Diab Vasc Dis Res, 2016.
Figures