4572
Slower Information Processing Speed is related to White-Matter Integrity in Sickle Cell Disease1Developmental Neurosciences, UCL Great Ormond Street Institute of Child Health, London, United Kingdom
Synopsis
Sickle cell disease (SCD) is associated with stroke1 and slower processing2. Slower processing in the absence of stroke may be related to hypoxic-ischaemic white-matter (WM) injury3. Cognitive assessments and tract-based spatial statistics analyses using diffusion tensor imaging (DTI), were conducted in 84 patients with SCD, stratified by degree of hypoxic-anaemic exposure. Processing speed indices (PSI) were related to WM integrity, and there were differences in PSI and WM integrity as a function of daytime oxygen-desaturation, but not SCI. The results provide links between oxygen desaturation, PSI, and WM integrity, and may indicate amelioration of function by interventions that reduce hypoxic exposure.
BACKGROUND
Sickle cell disease (SCD) is associated with silent cerebral infarction (SCI)1 and cognitive impairments4. Slower processing was recently identified as the most prominent cognitive impairment in adults with SCD without SCI2. Slower processing in the absence of infarction is not well understood, but may be related to hypoxic-ischaemic white-matter (WM) injury3.
This study aimed to investigate differences in WM microstructure and processing speed between children with SCD, grouped by presence of SCI and degree of hypoxic-ischaemic exposure. It was hypothesised that there are processing speed deficits in SCD irrespective of presence of SCI, and that the degree of deficit is related to hypoxic-ischaemic exposure and to WM integrity.
METHODS
Participants
84 patients with SCD, aged 8-35 years (Median=16.00, SD=6.03, 40 Male), underwent cognitive assessment and MRI.
Cognitive & Haematological Measures
Indices of processing speed (PSI) were derived from the Wechsler Intelligence Scales5&6. Daytime oxygen saturation (SpO2) was measured on the day of cognitive testing using a pulse oximeter (Masimo Pronto-7). Steady-state haematocrit (Hct) was recorded from patient medical records using the closest available blood count (Mean lag time=36 days). Patients were separated in groups as those with high vs. low haematocrit and SpO2 based on the median. Post-code based multiple-deprivation indices were obtained to correct for differences in socio-economic status 7.
MRI ACQUISITION
Magnetic resonance imaging was conducted on the day of cognitive testing on a 3T Siemens Prisma with 80 mT/m gradients and a 64-channel receive headcoil. The MRI protocol included axial T2-weighted (TR=8420ms, TE=68ms, voxel size=0.51x0.51x5.6mm), fluid-attenuated inversion recovery (FLAIR; TR=5000ms, TE=395ms, voxel size=0.65x1x0.65mm), and diffusion-weighted (TR=3050ms, TE=60ms, 2 shells at b=1000s/mm2 & b=2200s/mm2 with 13 interleaved b=0 images, voxel size=2x2x2mm) sequences. To evaluate presence of SCI, a neuroradiologist evaluated each participant’s FLAIR and T2 MRI.
DTI
Susceptibility-induced distortions and eddy-currents were corrected using FSL (FMRIB, Oxford, UK). Maps for DTI parameters were generated by fitting a diffusion tensor model to each voxel via a weighted least squares method. DTI parameters were analysed using a whole-brain voxel-wise TBSS approach8. Threshold-free cluster enhancement was used to correct for multiple comparisons.
RESULTS
Neurocognition
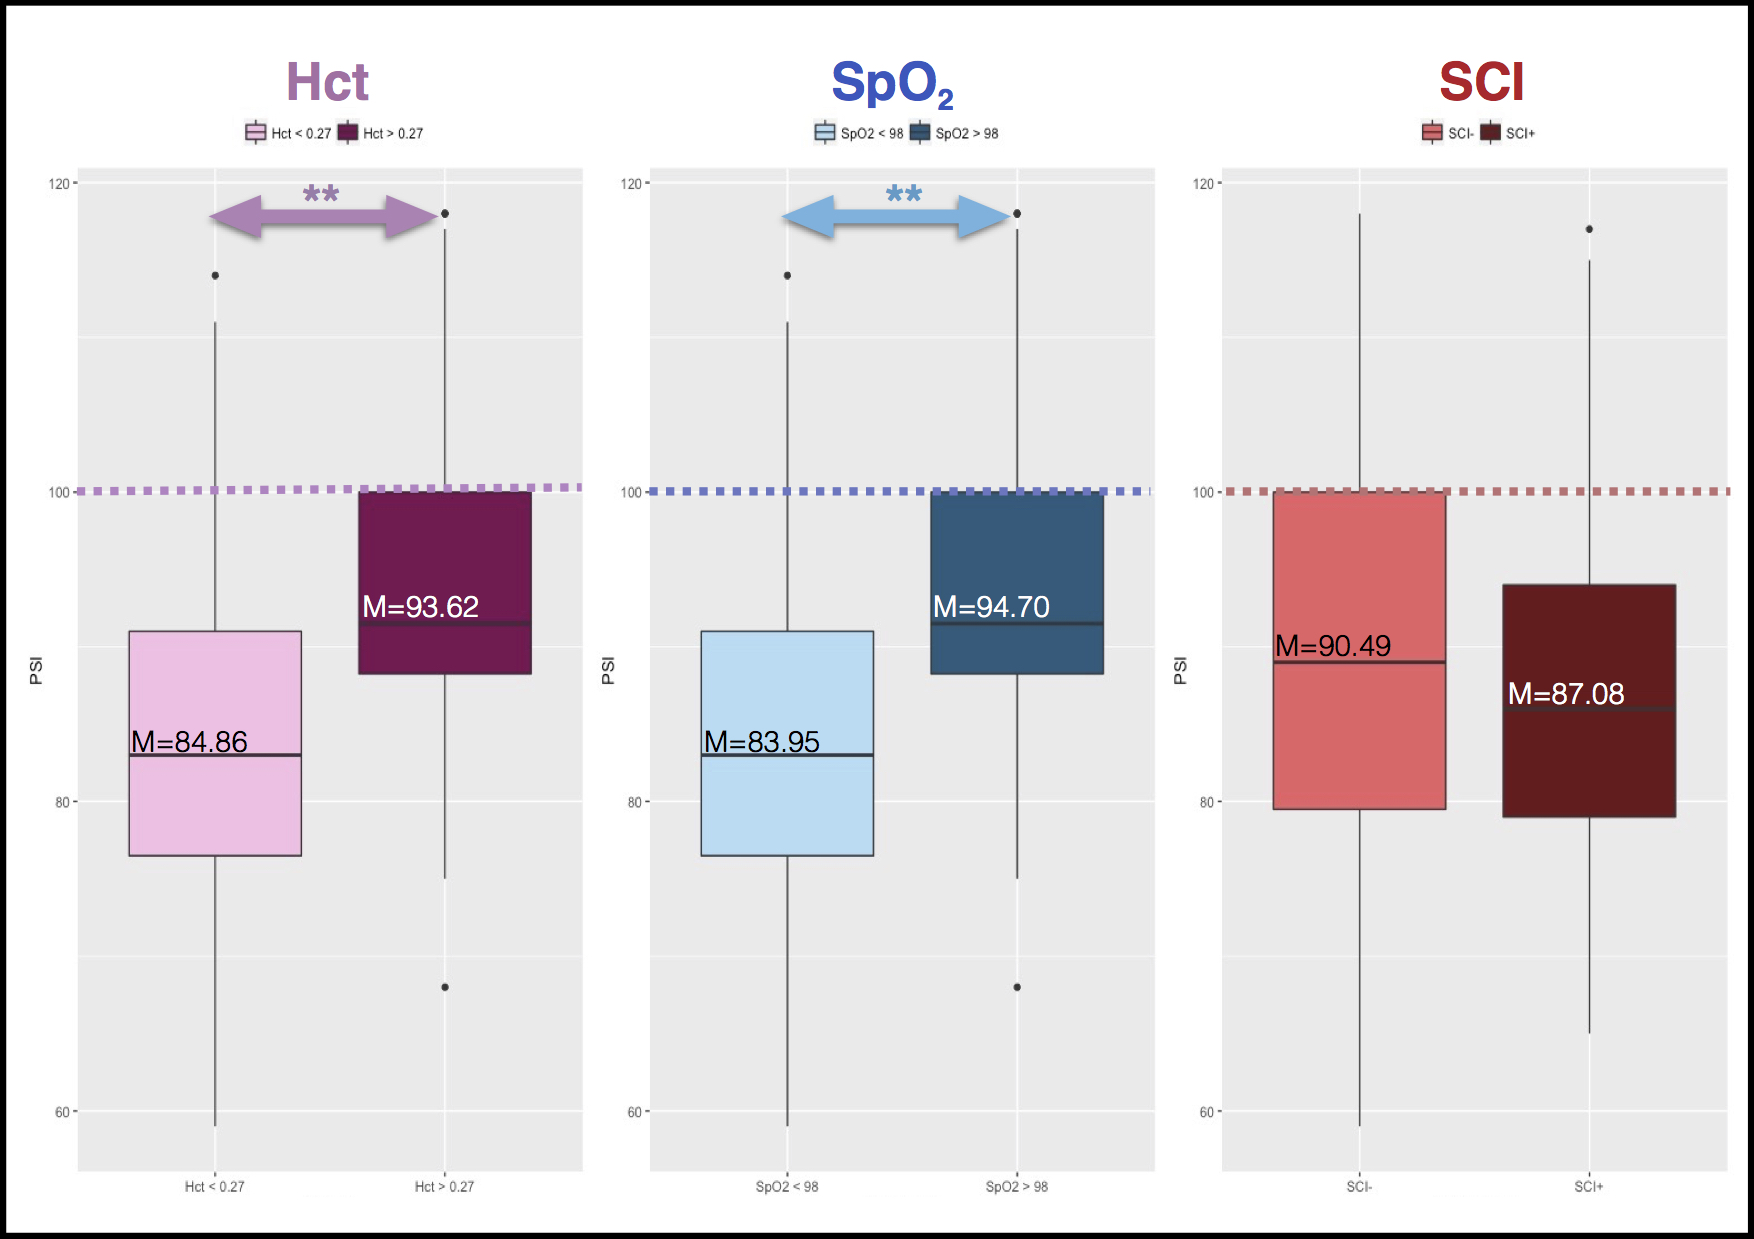
Mean PSI was below published norms for the general population5-6(M=88.97, SD=13.58; low-average range). Patients with SpO2 <98% had significantly lower PSI than those with SpO2 >98%. Similarly, patients with more severe anaemia (Hct <0.27) had significantly lower PSI than those with less severe anaemia (Hct > 0.27). 37 patients were identified with SCI, but there were no significant differences in PSI between patients with (SCI+) and without SCI (SCI-, Figure 1).
Structural Comparisons
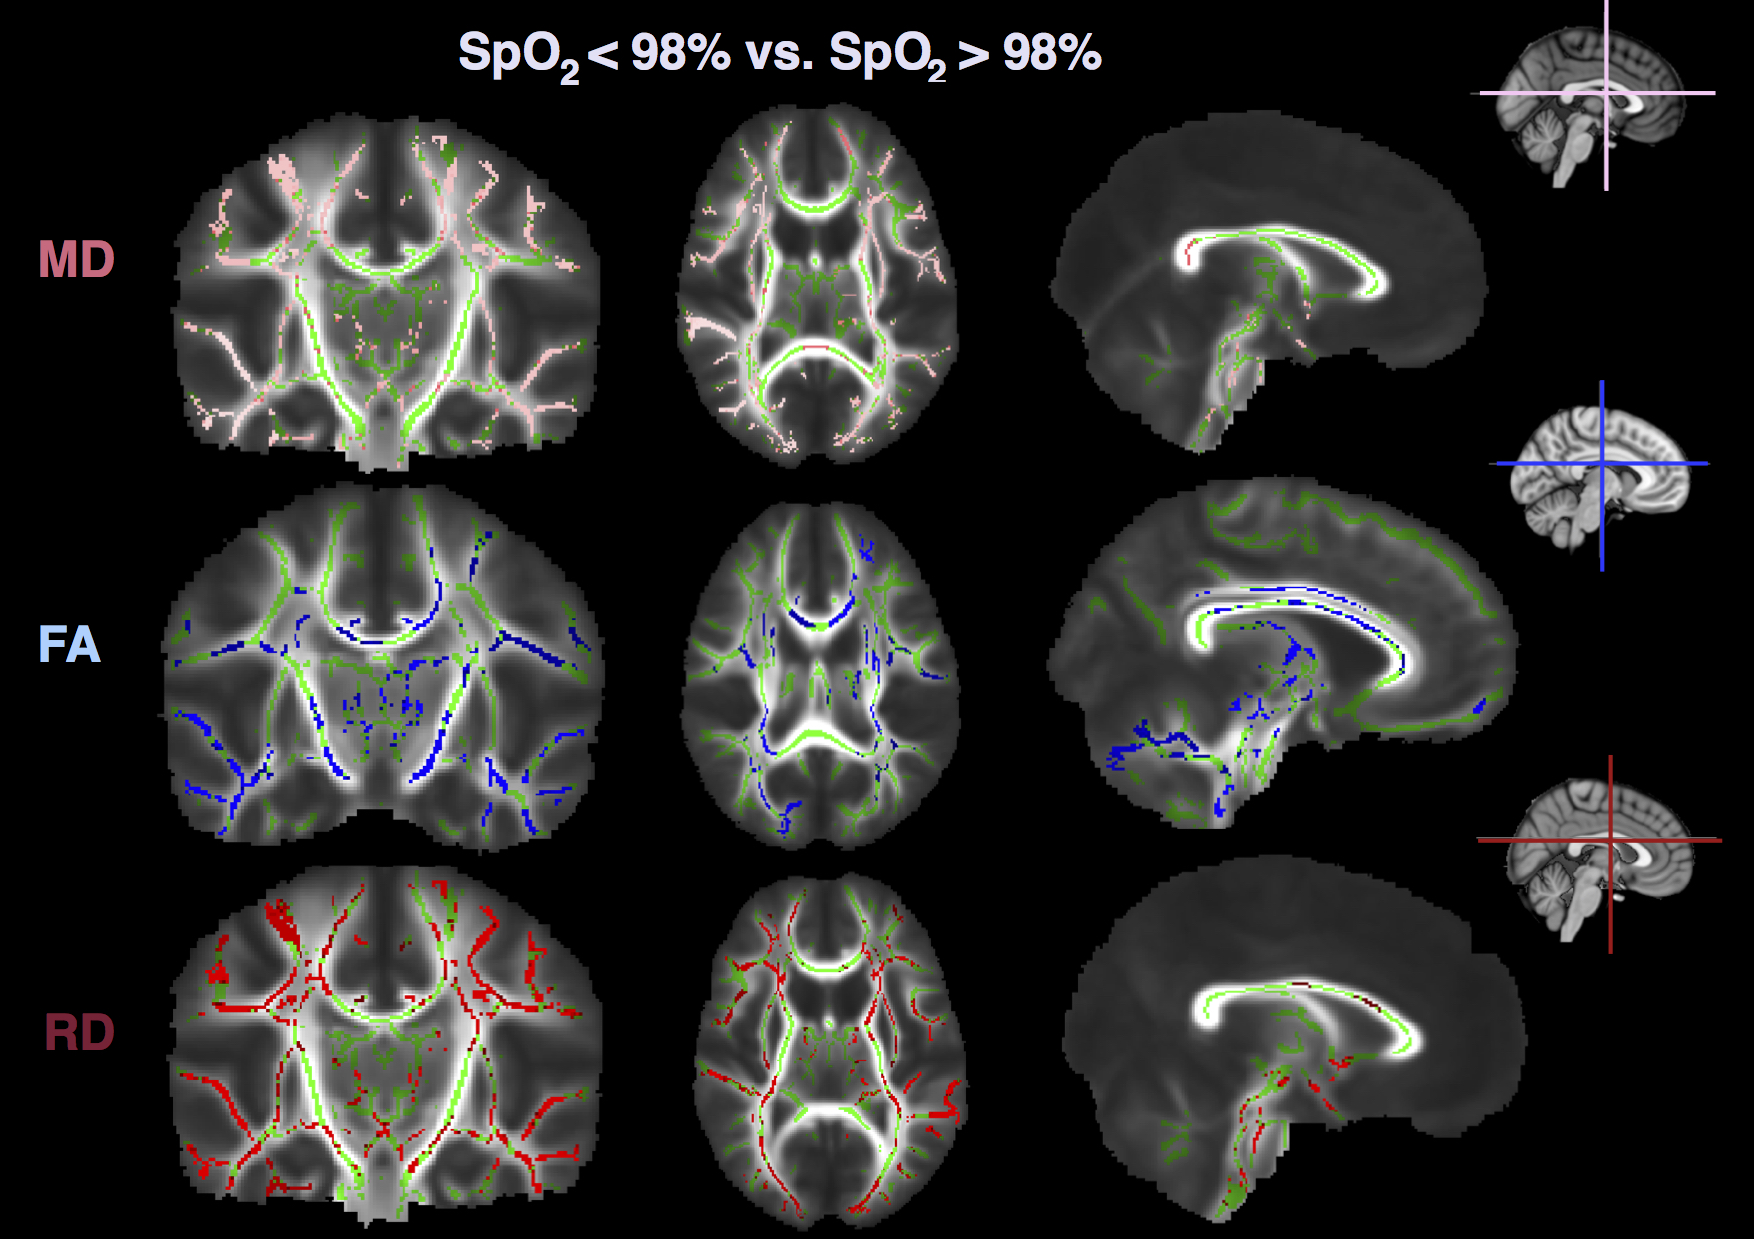
There were significant differences in fractional anisotropy (FA), radial diffusivity (RD), and mean diffusivity (MD) between patients with SpO2<98% and SpO2>98% (Figure 2). Specifically, in those with SpO2 <98%, FA was lower, whereas RD and MD were higher, in widespread regions, including the internal capsule, corpus callosum, and the superior and inferior longitudinal fasciculi (all p<0.05). There were no differences in axial diffusivity, or as a function of haematocrit or SCI.
Brain Microstructure Correlates with Processing Speed
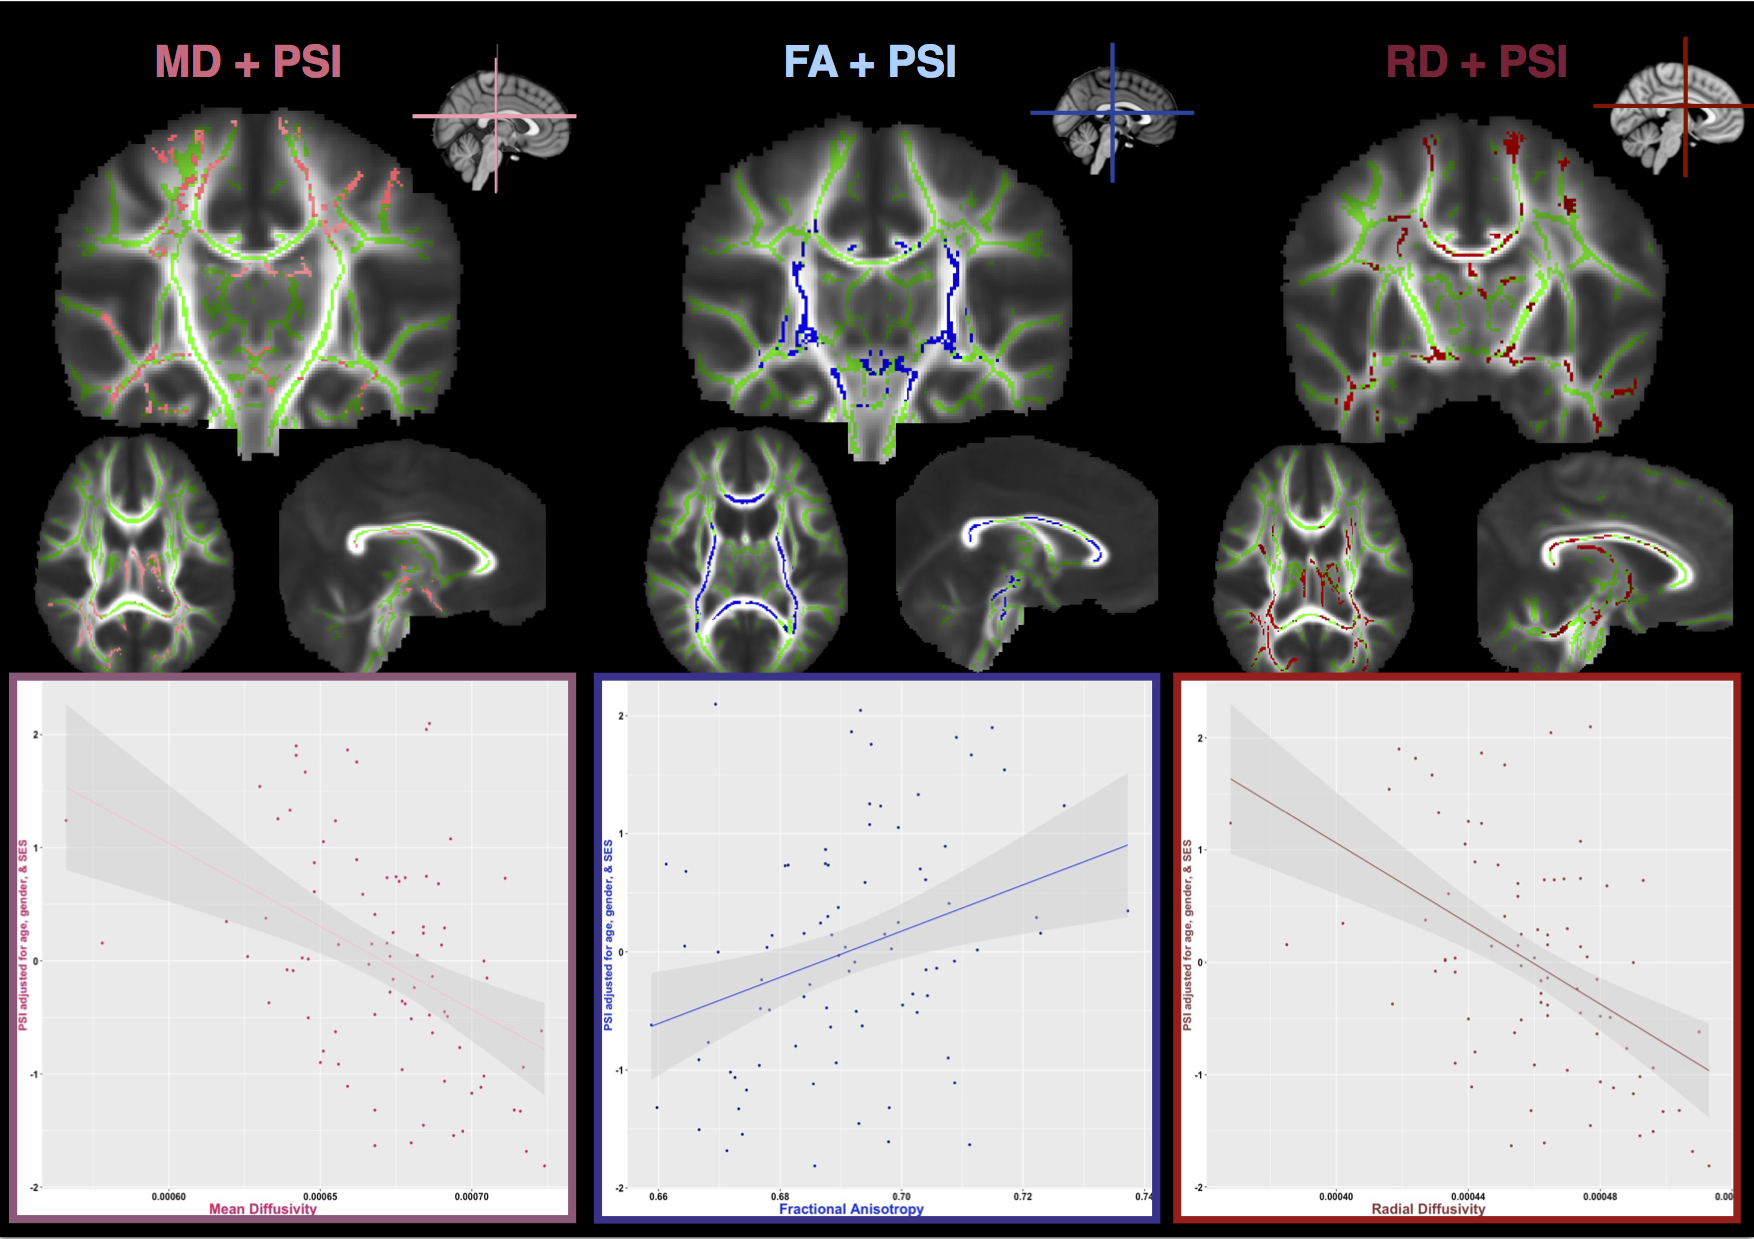
PSI was significantly correlated with FA, MD, and RD. Specifically, there was a positive correlation between FA and PSI across the internal capsule and in the body of the corpus callosum (r(84)=0.325, p=0.003) and negative correlations between MD (r(84)=-0.431, p=0.0001) and RD (r(84)=-0.491, p=0.0001) and PSI, in more widespread regions, including the corona radiata, and corpus callosum, respectively (Figure 3).
DISCUSSION
This is the first study in SCD to link deficits in processing speed with oxygen desaturation and DTI parameters. The results confirmed that the degree to which processing is slower relates to WM integrity, as measured by FA, MD, and RD, and to disease severity, as measured by haematocrit and SpO2.
The findings are in agreement with a previous DTI study3, where links between oxygen desaturation and radial diffusivity were found. This study makes a novel contribution, suggesting a relationship between WM microstructure and cognition. While lesion status is commonly used as a proxy of disease severity8, the results indicate cognitive and WM differences in the absence of SCI. This study identifies processing speed as a vulnerable domain in SCD, and patients with anaemia and oxygen desaturation to be at risk of deficit. The results suggest that amelioration of cognitive dysfunction may be possible via interventions that reduce anaemic and/or hypoxic exposure.
CONCLUSION
This study suggests relationships between oxygen desaturation, WM microstructure and processing speed in SCD. DTI metrics and PSI may serve as useful biomarkers for future clinical trials of reducing hypoxic exposure.Acknowledgements
No acknowledgement found.References
1. Miller, S. T., Macklin, E. A., Pegelow, C. H., Kinney, T. R., Sleeper, L. A., Bello, J. A., . . . DeBaun, M. R. (2001). Silent infarction as a risk factor for overt stroke in children with sickle cell anemia: a report from the Cooperative Study of Sickle Cell Disease. J Pediatr, 139(3), 385-390. doi: 10.1067/mpd.2001.117580
2. Vichinsky, E. P., Neumayr, L. D., Gold, J. I., Weiner, M. W., Rule, R. R., Truran, D., . . . Armstrong, F. D. (2010). Neuropsychological dysfunction and neuroimaging abnormalities in neurologically intact adults with sickle cell anemia. Jama, 303(18), 1823-1831. doi: 10.1001/jama.2010.562
3. Kawadler, J. M., Kirkham, F. J., Clayden, J. D., Hollocks, M. J., Seymour, E. L., Edey, R., . . . Clark, C. A. (2015). White Matter Damage Relates to Oxygen Saturation in Children With Sickle Cell Anemia Without Silent Cerebral Infarcts. Stroke, 46(7), 1793-1799. doi: 10.1161/strokeaha.115.008721
4. Berkelhammer, L. D., Williamson, A. L., Sanford, S. D., Dirksen, C. L., Sharp, W. G., Margulies, A. S., & Prengler, R. A. (2007). Neurocognitive sequelae of pediatric sickle cell disease: a review of the literature. Child Neuropsychol, 13(2), 120-131. doi: 10.1080/09297040600800956
5. Wechsler, D. (2003). Wechsler intelligence Scale for children–fourth edition. Bloomington, MN: Pearson.
6. Wechsler, D. (2008). Wechsler adult intelligence scale-fourth edition. San Antonio, TX: The Psychological Corporation.
7. Department for Communities and Local Government (2015) English Indices of Deprivation 2015. DETR, London
8. Smith, S. M., Jenkinson, M., Johansen-Berg, H., Rueckert, D., Nichols, T. E., Mackay, C. E., . . . Behrens, T. E. (2006). Tract-based spatial statistics: voxelwise analysis of multi-subject diffusion data. Neuroimage, 31(4), 1487-1505. doi: 10.1016/j.neuroimage.2006.02.024
9. DeBaun, M. R., Armstrong, F. D., McKinstry, R. C., Ware, R. E., Vichinsky, E., & Kirkham, F. J. (2012). Silent cerebral infarcts: a review on a prevalent and progressive cause of neurologic injury in sickle cell anemia. Blood, 119(20), 4587-4596. doi: 10.1182/blood-2011-02-272682
10. Oluwole, O. B., Noll, R. B., Winger, D. G., Akinyanju, O., & Novelli, E. M. (2016). Cognitive functioning in children from Nigeria with sickle cell anemia. Pediatr Blood Cancer, 63(11), 1990-1997. doi: 10.1002/pbc.26126
11. Ruffieux, N., Njamnshi, A. K., Wonkam, A., Hauert, C. A., Chanal, J., Verdon, V., . . . Sztajzel, R. (2013). Association between biological markers of sickle cell disease and cognitive functioning amongst Cameroonian children. Child Neuropsychol, 19(2), 143-160. doi: 10.1080/09297049.2011.640932
12. Schatz, J., Finke, R. L., Kellett, J. M., & Kramer, J. H. (2002). Cognitive functioning in children with sickle cell disease: a meta-analysis. J Pediatr Psychol, 27(8), 739-748.
Figures