4570
Cerebral perfusion characteristics show differences in younger vs. older children with sickle cell anaemia: results from a multiple inflow-time arterial spin labelling study1Developmental Neurosciences, UCL Great Ormond Street Institute of Child Health, London, United Kingdom
Synopsis
Sickle cell disease (SCD) is associated with chronic anaemia and oxygen desaturation, which elevates cerebral blood flow (CBF) and increases risk of stroke. Cerebral haemodynamics are abnormal and techniques for assessing CBF using a single inflow-time may not be sufficient. This study investigated haemodynamic parameters from a multi-inflow-time acquisition in younger and older children with SCD and healthy controls. CBF was elevated globally in both groups of patients, but in older children, patients had significantly shorter bolus arrival time. This may indicate increasing disparity between patients and controls with age and may be related to longer standing burden of disease.
Purpose
Sickle cell disease (SCD) is associated with lifelong haemolytic anaemia and oxygen desaturation. There is a high rate of neurological complications in childhood, including an incidence of stroke in up to 10%1 and silent cerebral infarction in up to 35% of patients. As an adaptive response to chronic anaemia, vessels dilate and cerebral blood flow velocity, as measured by transcranial Doppler, is increased, which also increases risk of stroke2. During acute clinical events when metabolic rate is high, reduced cerebrovascular reserve3 may result in tissue ischaemia, especially in the arterial borderzones. Low oxygen saturation (SpO2) has also been identified as a risk factor for stroke4 and has also been associated with cognitive dysfunction5 and compromised white matter integrity6. Global cerebral blood flow (CBF), as measured by non-invasive arterial spin labelling (ASL) perfusion, is generally elevated in SCD7–9; however, ASL acquisition, CBF quantification and arterial territory segmentation techniques have differed. All previous studies have measured CBF using one7,9 or two8 inflow-times (TI). In patients with SCD, the passage of labelled blood through cerebral vasculature is likely abnormal3,10, and measurements at a single TI may not be sufficient to fully characterise these altered haemodynamics. Furthermore, cerebral haemodynamics and related ASL parameters change throughout childhood, which may be related to normal developmental processes11. The purpose of this study was to investigate haemodynamic parameters from a multi-TI pulsed ASL acquisition (i.e. CBF, bolus arrival time [BAT] and the temporal width of the labelled blood bolus [τ]) in a sample of paediatric patients with SCD and controls.Methods
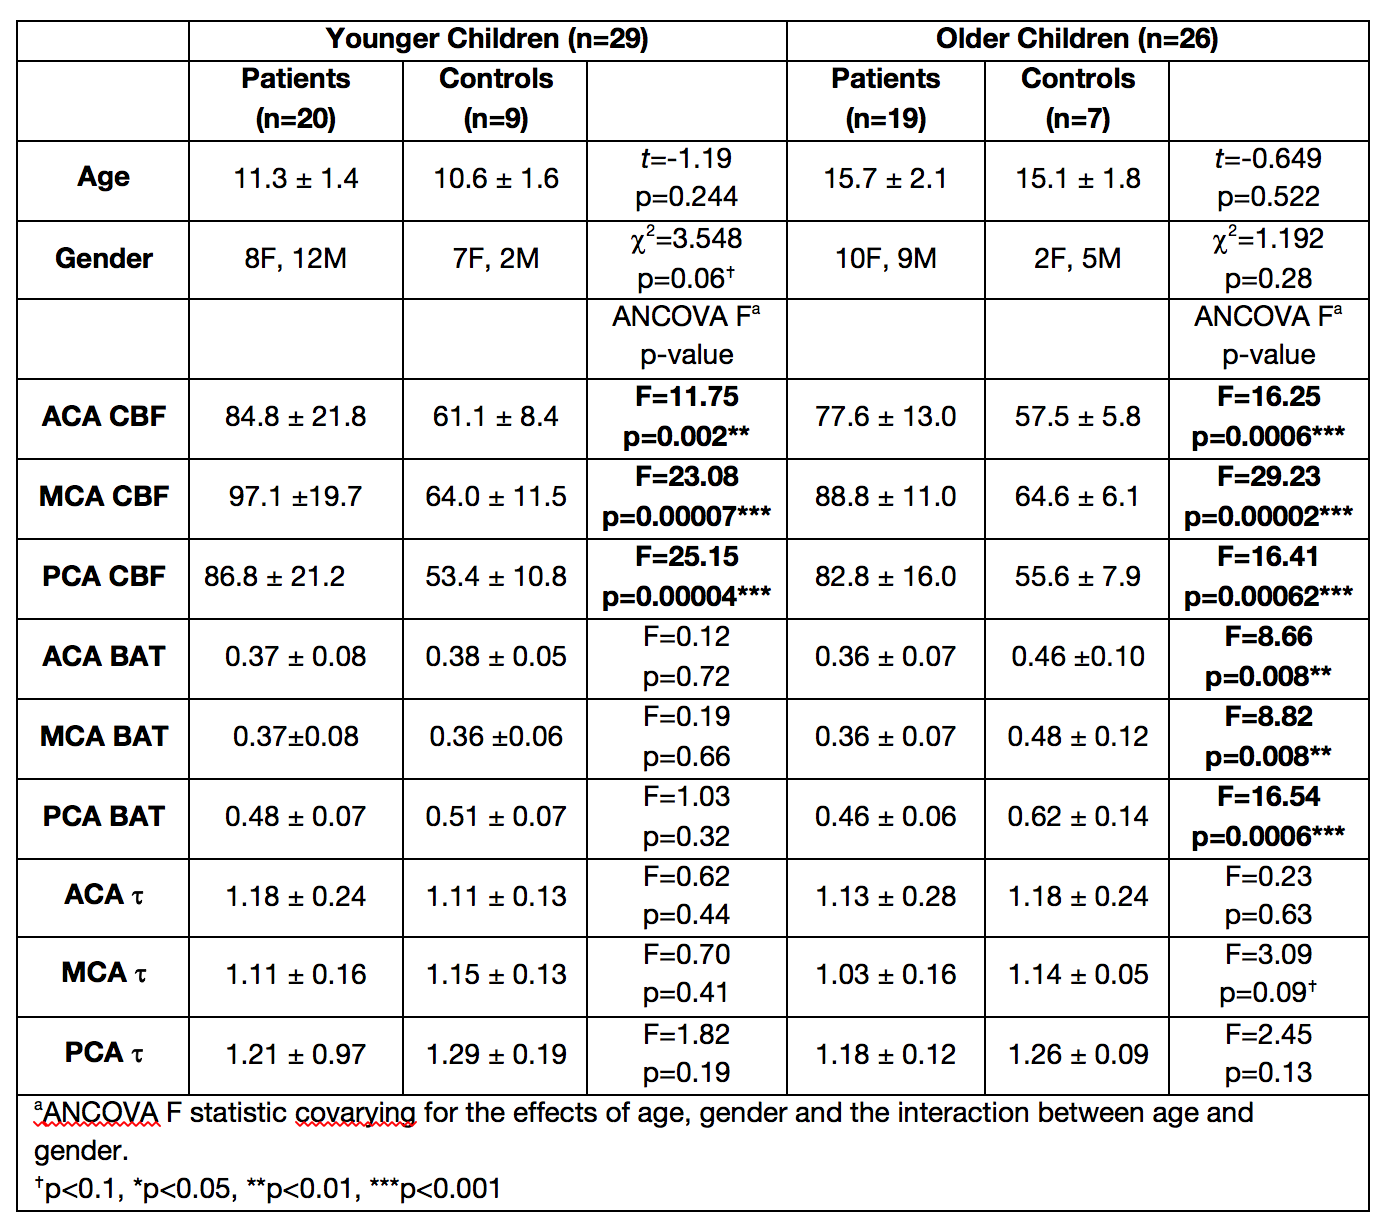
Thirty-nine patients and 16 sibling controls (split into younger children [8-12 years] and older children [13-18 years]) were recruited from three London sites and underwent MRI and cognitive testing at UCL Institute of Child Health between 2012-2013 (Figure 1). In patients, haematocrit (Hct) was collected from nearest full blood count and SpO2 was acquired on day of MRI from a finger probe. Oxygen content12 was estimated using13:
$$$ Oxygen content = (1.34 x Haemoglobin x SpO2) + (0.003 x pO2) $$$
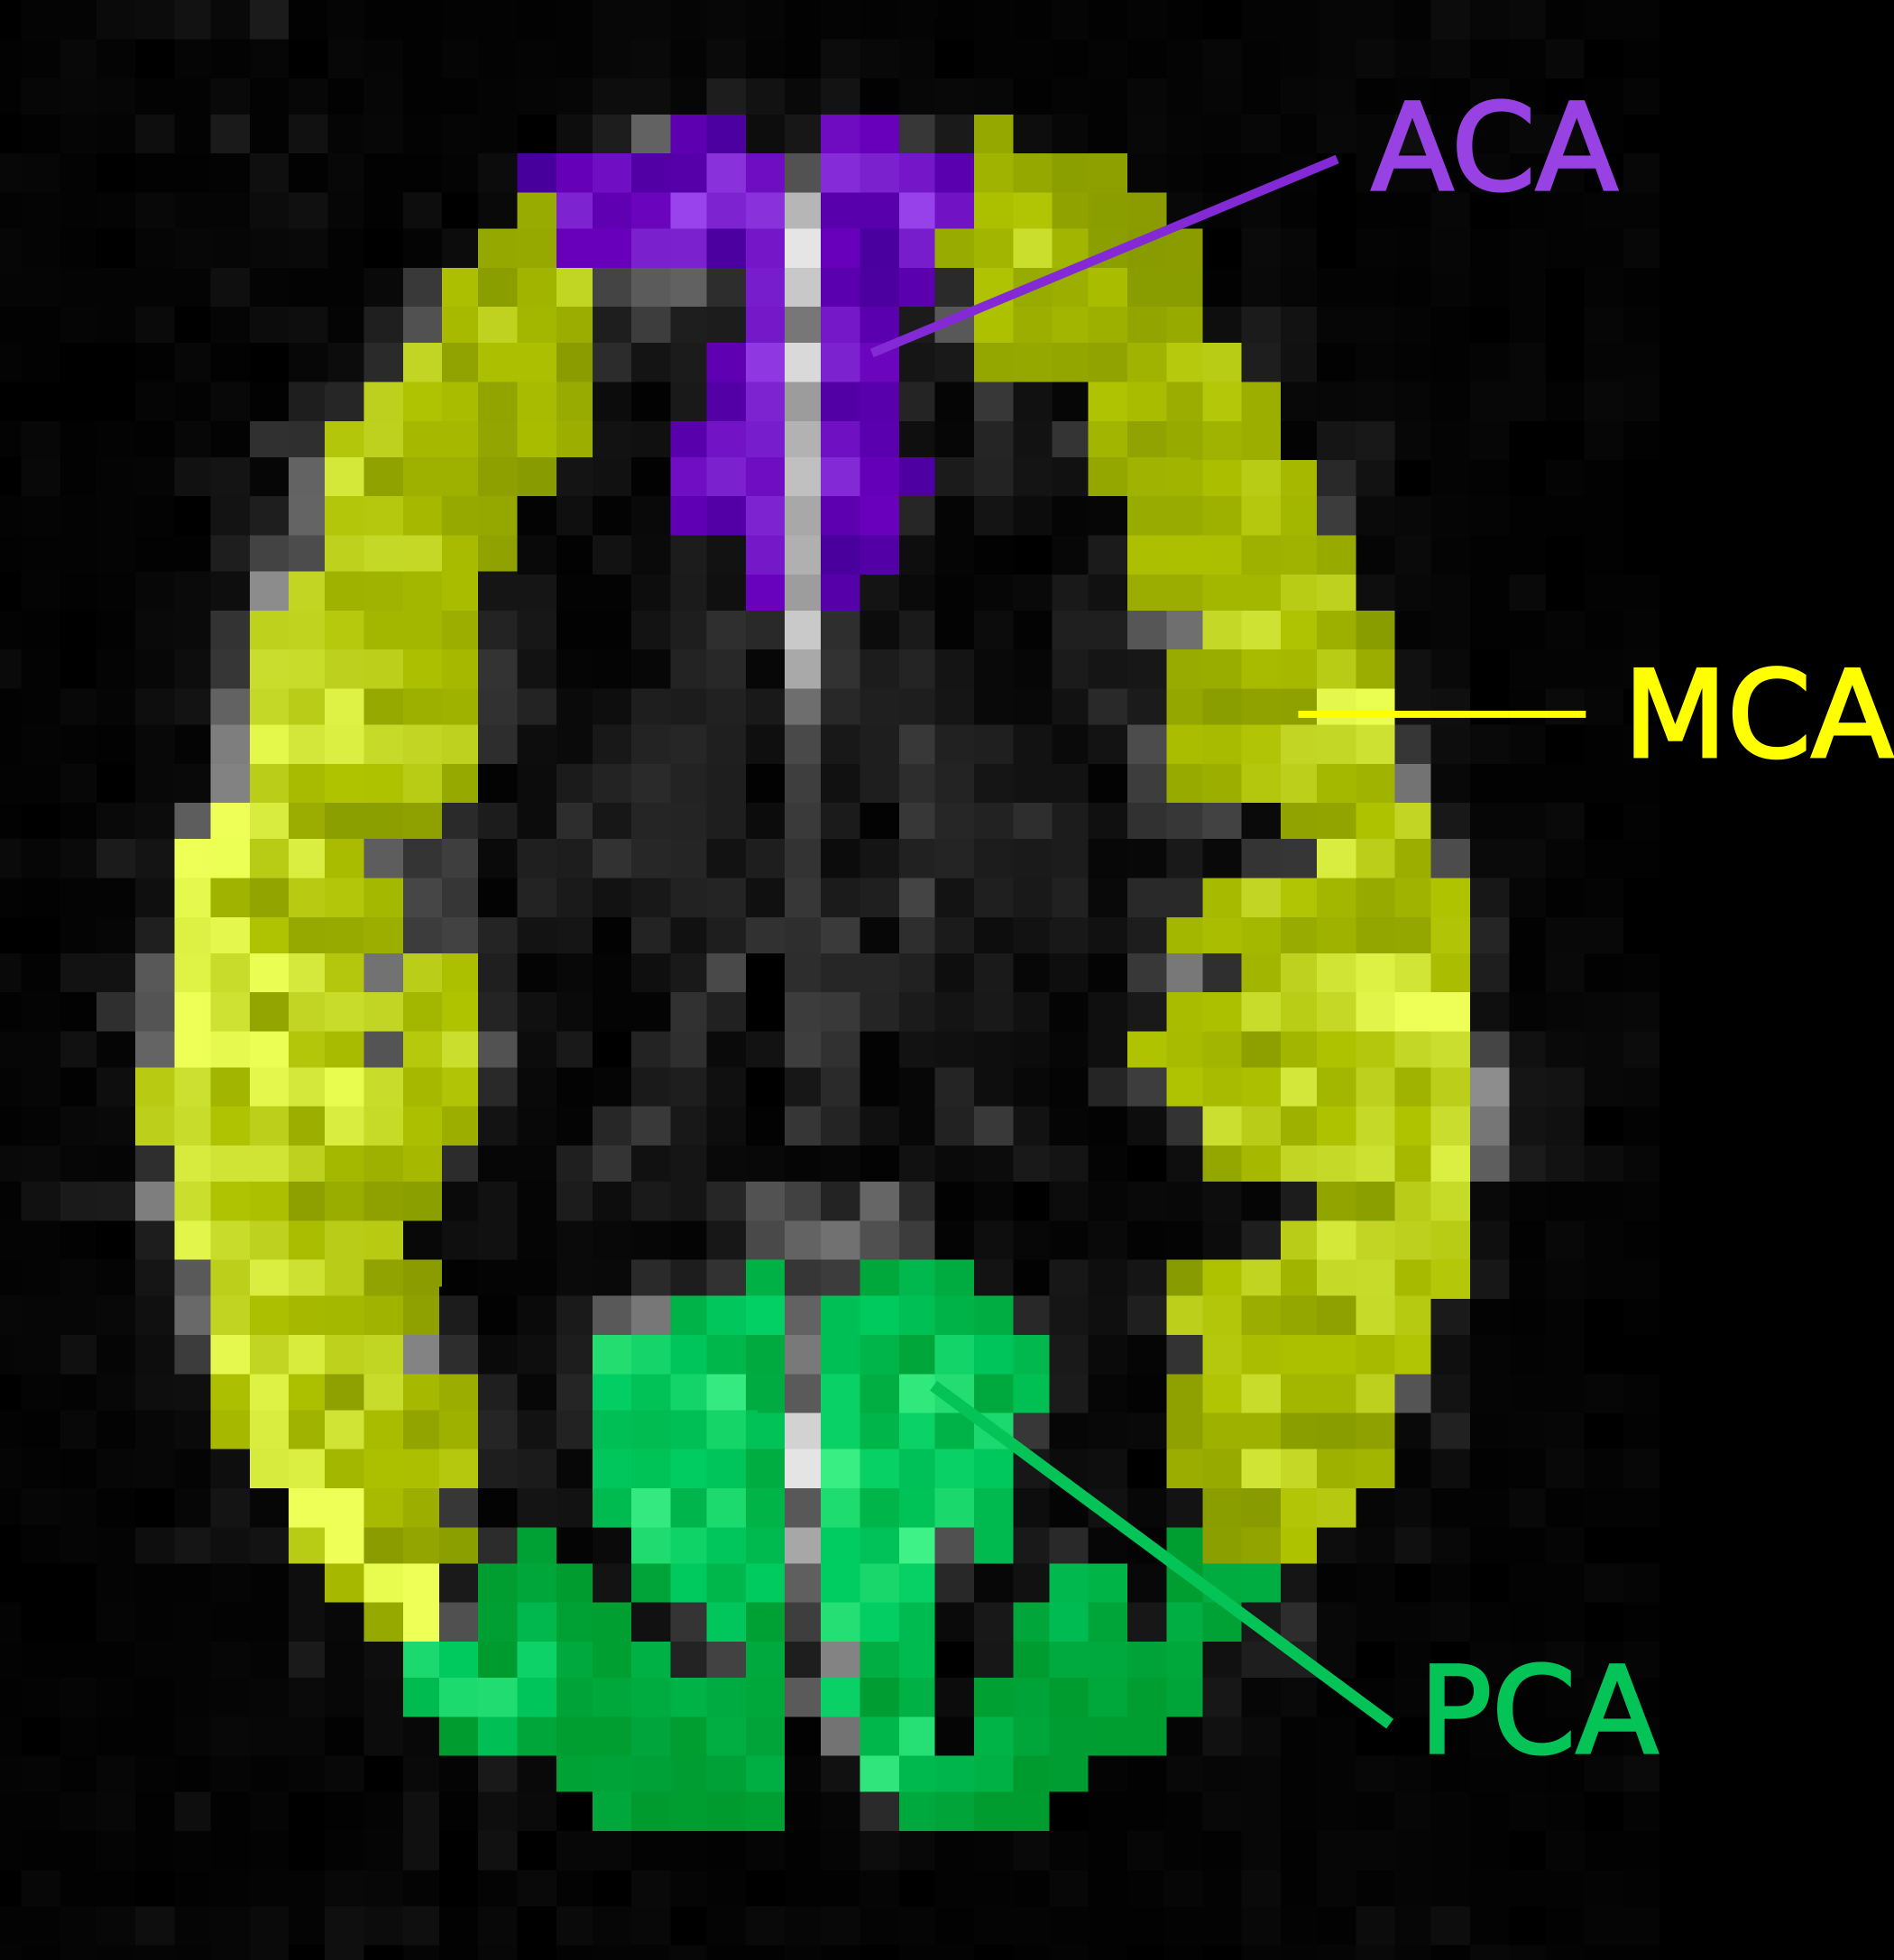
where pO2 = partial pressure of oxygen, which is assumed to be 100 torr on room air. MRI data were acquired on a 1.5T Siemens Avanto with 40mT/m gradients and 32-channel receive headcoil. A flow-sensitive alternating inversion recovery (FAIR) pulsed-ASL sequence was acquired, with background suppression and 3D single shot GRASE readout, using 6 inflow times ranging 0.2-2.2 seconds in 0.4 second intervals. An inversion-recovery sequence was used to calculate voxel-wise values of T1 relaxation time and M0. A value of T1blood is required during the ASL model fitting and estimated values of T1blood were calculated for each subject based on measured Hct and SpO214. Using the Buxton kinetic model15, mean ASL difference signal (control-label) in the anterior, middle and posterior arterial territories (Figure 2) was used to calculate CBF, BAT and τ in each subject. An analysis of covariance model was performed to control for age, gender and the interaction between age and gender in patients vs. controls separately in younger children and older children. Partial correlations were carried out between oxygen content and ASL fitted parameters, correcting for age and gender.
Results
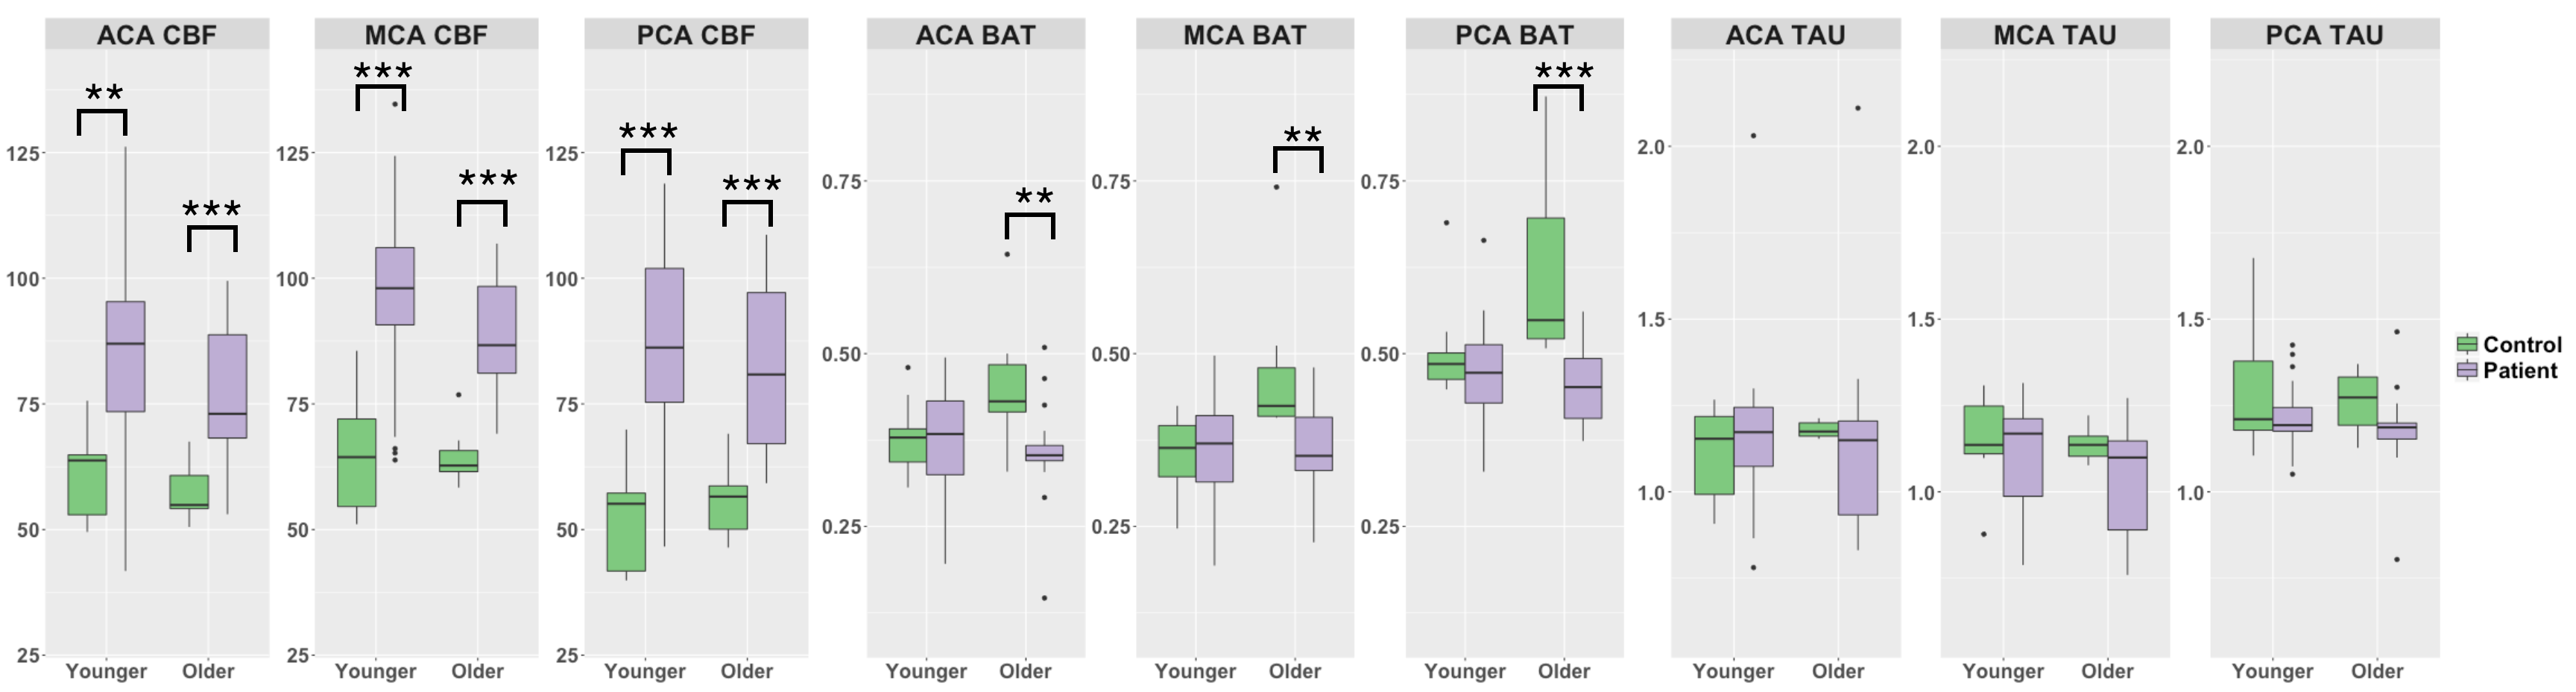
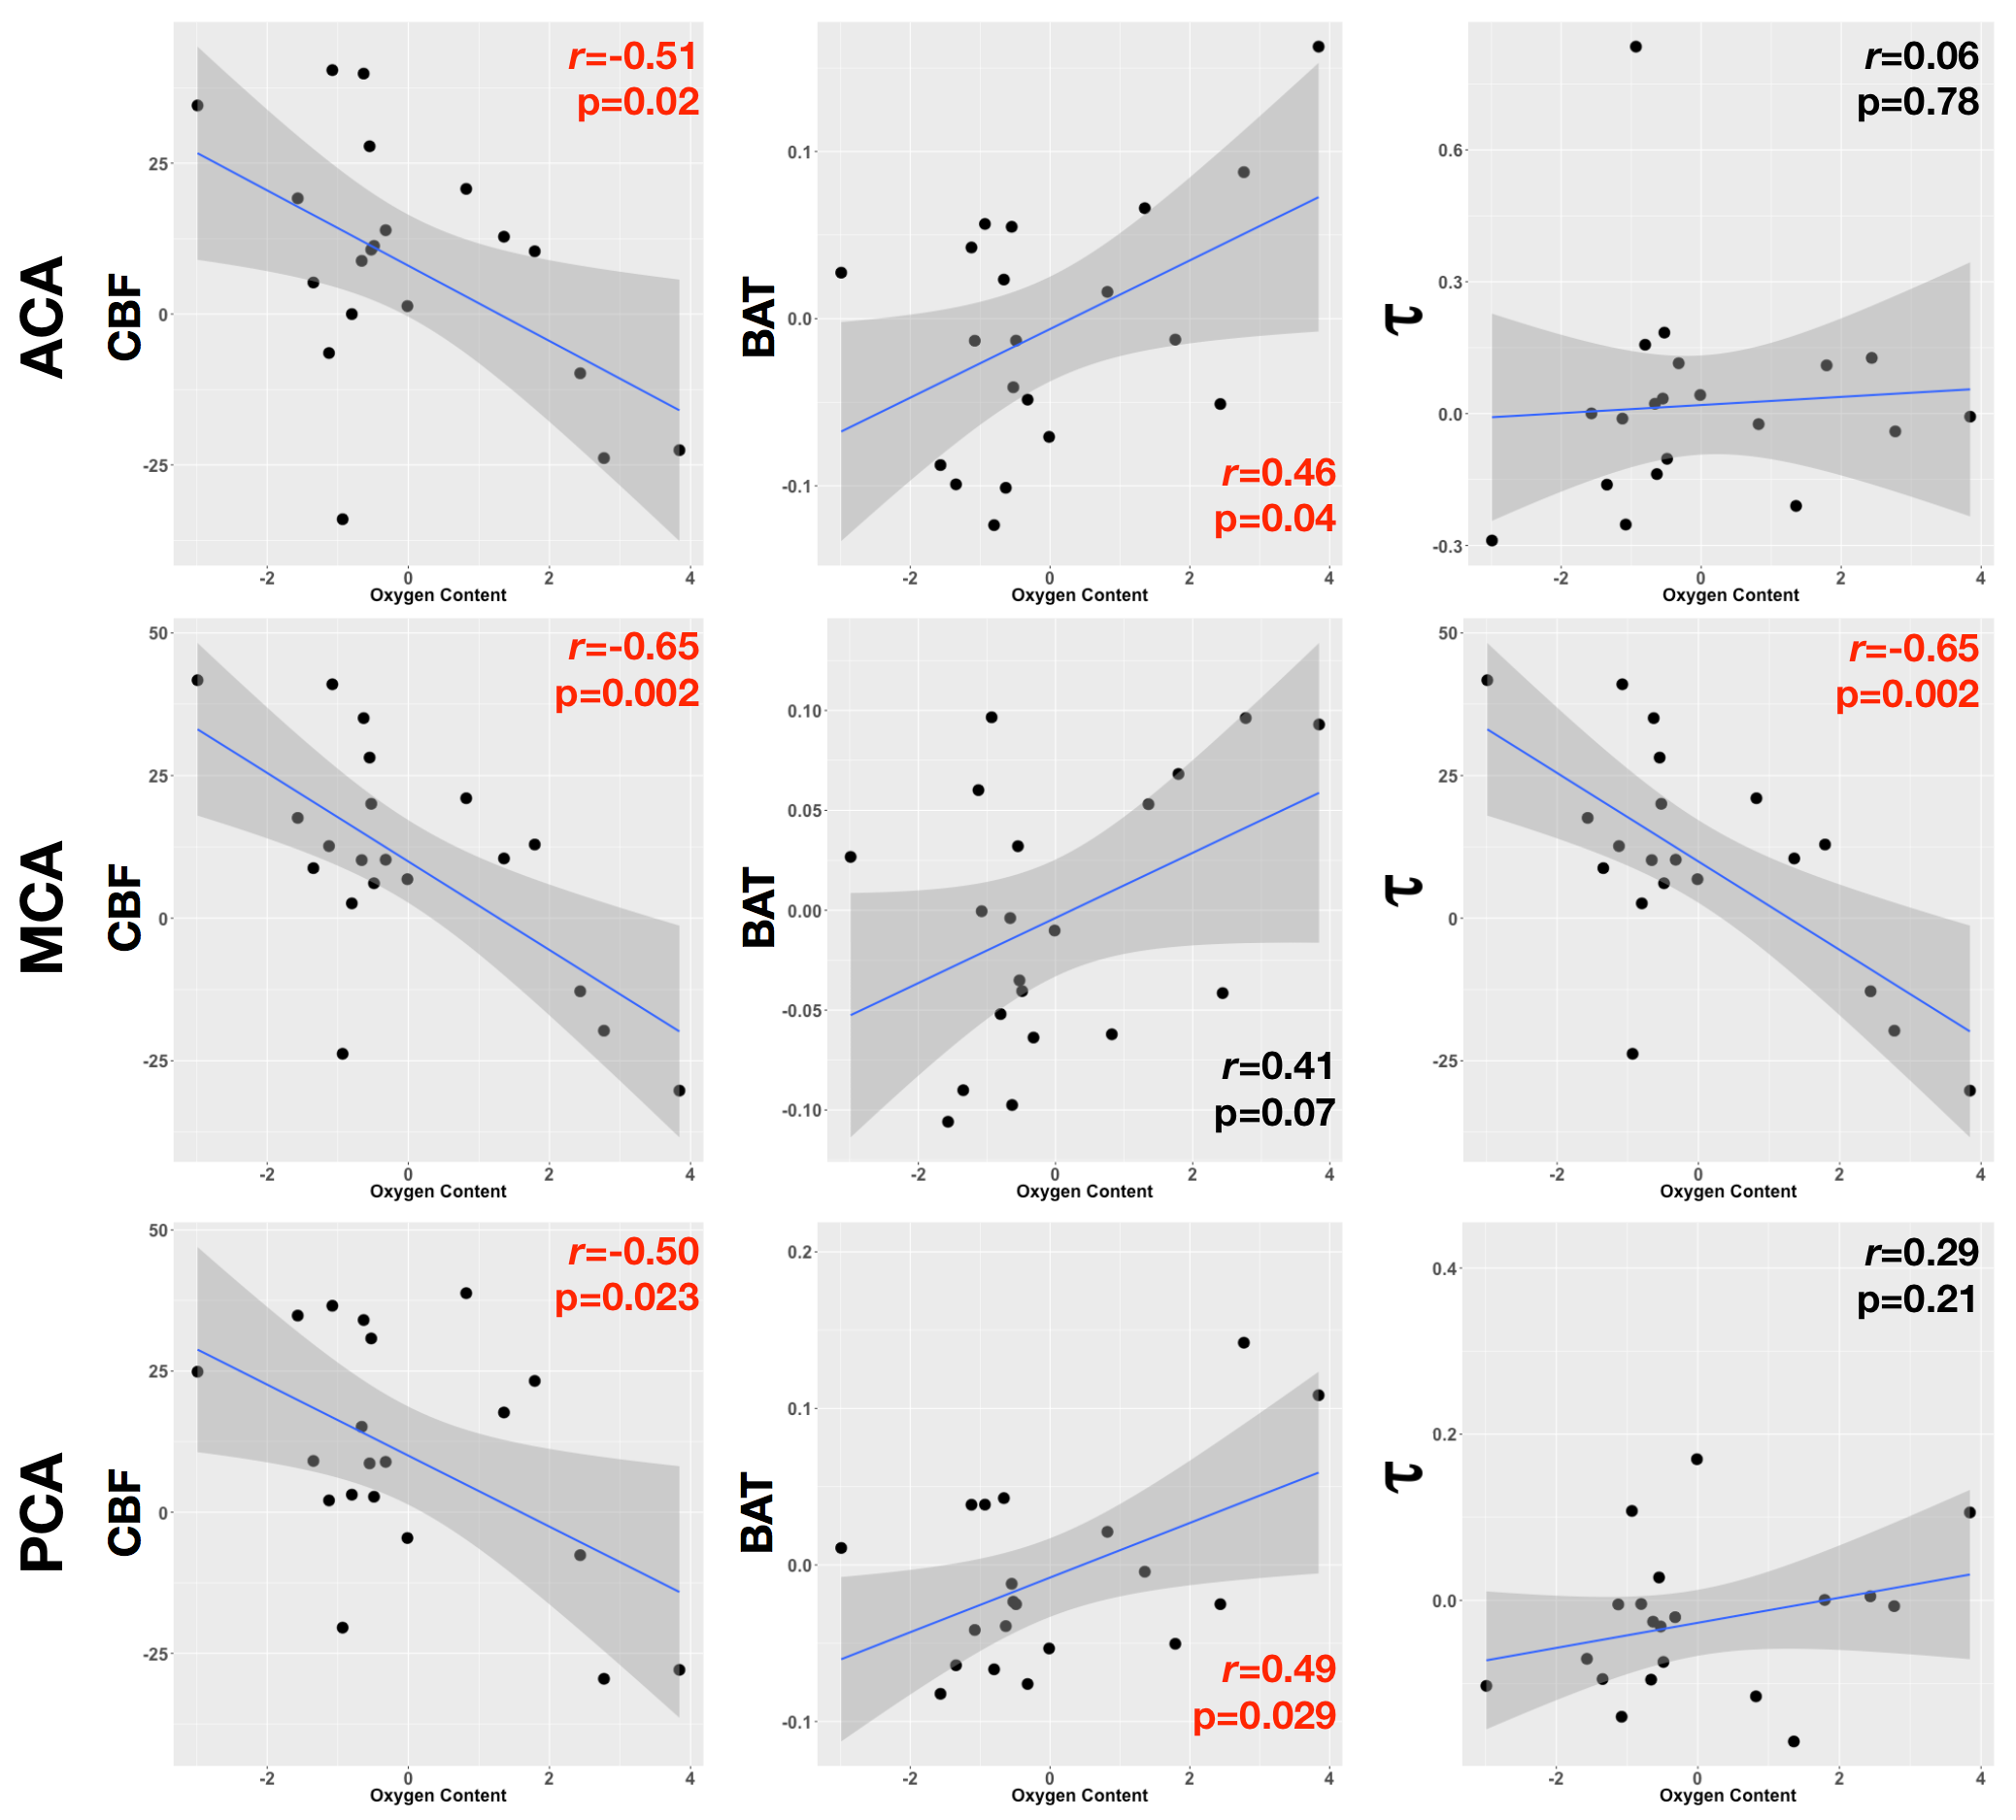
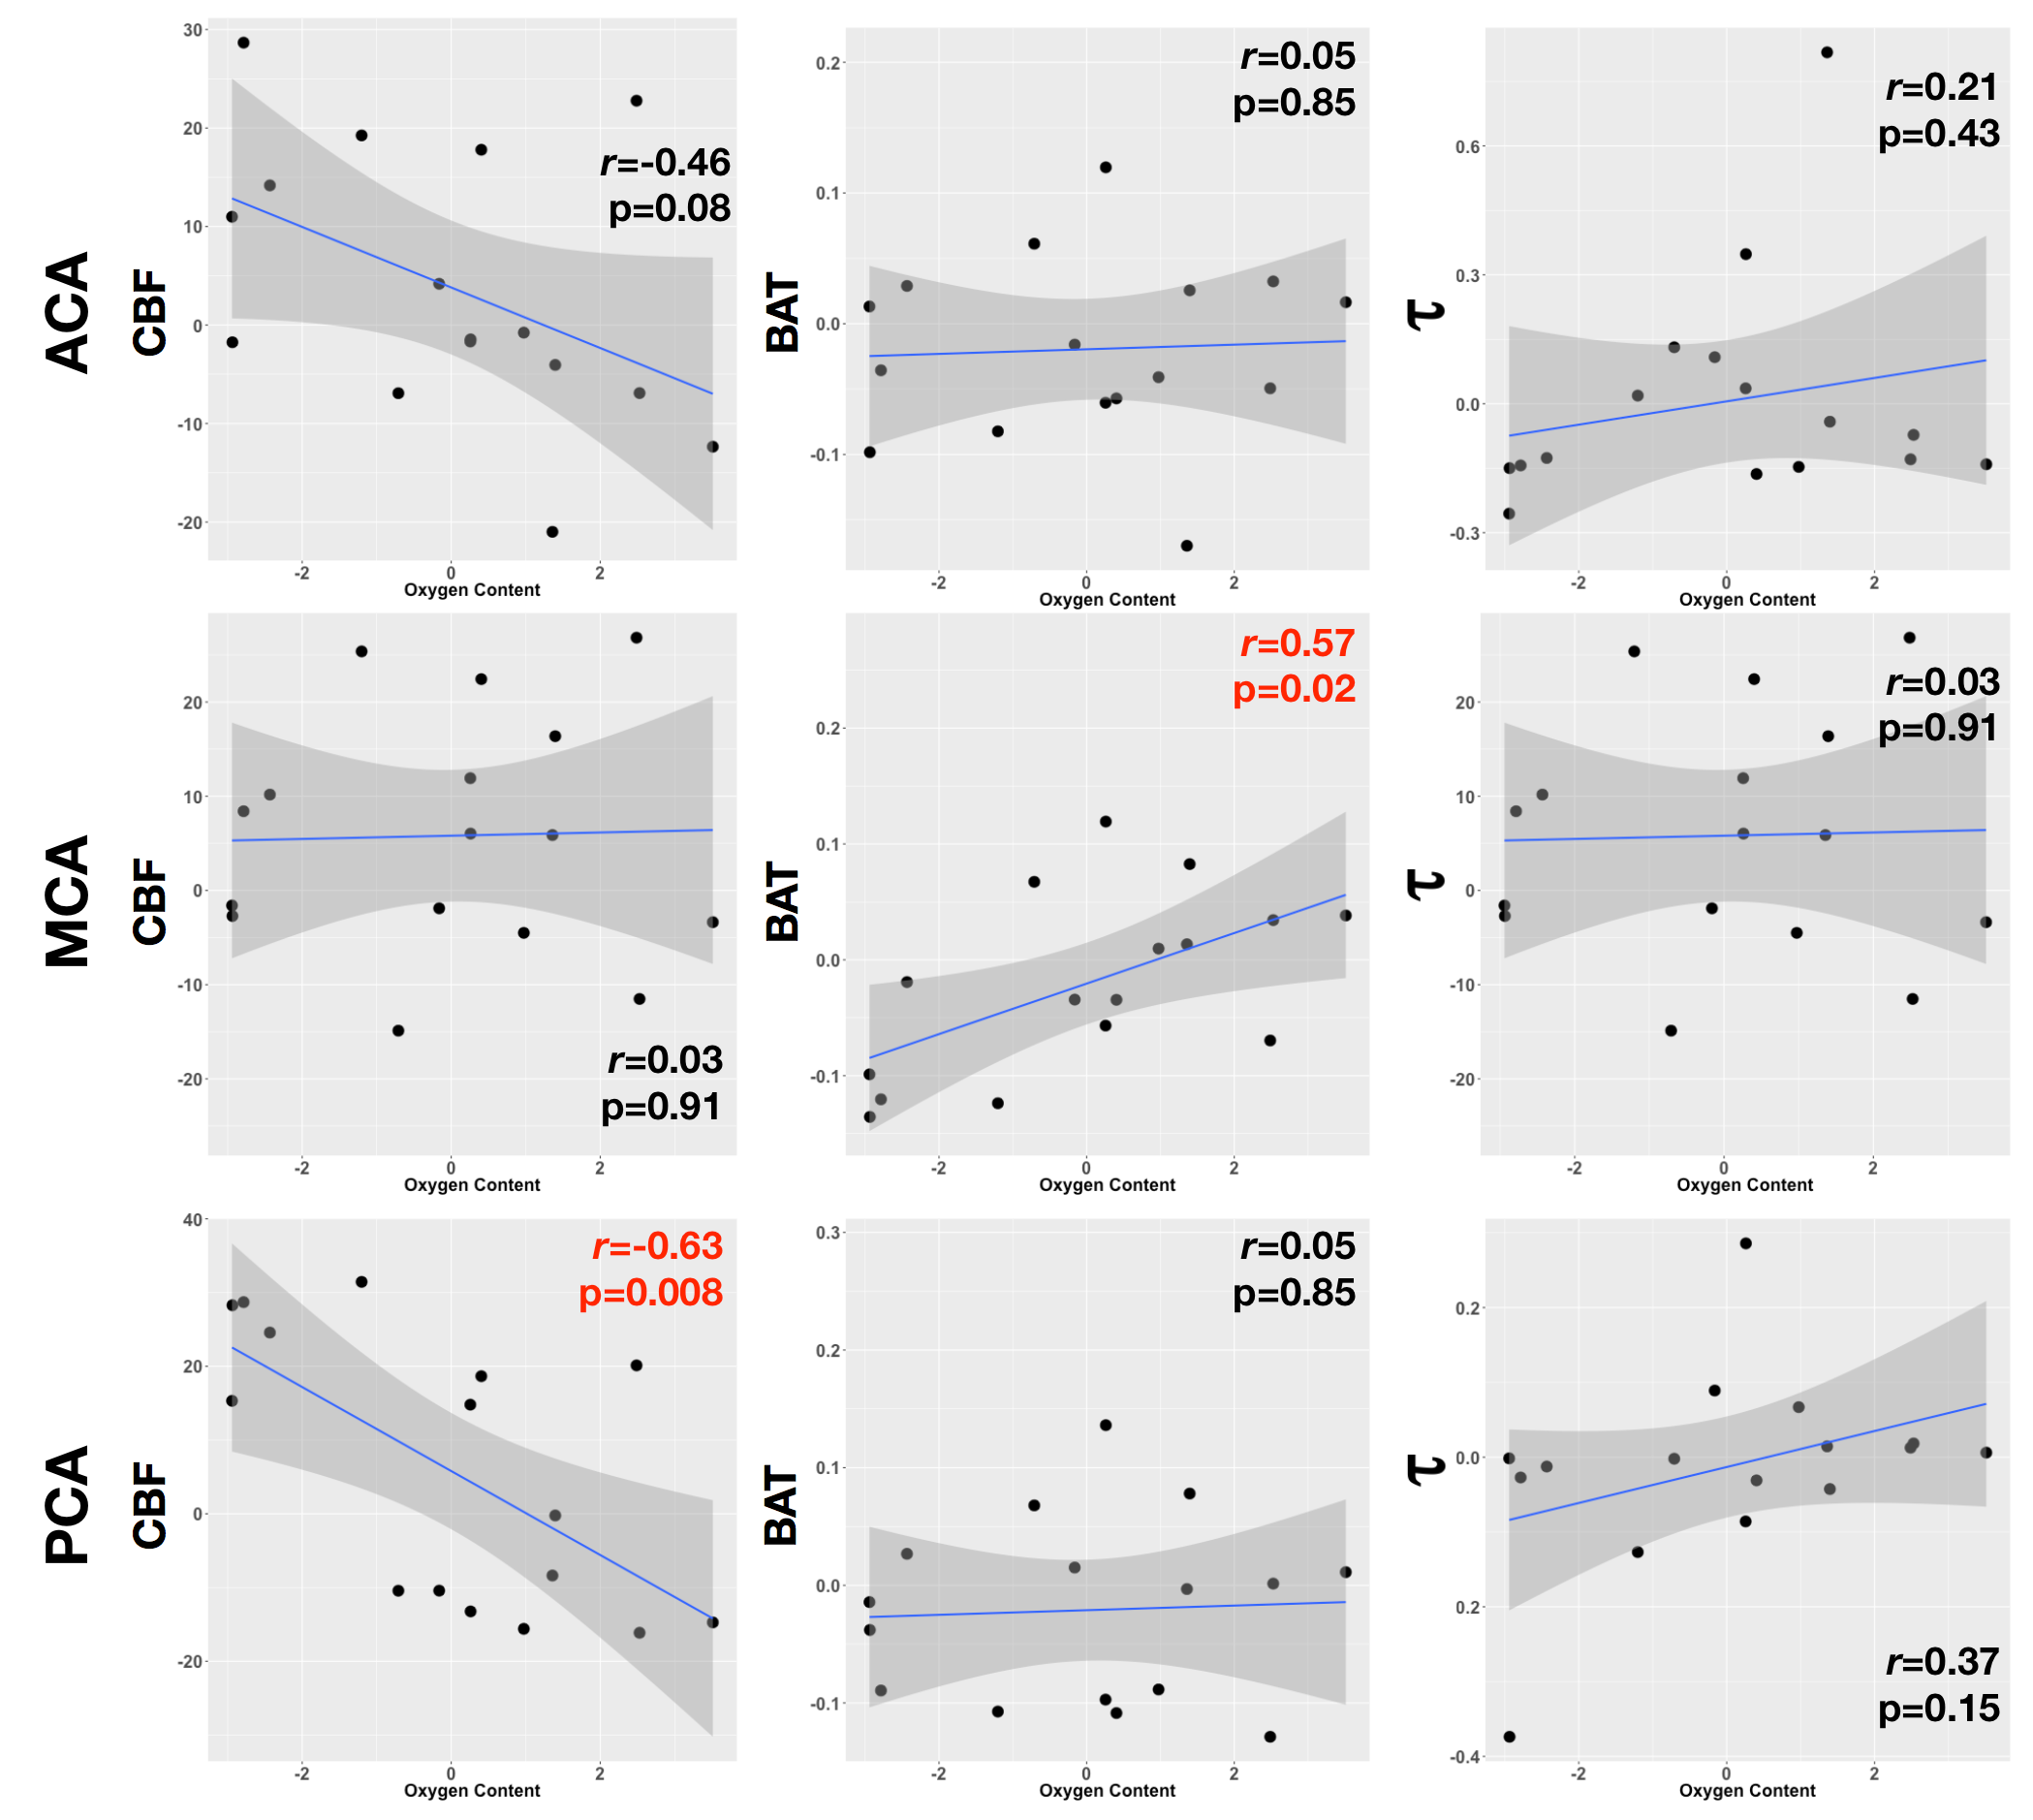
In both younger and older children, CBF in all three arterial territories was significantly higher in patients than controls (Figures 1& 3). In older children only, BAT in all three territories was significantly shorter in patients, and there was a trend for shorter τ in the MCA territory. In younger children, oxygen content was available for all patients; there was a significant negative correlation between oxygen content and CBF in all three territories and a significant positive correlation with BAT in the ACA and PCA territories, and a significant negative correlation with t in the MCA territory (Figure 4). In older children, oxygen content was available for 16/19 patients; there was a significant negative correlation between oxygen content and CBF in the PCA territory and a trend for a positive correlation with BAT in the MCA territory (Figure 5).Discussion
This is the first ASL study to use multiple inflow times to measure haemodynamic behaviour in children with SCD. This study shows significantly shorter BAT in older, but not younger, patients compared to controls, which may indicate an increasing disparity between patients with SCD and healthy controls as patients get older and may be related to longer standing burden of disease.Acknowledgements
No acknowledgement found.References
1. Ohene-Frempong K, Weiner SJ, Sleeper LA, et al. Cerebrovascular accidents in sickle cell disease: rates and risk factors. Blood 1998;91(1):288–94.
2. Adams RJ, McKie VC, Hsu L, et al. Prevention of a first stroke by transfusions in children with sickle cell anemia and abnormal results on transcranial Doppler ultrasonography. N. Engl. J. Med. 1998;339(1):5–11.
3. Prohovnik I, Hurlet-Jensen A, Adams R, et al. Hemodynamic etiology of elevated flow velocity and stroke in sickle-cell disease. J. Cereb. Blood Flow Metab. 2009;29(4):803–10.
4. Kirkham FJ, Hewes DK, Prengler M, et al. Nocturnal hypoxaemia and central-nervous-system events in sickle-cell disease. Lancet 2001;357(9269):1656–9.
5. Hollocks MJ, Kok TB, Kirkham FJ, et al. Nocturnal oxygen desaturation and disordered sleep as a potential factor in executive dysfunction in sickle cell anemia. J. Int. Neuropsychol. Soc. 2012;18(1):168–73.
6. Kawadler JM, Kirkham FJ, Clayden JD, et al. White Matter Damage Relates to Oxygen Saturation in Children With Sickle Cell Anemia Without Silent Cerebral Infarcts. Stroke 2015;46(7):1793–9.
7. Oguz KK, Golay X, Pizzini FB, et al. Sickle cell disease: continuous arterial spin-labeling perfusion MR imaging in children. Radiology 2003;227(2):567–74.
8. Gevers S, Nederveen AJ, Fijnvandraat K, et al. Arterial spin labeling measurement of cerebral perfusion in children with sickle cell disease. J. Magn. Reson. Imaging 2012;35(4):779–87.
9. van den Tweel XW, Nederveen AJ, Majoie CBLM, et al. Cerebral blood flow measurement in children with sickle cell disease using continuous arterial spin labeling at 3.0-Tesla MRI. Stroke 2009;40(3):795–800.
10. Prohovnik I, Pavlakis SG, Piomelli S, et al. Cerebral hyperemia, stroke, and transfusion in sickle cell disease. Neurology 1989;39:344–348.
11. Hales PW, Kawadler JM, Aylett SE, et al. Arterial spin labeling characterization of cerebral perfusion during normal maturation from late childhood into adulthood: normal “reference range” values and their use in clinical studies. J. Cereb. blood flow Metab. 2014;34(5):776–84.
12. Bush AM, Borzage MT, Choi S, et al. Determinants of resting cerebral blood flow in sickle cell disease. Am. J. Hematol. 2016;91(9):912–917.
13. Wasserman K, Whipp BJ. State of the Art Exercise Physiology in Health and Disease •·•. Am. Rev. Respir. Dis. 1975;112(3):219–249.
14. Hales PW, Kirkham FJ, Clark CA. A general model to calculate the spin-lattice (T1) relaxation time of blood, accounting for haematocrit, oxygen saturation and magnetic field strength. J. Cereb. Blood Flow Metab. 2016;36(2):370–4.
15. Buxton RB, Frank LR, Wong EC, et al. A general kinetic model for quantitative perfusion imaging with arterial spin labeling. Magn. Reson. Med. 1998;40(3):383–96.
Figures