4567
Comparison of the Arterial transit artifact of pcASL between stroke patients with cerebral artery stenosis and normal controls1Center for BioMedical Imaging Research,Tsinghua, Beijing, People's Republic of China, 2Department of Image Center, Shanghai Xuhui Center Hospital, Shanghai, People's Republic of China, 3Department of radiology, University of Washington, Seattle, WA, United States
Synopsis
Cerebral blood flow (CBF) reduction below a certain threshold is a main cause leading to cerebral ischemia . Arterial Spin Labeling (ASL) is a noncontrast MRI perfusion technique that can quantify CBF. Although ATA may be problematic for CBF quantification, there are evidences suggest that ATA may be a useful imaging biomarker to represent collateral flow and indicate better outcomes , this study aims to investigate the difference of ATA prevalence between stroke patients with cerebral artery stenosis and healthy volunteers. It was found that the stroke patients have more brain regions with long arterial transit time compared with healthy volunteers using a manual review method to estimate the overall CBF of subject while allowing ATA detection, suggesting ATA could be a potential imaging biomarker.
Introduction
Cerebral blood flow (CBF) reduction below a certain threshold is a main cause leading to cerebral ischemia 1-3. Arterial Spin Labeling (ASL) is a noncontrast MRI perfusion technique that can quantify CBF. As ASL is sensitive to prolonged arterial arrival time, A long arterial arrival time would result in bright intravascular signal known as arterial transit artifact (ATA) 4. Although ATA may be problematic for CBF quantification, there are evidences suggest that ATA may be a useful imaging biomarker to represent collateral flow and indicate better outcomes 5-6. However, the clinical meaning of ATA as a imaging biomarker in stroke patients remain unclear. Thus, this study aims to investigate the difference of ATA prevalence between stroke patients with cerebral artery stenosis and healthy volunteers.Methods
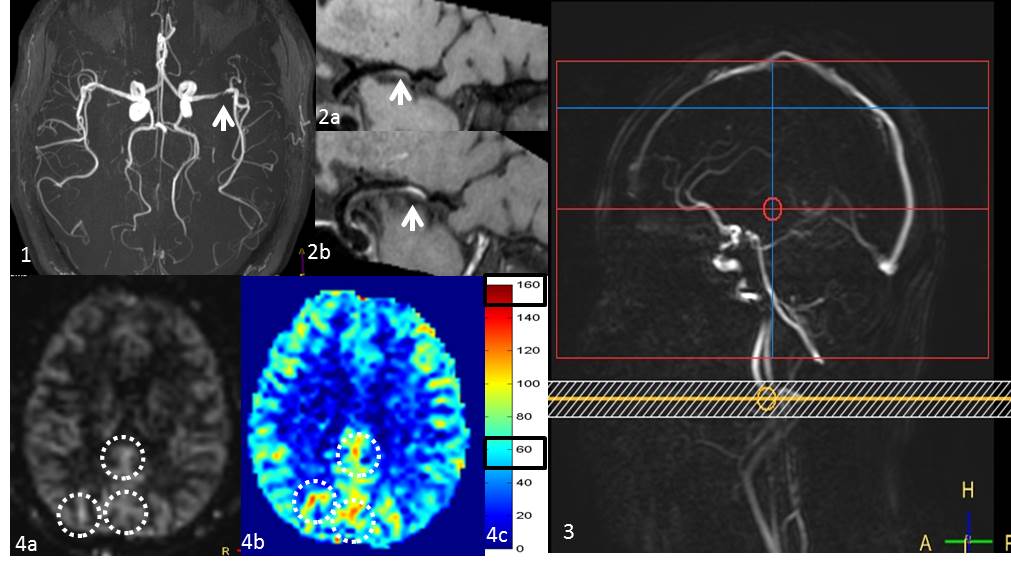
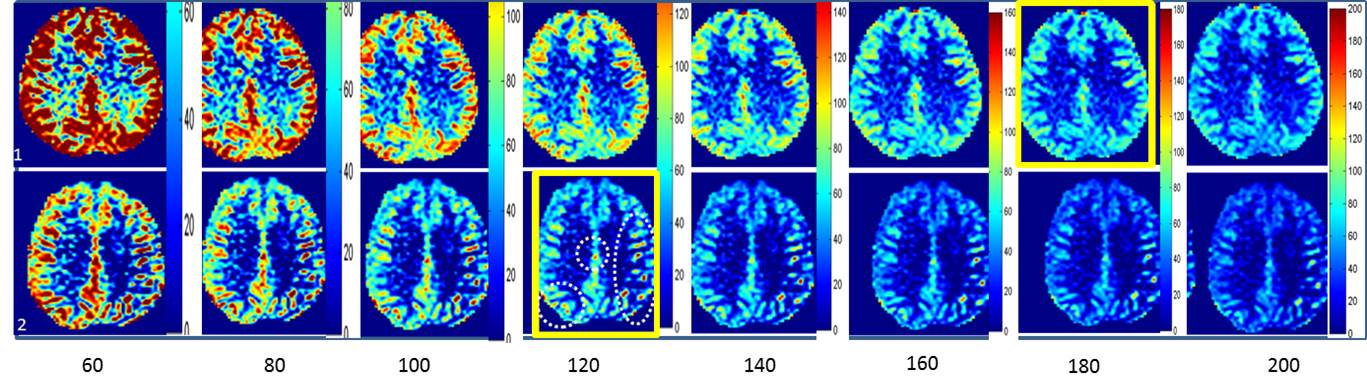
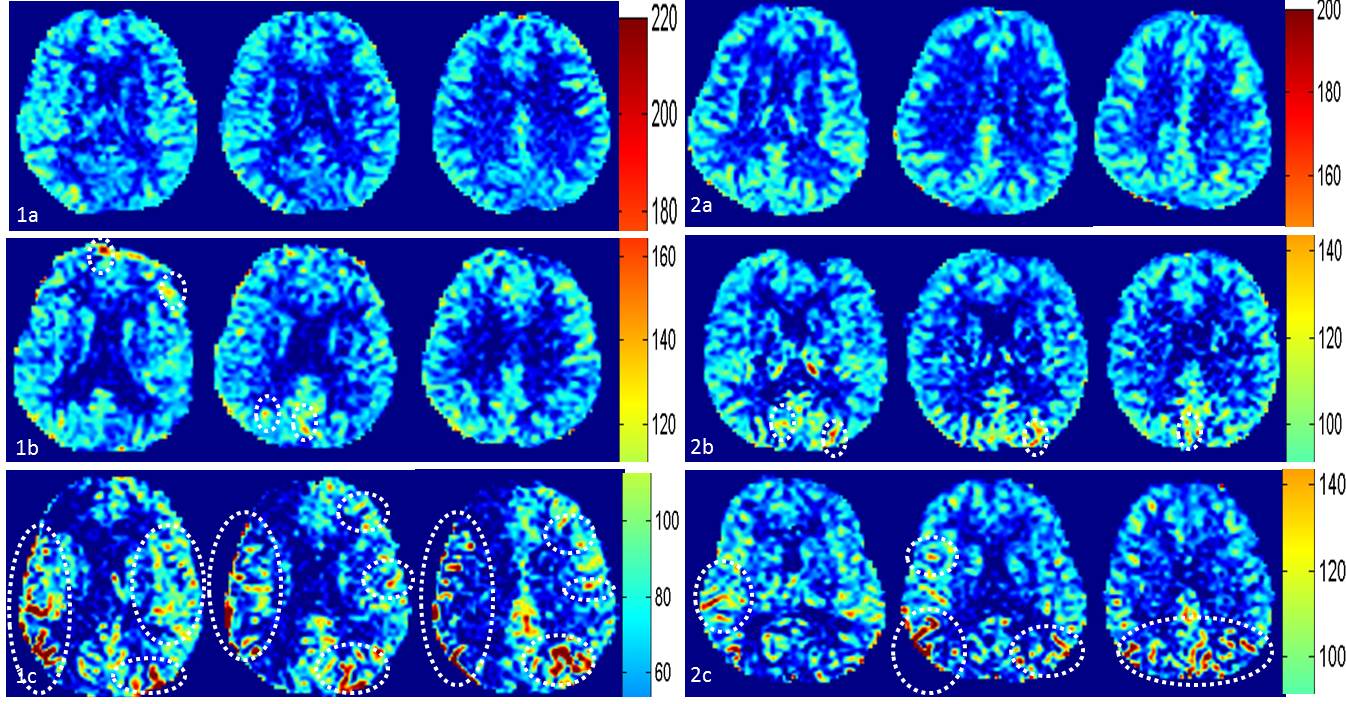
Population: Totally, 76 subjects were included in this retrospective study, including 38 stroke patients(26 males; age =57.39 ± 9.14 years) with unilateral 20-80% MCA stenosis (most recent event > 3 months) and 38 normal controls (19 males, age =56.74±10.84 year). The gender and age of two groups were not statistically significant (p>0.05) in all subjects. Image acquisition: All MR scans were performed on a 3T whole body scanner (Philips, Achieva TX, Best, the Netherlands) using a 32channel head coil. A pCASL (pseudo-continuous arterial spin labeling) sequence were carried out to obtain the brain perfusion with parameters: FOV=240X240 mm2, Matrix=80X80, 22 slices, slice thickness=6mm, TR/TE=4015/12ms, post labelling duration=1650ms (Fig 1); Data Analysis: pCASL data were post-processed by a customized software written in MATLAB (Mathworks, Natick, MA, USA). The CBF images were shown in pseudo-color map. First, an experienced radiologist reviewed the pseudo-color images and adjusted the upper range of color bar with the lower rang set to 0. The optimal value upper range of the color bar is the value when 3/4-4/4 cerebral grey matter will be covered by cyan color. This upper range value could be used as a reflection of overall brain perfusion status. Then, ATA was identified as red streak signal on this pseudo-color map with adjusted optimal range (Fig 2). The ATA pattern was divided into three levels: level 0, no ATA appeared; level 1, 1 to 6 ATA regions; level 2, more than 6 ATA regions (Fig 3). The differences of optimal upper color bar value and ATA characteristics of two groups were compared using t test.Result and discussion
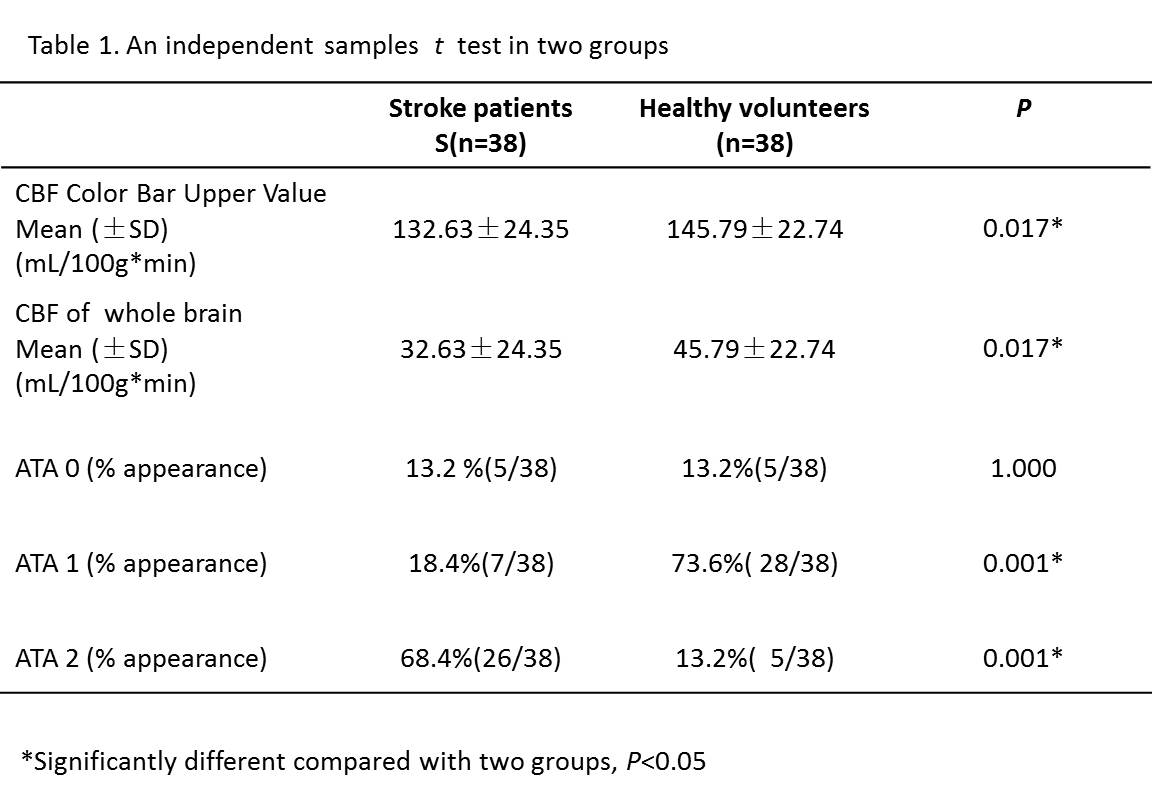
As shown in Table 1, the optimal upper color bar value of stenosis group was significantly lower than normal group (P < 0.01), which indicated that the basic perfusion of patients with MCA stenosis and chronic stroke was less than normal group. The ATA level 0 showed no difference between patient and healthy volunteers; while the occurrence rate of level 2 ATA in stroke patients was significantly larger than healthy volunteers (P < 0.001). this result indicates that more regions in stroke patients has prolonged arterial arrival time. Since the ATA signal may present the collateral circulation status of the subjects 5-6, this results are reasonable because those stroke patients should develop many collateral circulation after more than 3 months after events. However, this also mean the CBF calculated by ASL of the stroke patients may be underestimated and the severity of the perfusion reduction may be overestimated because of the presence of ATA. In future studies, the clinical diagnosis value of ATA, where the cerebral grey matter function, is either in the compensatory state or damaged earlier than MRI existing images need to research further more.Conclusion
This study found that the stroke patients have more brain regions with long arterial transit time compared with healthy volunteers using a manual review method to estimate the overall CBF of subject while allowing ATA detection, suggesting ATA could be a potential imaging biomarker.Acknowledgements
No acknowledgement found.References
1.Bandera, Elisabetta, et al. Cerebral blood flow threshold of ischemic penumbra and infarct core in acute ischemic stroke a systematic review. Stroke 2006; 37(5):1334-1339. 2.Wirestam R, et al. Assessment of regional cerebral blood flow by dynamic susceptibility contrast MRI using different deconvolution techniques. Magn Reson Med 2000;43:691–700. 3.Detre JA, etl. Noninvasive magnetic resonance imaging evaluation of cerebral blood flow with acetazolamide challenge in patients with cerebrovascular stenosis. J Magn Reson Imaging 1999; 10:870–875. 4.Greg Zaharchuk, etl. Arterial Spin Label Imaging of Acute Ischemic Stroke and Transient Ischemic Attack,Methods. Neuroimaging Clin N Am 2011; 21(2): 285–301. 5.Chalela JA., et al. Magnetic resonance perfusion imaging in acute ischemic stroke using continuous arterial spin labeling. Stroke 2000;31(3): 680-687.6.Chng SM et al. Territorial arte- rial spin labeling in the assessment of collateral circulation: comparison with digital subtraction angiography. Stroke 2008;39:3248–54.Figures