4560
In vivo measurement of water exchange at the human blood-cerebrospinal fluid barrier1Advanced Imaging Research Center, Oregon Health & Science University, Portland, OR, United States, 2Dept. of Neurology, Oregon Health & Science University, Portland, OR, United States
Synopsis
Epithelial cells of the choroid plexus contain the blood-CSF barrier and play a pivotal role in brain water homeostasis. Here, DCE-MRI was used to investigate choroid plexus water exchange in 25 older individuals. A marked non-linearity of blood and tissue R1 values was observed, indicating that water exchange departs the fast exchange limit at clinical blood contrast agent levels. Using a two-site model that explicitly incorporates water exchange between intra- and extraventricular compartments, a mean rate constant for ventricular water efflux, kio, of 0.26 ± 0.13 s-1 was obtained. Significant associations of kio with age and cognitive status were found.
Introduction
Preserving fluid transport at brain-fluid interfaces is essential for maintaining cerebral metabolism, neurotransmission, and cognition during brain aging. The choroid plexus (CP) contains the blood-cerebrospinal fluid (CSF) barrier, a highly specialized layer of epithelial cells that regulates the exchange of water and micronutrients between a fenestrated capillary network and ventricular CSF. The purpose of this study is to investigate water exchange dynamics at the CP in early Alzheimer’s disease (AD) using dynamic contrast enhanced (DCE) MRI and a low molecular weight contrast reagent.Methods
11 individuals with mild AD [74 ± 8 yrs, 6/11 male] and 14 healthy controls (HC) [71 ± 6 yrs, 5/14 male] were enrolled. Group assignment was based on NINCDS/ADRDA criteria.1 AD subjects had onset of symptoms after age 40 with progressive worsening of memory and Mini-Mental State Exam (MMSE)2 score of 26 ± 2. Controls had no memory complaints and MMSE score of 29 ± 1. Individuals with diabetes, uncontrolled hypertension, cardiovascular disease or prior TIA/stroke were excluded.
MR data were acquired on a Siemens 7T Magnetom instrument with 24-channel RF transmit/receive head coil. A series of IR-MPRAGE images [TR/TE/FA 2500 ms/2.1 ms/8°], sampled at four different inversion times [TI 200, 600, 1800 ms; and no inversion pulse], were acquired before contrast reagent (CR) administration. 1H2O R1 maps were produced by evaluating the Bloch equation accounting for all RF pulses and delays and assuming monoexponential inversion-recovery.3 DCE MRI consisted of 160-180 consecutive 3D T1-weighted gradient echo (GRE) acquisitions [TR/TE/FA 2.9 ms/1.4 ms/10°]. Each image volume contained 40 axial slices (5 mm thickness with nominal (2 mm)2 in-plane resolution). Intersampling interval was 3.5 s. A 0.08-0.10 mmol/kg bolus of gadoteridol (Bracco) was injected at 2.5 mL/s using a power injector (Medrad). R1(t) maps were prepared by voxelwise evaluation of the GRE signal intensity equation, assuming complete spoiling of T2* magnetization.4 Structural (0.8 mm)3 IR-MPRAGE and fluid attenuated inversion recovery (FLAIR) images, co-registered to the R1(t) maps,5 were used to define bilateral regions of interest (ROI; 0.2- 0.7 mL) in the choroid glomus. An overview of DCE processing steps is shown in Figure 1.
Changes in tissue R1(t) values during bolus passage were fit to a two-compartment model that allows water exchange between intra- and extraventricular compartments to depart the fast exchange limit.6 This ‘fast exchange regime’ model (FXR) returns the rate constant for ventricular water efflux, kio, the extraventricular (combined blood plasma and CP interstitial space) volume fraction, ve, and the CR intravasation rate constant, kep. Parametric maps were prepared using a Levenberg-Marquardt curve fitting algorithm7 and software developed in-house. Statistical analyses were performed in JMP (SAS Institute).
Results and Discussion
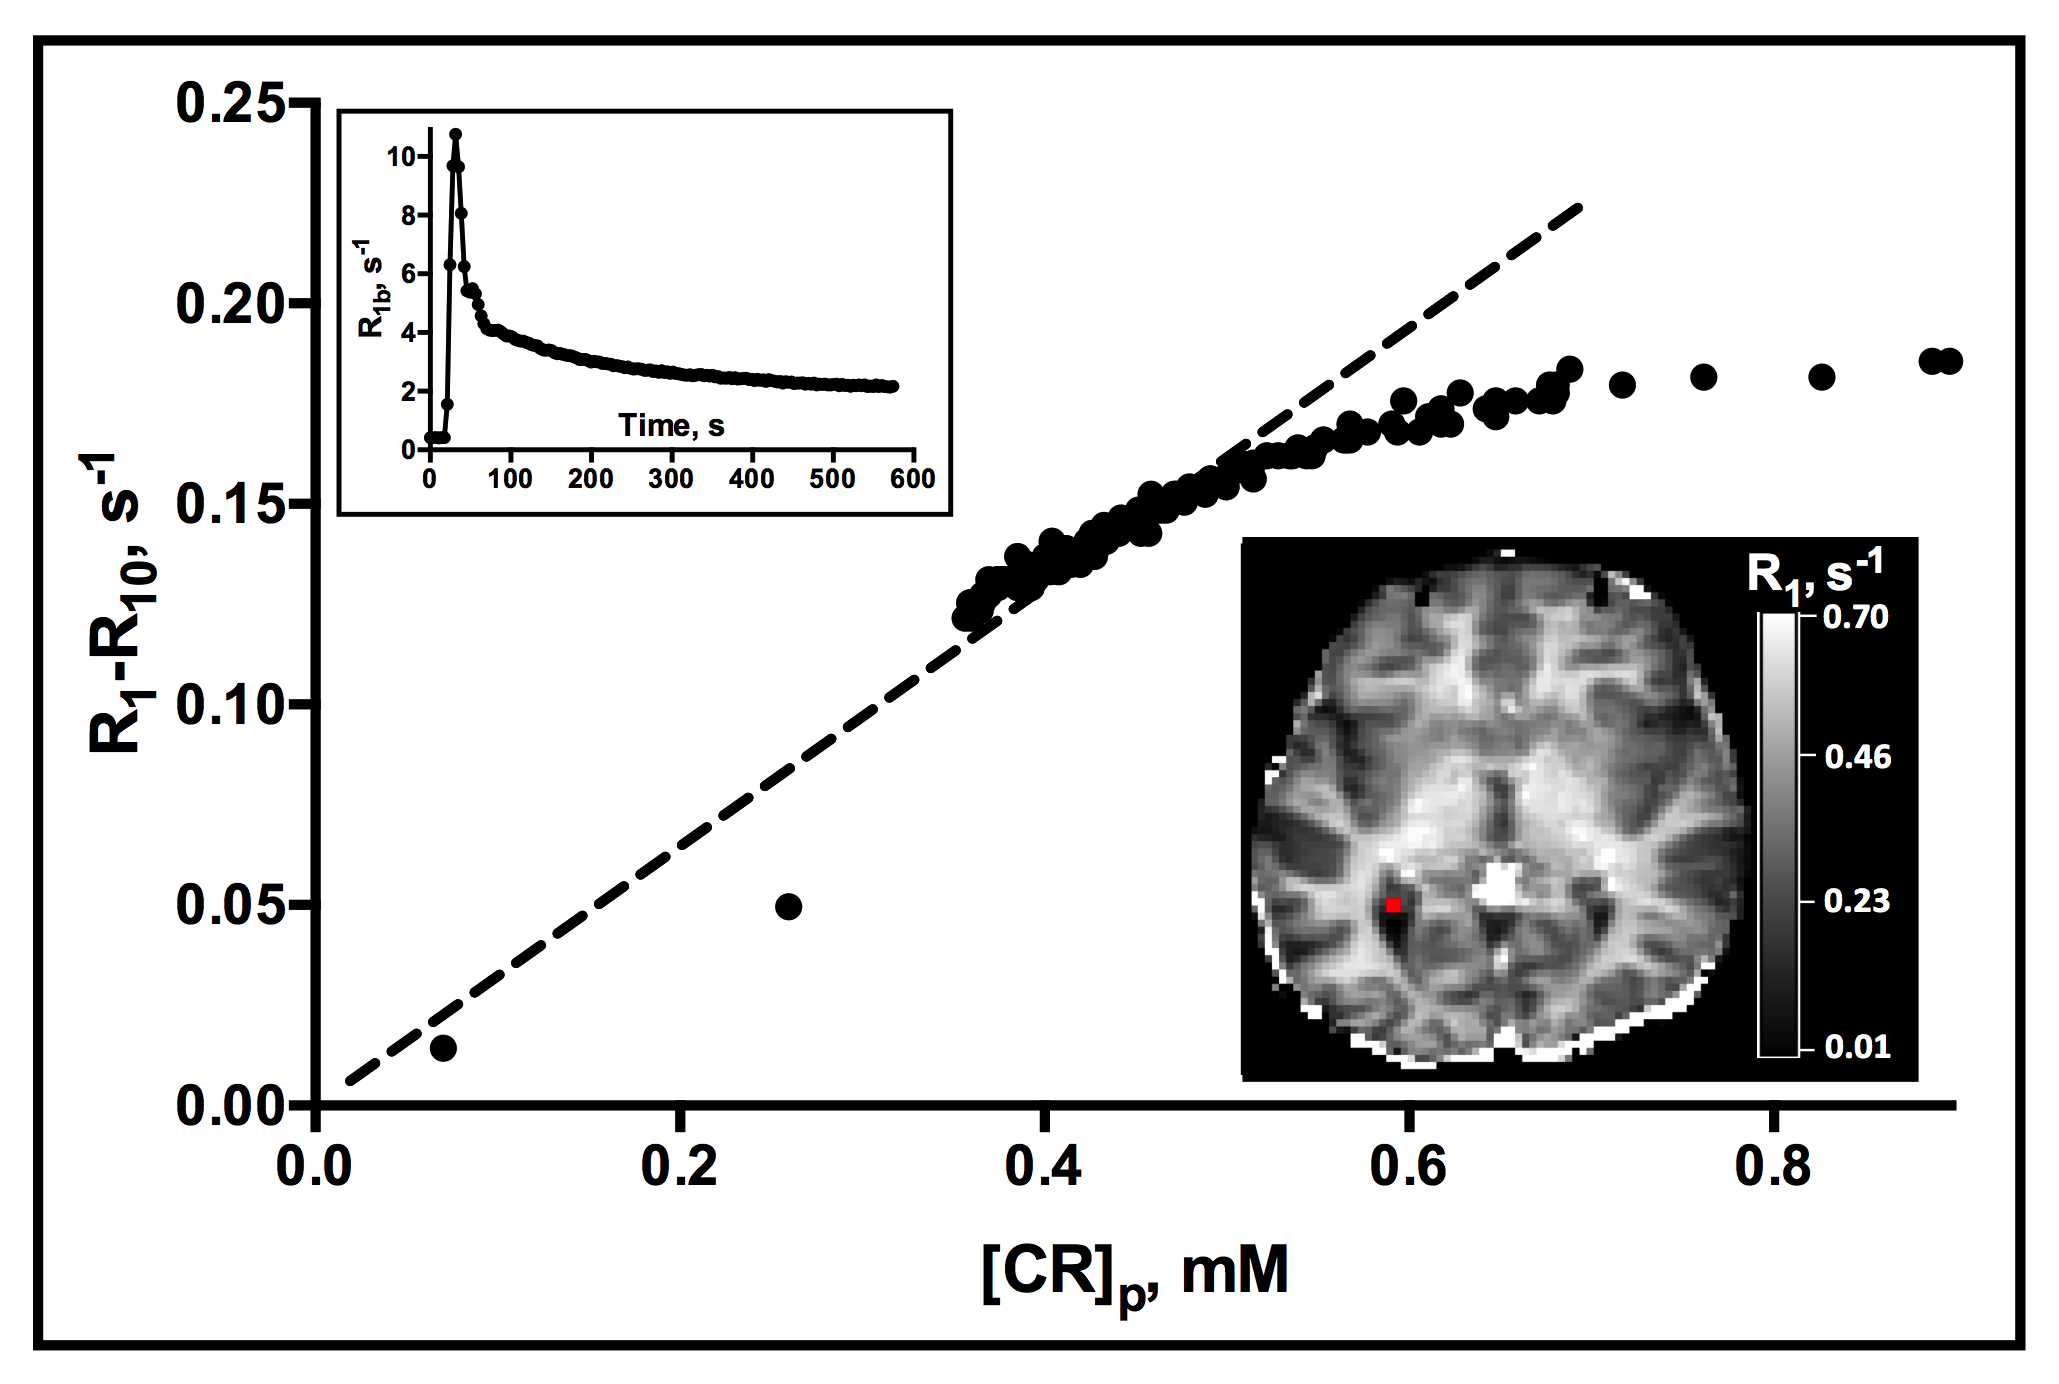
Choroid plexus R1 values were significantly increased post-contrast in all subjects. Changes in R1 values with plasma CR concentration, [CR]p, are shown in Fig. 2. The marked non-linearity of the plot indicates that water exchange departs the fast exchange limit at clinical levels of [CR]p. Plots of R1 time course data in the CP are shown in Fig. 3. The improved fit of the data to a model that incorporates water exchange effects on the MR signal is apparent.
Representative parametric maps are shown in Fig. 4. Although spatial heterogeneity is evident, estimates do not vary widely. Among all subjects, average values in the ROIs described above are: kep= 2.4 ± 1.0 min-1, ve= 0.05 ± 0.02, and kio= 0.26 ± 0.13 s-1. The kep and ve values found here are consistent with the fenestrated endothelial cells and densely-packed capillaries of the choroid plexus.8 The rate of ventricular water efflux has not been reported previously in the human CP. However, our finding of kio values that are 10-fold lower than in capillary endothelial cells of the brain parenchyma suggests that water reabsorption at the blood-CSF barrier may not be governed by the active water cycling processes thought to dominate at the blood-brain barrier.9
Mean kio values decreased with increasing age (R2= 0.28, P= .01) and lower MMSE scores (R2= 0.19, P= .04). Although kio was reduced in AD compared to HC subjects (0.22 ± 0.09 and 0.31 ± 0.1 s-1, respectively), group differences were not significant (P= 0.06).
Conclusions
These preliminary results demonstrate the feasibility of DCE-MRI as a quantitative in vivo probe of water exchange dynamics in the human CP and suggest that a compromised blood-CSF barrier may contribute to the pathologic changes that lead to cognitive decline in older individuals.Acknowledgements
Support: [NIH AG 046626, AG 008017, NS 040801, NS077350, S10OD018224, UL1 RR024140-04S1]References
1. Dubois B, Feldman H, Jacova C, et al. Research criteria for the diagnosis of Alzheimer’s disease: revising the NINCDS–ADRDA criteria. Lancet Neurol 2007; 6: 734-46.
2. Folstein M, Folstein S, McHugh P. "Mini-mental state": a practical method for grading the cognitive state of patients for the clinician. J Psychiatr Res 1975, 1: 189-98.
3. Deichmann R, Haase A. Quantification of T1 values by SNAPSHOT-FLASH NMR imaging. J Magn Reson 1992; 96: 608-712.
4. Markel M, Leupold J. Gradient echo imaging. J Magn Reson Imaging 2012; 35: 1274-89.
5. Jenkinson M, Smith S. A global optimisation method for robust affine registration of brain images. Med Image Anal 2001; 5: 143-56.
6. Li X, Rooney WD, Springer CS. A unified magnetic resonance imaging pharmacokinetic theory: Intravascular and extracellular contrast reagents. Magn Reson Med 2005; 54: 1351–59.
7. Ahearn TS, Staff RT, Redpath TW, et al. The use of the Levenberg-Marquardt curve-fitting algorithm in pharmacokinetic modelling of DCE-MRI data. Phys Med Biol 2005; 50: N85–N92.
8. Motti E, Imhof H, Janzer R, et al. The capillary bed in the choroid plexus of the lateral ventricles: a study of luminal casts. Scan Elec Micros 1986; Pt 4: 1501-13.
9. Rooney WD, Li X, Sammi MK, Bourdette DN, Neuwelt EA, Springer CS Jr. Mapping human brain capillary water lifetime: high-resolution metabolic neuroimaging. NMR Biomed 2015; 28: 607-23.
10. Luypaert R, Ingrisch M, Sourbron S., et al. The Akaike information criterion in DCE-MRI: does it improve the haemodynamic parameter estimates? Phys Med Biol 2012; 57: 3609-28.
Figures