4559
Contrast Agent-Induced High Signal Intensity in Dentate Nucleus on Unenhanced T1-Weighted Images: Comparison of Gadodiamide and Gadoxetic Acid1Department of Radiology, University of Yamanashi, Chuo-shi, Japan
Synopsis
Hyperintensity in the dentate nucleus (DN) on unenhanced T1-weighted images was associated with previous administration of gadodiamide but not gadoxetic acid. There were no significant differences in DN-to-pons ratio between patients who received five or more administrations of gadoxetic acid and those without gadolinium-based contrast agent administration or chronic liver disease. Hyperintensity in the dentate nucleus on unenhanced T1-weighted images is not associated with up to fifteen previous administrations of gadoxetic acid. Therefore, gadolinium deposition in the brain might be difficult despite a history of repeated gadoxetic acid administration.
Introduction and Purpose
Recent studies have reported an association between hyperintensity in the dentate nucleus (DN) and history of gadolinium-based contrast agents (GBCAs) administration (1-3). Even in patients with normal renal function, increased signal intensity in the DN and globus pallidus on unenhanced T1-weighted images has been reported to be positively correlated with previous exposure to linear chelate GBCAs but not to macrocyclic chelate GBCAs (4-6). This difference between the two types of GBCAs has been attributed to their differences in stability as well as to de-chelated gadolinium deposition. Although the actual risk has not been documented yet, it seems important to consider the potential unknown risks of residual gadolinium in our decision regarding GBCA administration and to make efforts to minimize any residual gadolinium in the body of patients. Gadoxetic acid is a widely used liver-specific magnetic resonance (MR) contrast agent introduced in 2008. Because it is a relatively new contrast agent, there have been no reports on brain deposition of gadoxetic acid. Therefore, this study aimed to evaluate whether an association exists between unenhanced T1-signal increase in the DN and previous administration of gadoxetic acid and gadodiamide.Methods
This retrospective study was approved by the institutional review board; the requirement for informed patient consent was waived. A total of 132 patients (male:female, 86:46; mean age, 68.8 ± 11.6 years) who underwent brain MR imaging using a 1.5-T MR system at our institution between December 2000 and April 2016 were divided into four groups: patients with five or more administrations of gadoxetic acid (“Gadoxetic acid ≥ 5 administrations”), only one administration of gadoxetic acid (“Gadoxetic acid 1 administration”), no gadolinium-based contrast agent (GBCA) administration or chronic liver disease (CLD; “No GBCA administration or CLD”), and five or more administrations of gadodiamide (“Gadodiamide ≥ 5 administrations”) (Table 1). Unenhanced T1-weighted images were quantitatively analyzed by two radiologists. Axial unenhanced T1-weighted images were acquired with the following parameters: repetition time (TR)/echo time (TE), 540/7-9 ms; section thickness, 5 mm; intersection gap, 1 mm; matrix size, 288 × 192; echo train length, 2; field of view (FOV), 220 mm; and number of excitations (NEX), 1. Intergroup comparison of DN-to-pons signal intensity ratios at regions of interest was performed by the Dunn test with the “No GBCA administration or CLD” group as control. Interobserver agreement was assessed by intraclass correlation coefficients (ICC).Results
The DN-to-pons ratio of the “Gadodiamide ≥ 5 administrations” group was significantly higher compared to that of the “No GBCA administration or CLD” group (P < 0.0001; Fig. 1). The DN-to-pons ratios of the “Gadoxetic acid ≥ 5 administrations” and “Gadoxetic acid 1 administration” groups did not differ significantly from that of the “No GBCA administration or CLD” group (P = 0.3912 and 1.0000, respectively; Fig. 1). While there was no obvious correlation between the number of previous administrations of gadoxetic acid and DN-to-pons ratio, the number of previous administrations of gadodiamide and DN-to-pons ratio were positively correlated (Fig. 2). Figs. 3 and 4 present representative clinical cases. The interobserver ICC for measurement of DN-to-pons ratio was excellent (0.835; 95% confidence interval, 0.767-0.883).Discussion
The results of the present study indicate that, while hyperintensity in the DN on unenhanced T1-weighted images is associated with previous administrations of gadodiamide, it has no correlation with up to fifteen previous administrations of gadoxetic acid. Gadoxetic acid contains half the concentration of gadolinium as extracellular GBCA, and its dosage of administration is half that of other GBCAs. Thus, investigations with gadoxetic acid utilize only a quarter the amount of gadolinium as those with other GCBAs (extracellular GBCAs, 0.1 mmol/kg vs. gadoxetic acid, 0.025 mmol/kg). However, gadoxetic acid is a linear chelate-type of contrast agent and exhibits greater stability than some of the other linear chelate-type of GBCAs such as gadodiamide (7,8). Therefore, gadolinium deposition in the brain might be difficult despite a history of repeated gadoxetic acid administration.Conclusion
Hyperintensity in the DN on unenhanced T1-weighted images is associated with previous administration of gadodiamide but not gadoxetic acid.Acknowledgements
No acknowledgement found.References
1) Kanda T, et al. Radiology. 2014;270(3):834-841.
2) Ramalho J, et al. J Magn Reson Imaging. Radiology 2015;276(3):836-844.
3) Hu HH, et al. Pediatr Radiol 2016;46(11):1590-1598.
4) Kanda T, et al. Radiology. 2015;275(3):803-809.
5) Radbruch A, et al. Invest Radiol 2015;50(12):805-810.
6) Cao Y, et al. AJR Am J Roentgenol 2016;206(2):414-419.
7) Schmitt-Willich H. Br J Radiol 2007;80(955):581-582; author reply 584-585.
8) Schmitt-Willich H, et al. Inorg Chem 1999;38(6):1134-1144.
Figures
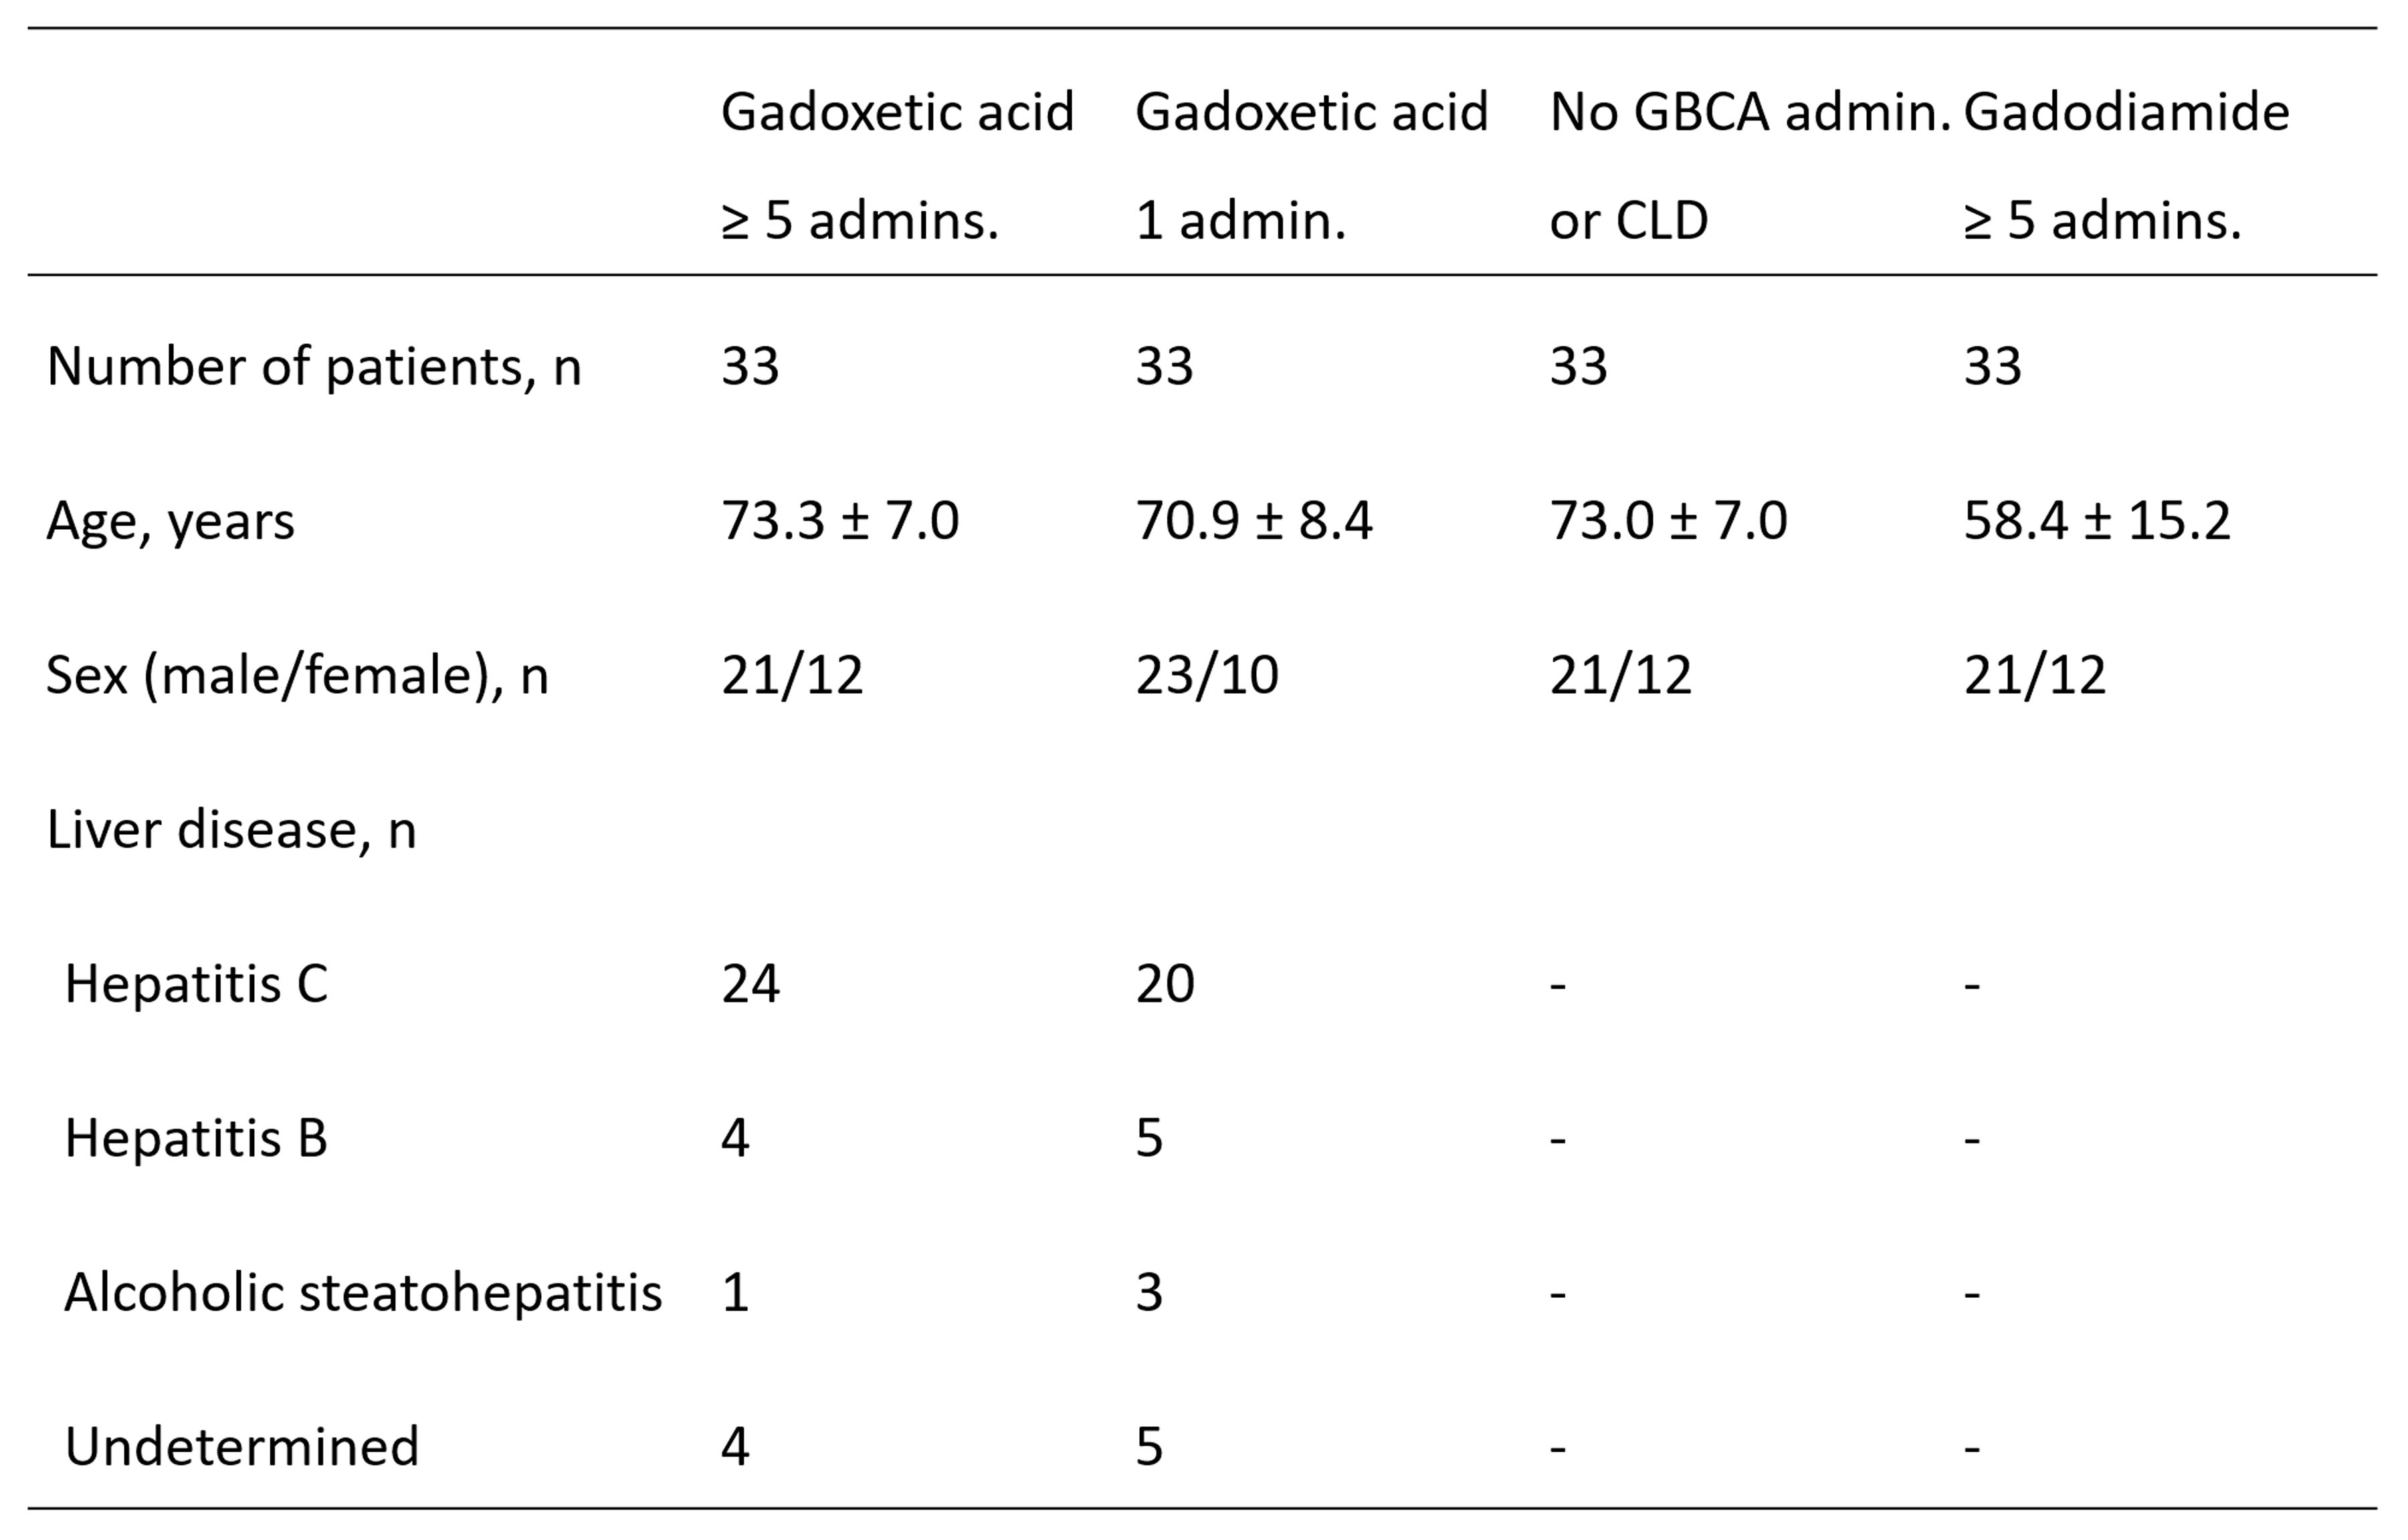
Table 1. Patient demographic data.
Sex and number of administrations of GCBA were matched between the “Gadoxetic acid ≥ 5 administrations” and “Gadodiamide ≥ 5 administrations” groups. Age and sex were matched between the “Gadoxetic acid ≥ 5 administrations” and “No GBCA administration or CLD” groups. The final study sample comprised 132 patients.
admin. = administration, GBCA = gadolinium-based contrast agent, CLD = chronic liver disease. Age is presented as mean ± standard deviation.
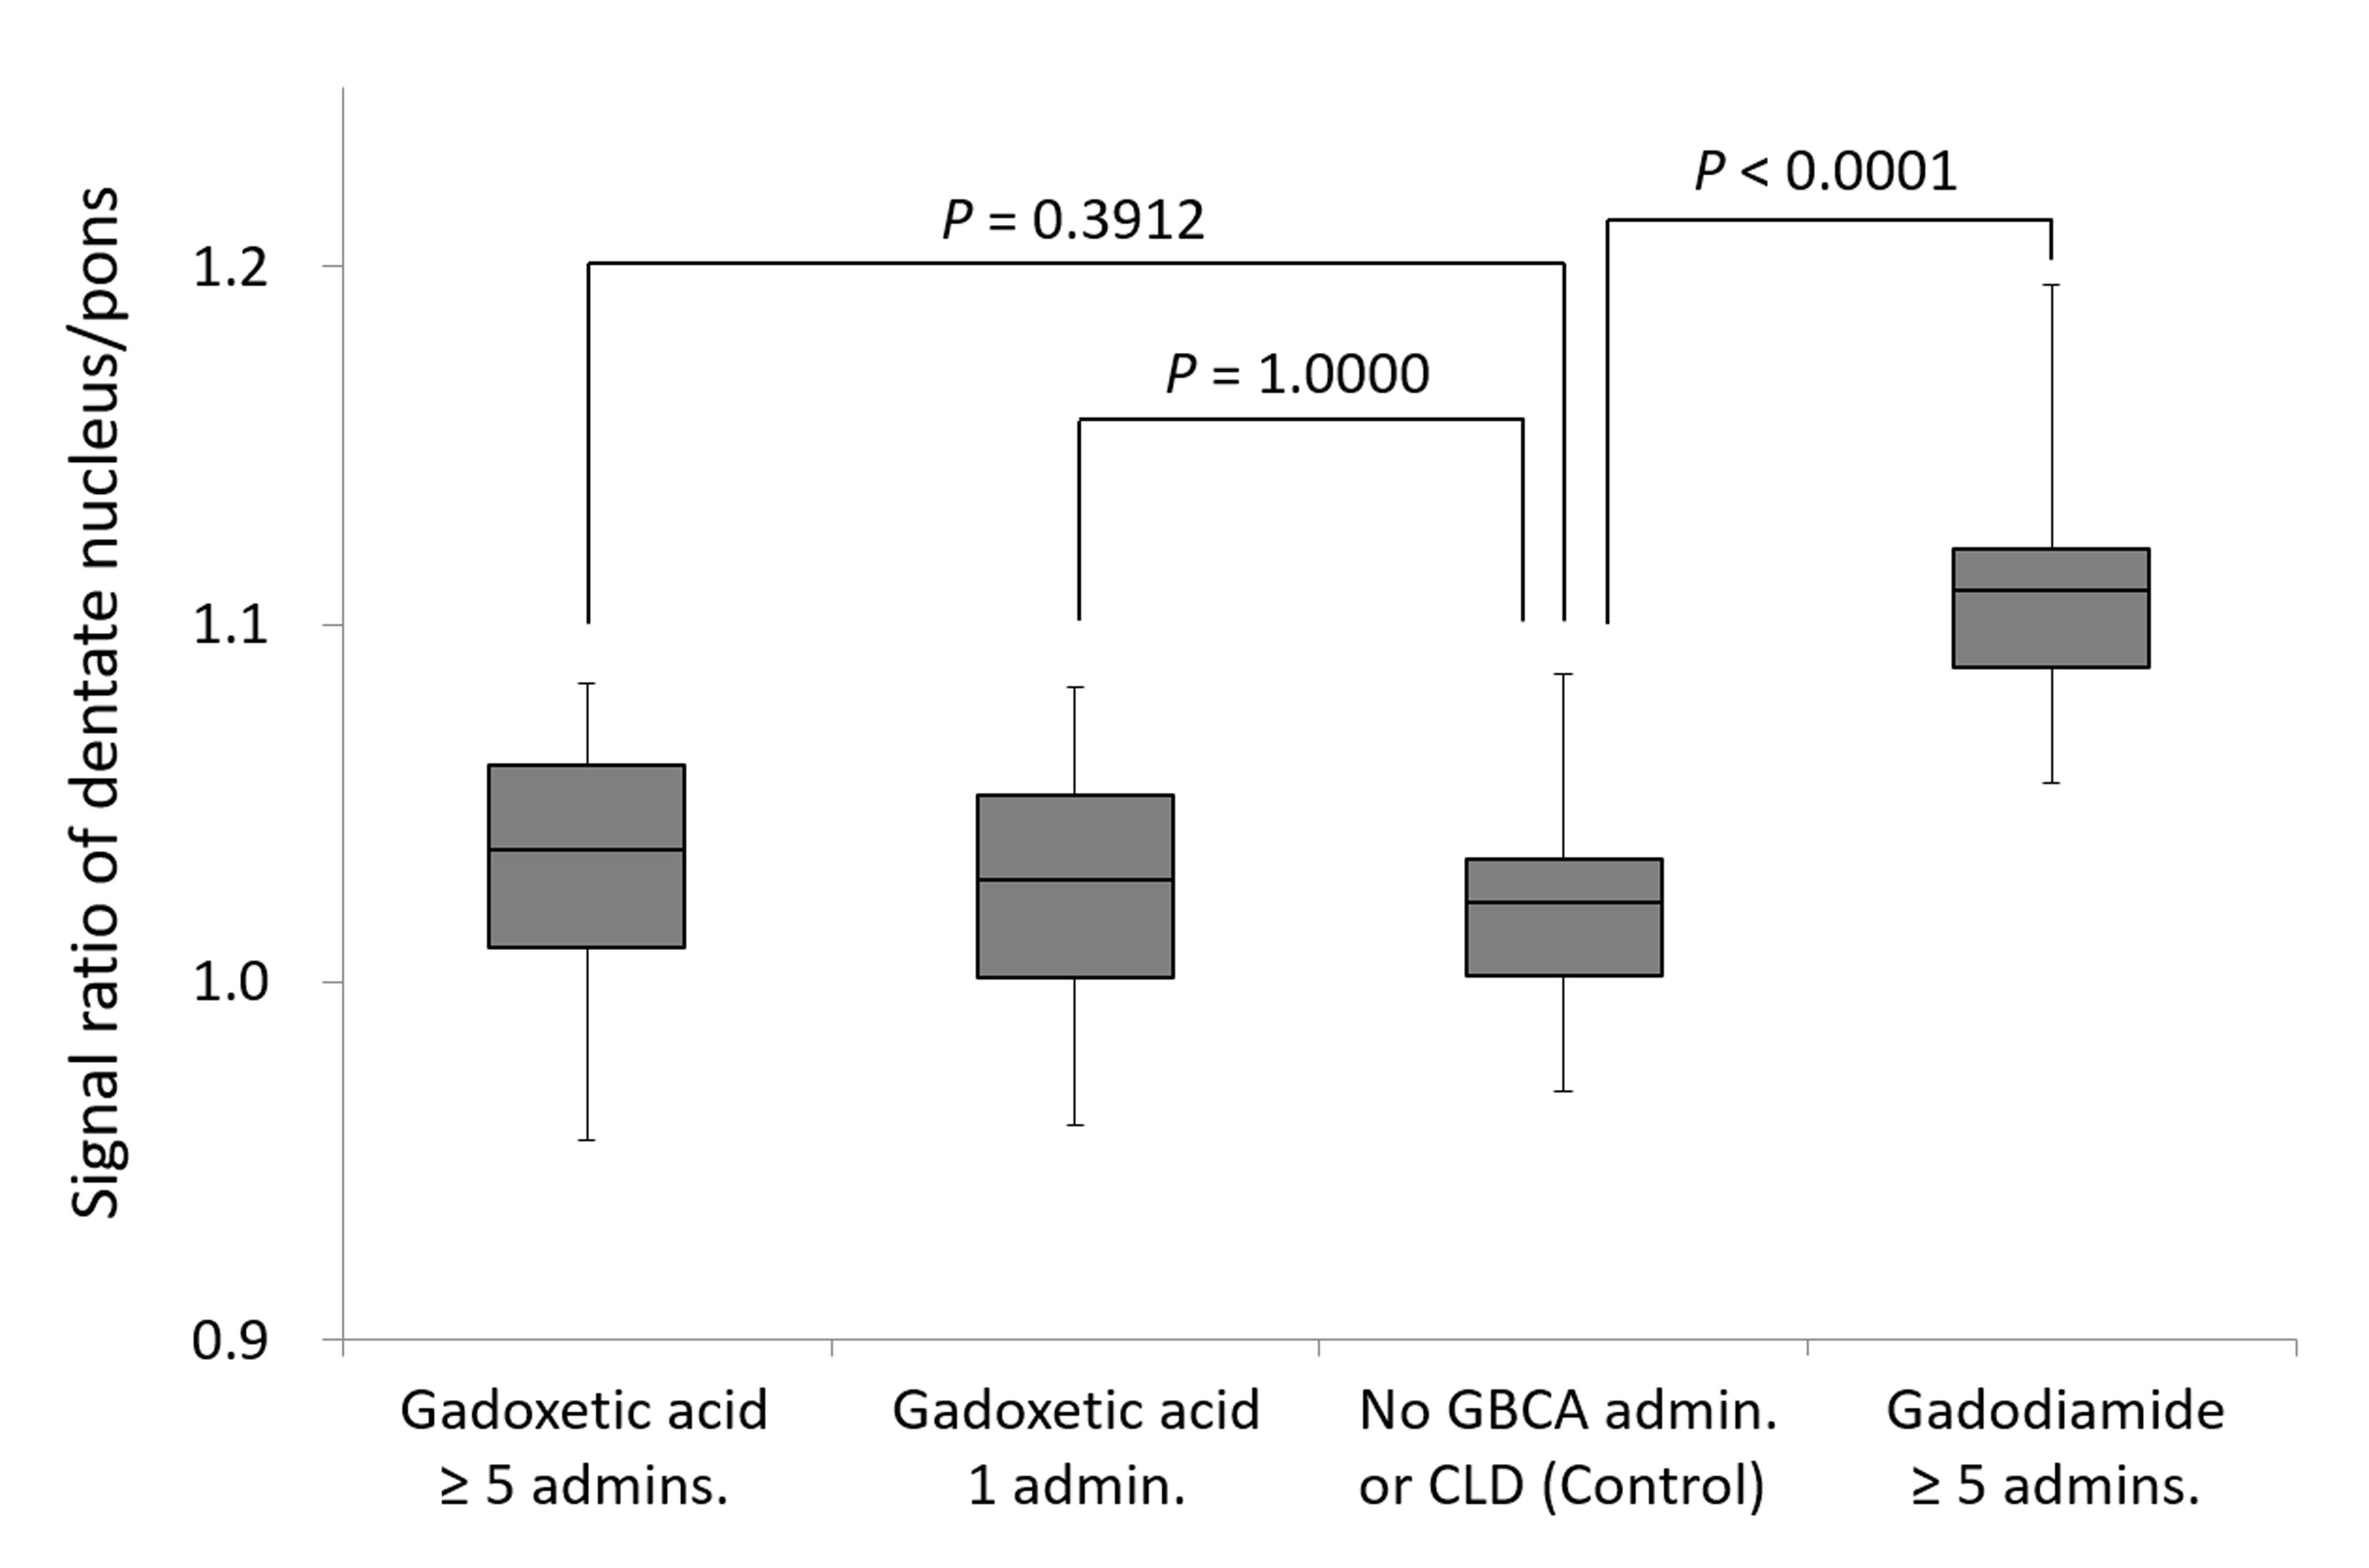
Fig. 1. Signal ratios of DN-to-pons in the four groups.
The DN-to-pons ratio of the “Gadodiamide ≥ 5 administrations” group was significantly higher compared to that of the “No GBCA administration or CLD” group (P < 0.0001). The DN-to-pons ratios of the “Gadoxetic acid ≥ 5 administrations” and “Gadoxetic acid 1 administration” groups did not differ significantly from that of the “No GBCA administration or CLD” group (P = 0.3912 and 1.0000, respectively).
DN = dentate nucleus, GBCA = gadolinium-based contrast agent, CLD = chronic liver disease, admin. = administration
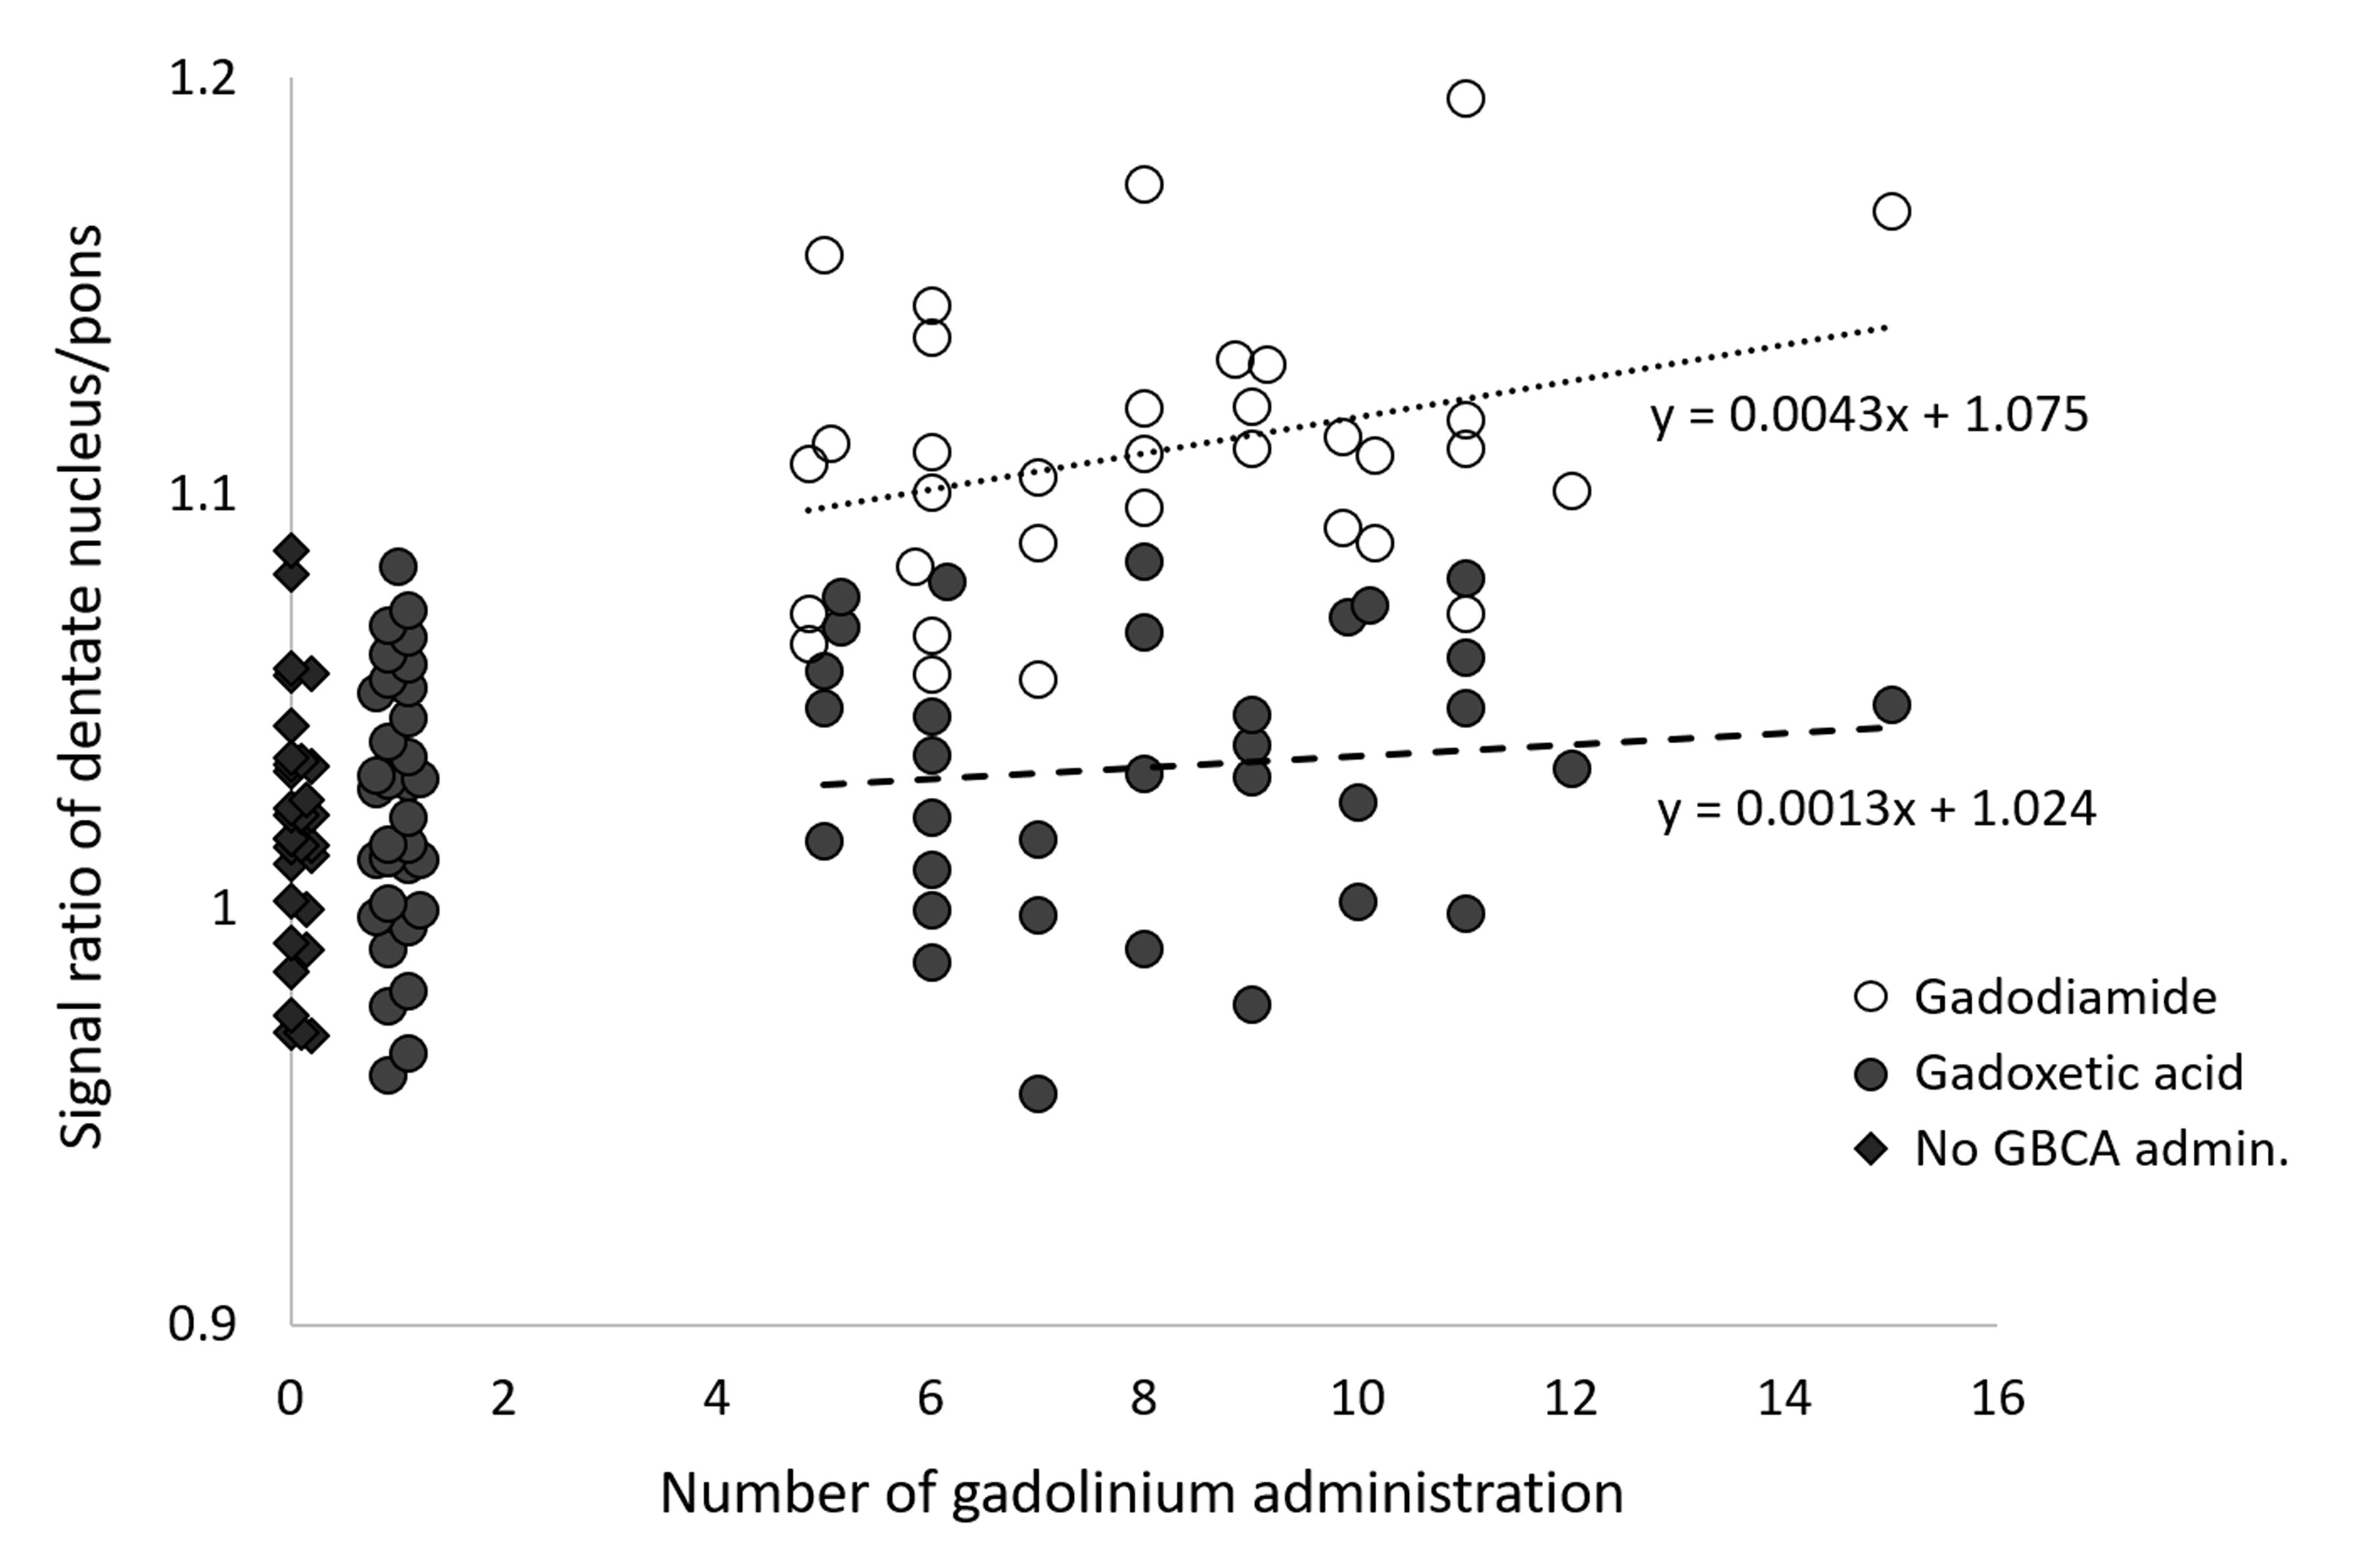
Fig. 2. Scatter plots of DN-to-pons ratio and number of previous administrations of gadodiamide or gadoxetic acid.
There was no obvious correlation between the number of previous administrations of gadoxetic acid and DN-to-pons ratio (black circle and rhombus). Meanwhile, the number of previous administrations of gadodiamide and DN-to-pons ratio (white circle) were positively correlated. Dashed lines represent linear regression of the “Gadodiamide ≥ 5 administrations” and “Gadoxetic acid ≥ 5 administrations” groups.
DN = dentate nucleus
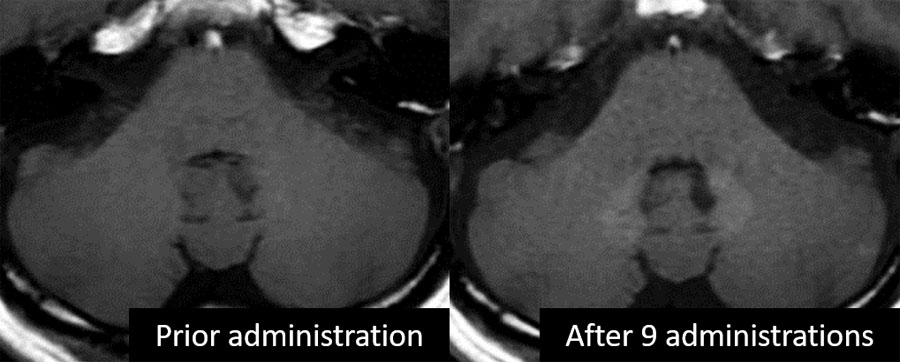
Fig. 3. Imaging findings of a 59-year-old man who received nine administrations of gadodiamide.
While the DN does not exhibit hyperintensity on unenhanced T1-weighted images acquired prior to gadodiamide administration, it appears hyperintense on unenhanced T1-weighted images acquired after nine administrations of gadodiamide.
DN = dentate nucleus.
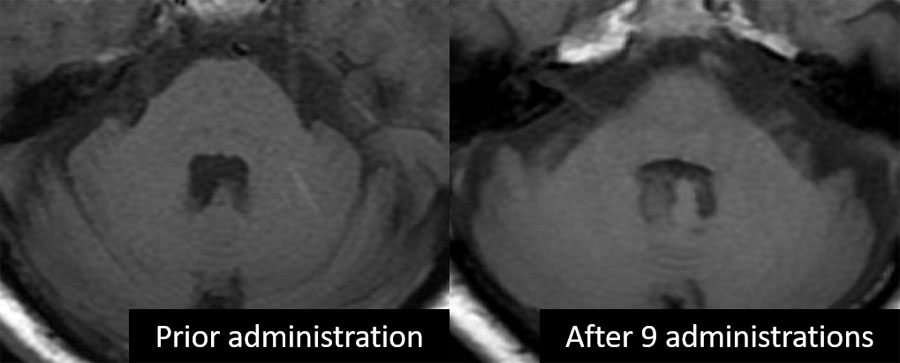
Fig. 4. Imaging findings of a 75-year-old man who received nine administrations of gadoxetic acid.
The dentate nucleus does not exhibit hyperintensity on unenhanced T1-weighted images acquired before or after nine administrations of gadoxetic acid.