4557
Quantitative and qualitative evaluation of "Flexible PET/MRI" images in brain1Department of Diagnostic Imaging and Nuclear Medicine, Kyoto University Graduate School of Medicine, Kyoto, Japan, 2Human Brain Research Center, Kyoto University Graduate School of Medicine, Kyoto, Japan
Synopsis
A newly developed " Flexible PET (fxPET)" is a prototype of MR-compatible mobile PET system. We tried to investigate the clinical feasibility of the fxPET with a 1.5T MRI compared with PET/CT for brain imaging. Twenty-one patients ( including 12 patients with known intracranial masses) were enrolled in this study. We compared misregistration between fxPET/MRI and PET/CT, and compared the image quality of fxPET and PET in both qualitative (visual rating) and quantitative (standardized uptake value (SUV)-based analysis ) manner. Consequently, fxPET/MRI showed acceptable misregistration and enough image quality, revealing clinical feasibility comparable to that of PET/CT.
Introduction
Some previous studies1-3 using a hybrid positron emission tomography (PET)/magnetic resonance imaging (MRI) system have shown that combining the sensitive molecular imaging capability of PET with the high soft-tissue contrast of MRI has potential clinical benefits such as diagnostic accuracy. Especially for brain imaging, the role of PET/computed tomography (CT) is limited, as CT images do not show enough contrast to identify the small structures in brain. PET/MRI seems to be a preferable option due to excellent soft-tissue contrast of MRI.
However, it is not always easy to introduce such hybrid PET/MRI systems in medical facilities, due to some practical problems such as cost and space. If a mobile PET system is available, we can combine it with an existing MR unit in daily clinical settings. "Flexible PET (fxPET) is a newly developed device, which is a prototype of MR-compatible mobile PET system4, 5 (see Materials and methods).
Purpose
The purpose of this study was to evaluate the clinical feasibility of the fxPET with a 1.5T MRI (fxPET/MRI) as compared with PET/CT for brain imaging. Firstly, we compared misregistration between fxPET/MRI and PET/CT. Secondly, we examined whether the PET image quality obtained with fxPET/MRI was comparable to that obtained with PET/CT, in spite of different PET detector and attenuation correction methods.Materials and methods
Patients
Twenty-one patients (13 female, 8 male; age range 21-77 years; mean, 53±15 years) were enrolled in this study. Twelve patients had known intracranial lesions.
fxPET/MRI
Flexible PET (fxPET) is a dual-head mobile PET system, based on a silicon photomultiplier (SiPM)-based depth-of-interaction (DOI) time-of-flight (TOF) detector with MR compatibility (Shimadzu) (Figure 1A). Setting the fxPET in an existing MR unit, where 1.5T MR scanner (Excelart Vantage, Toshiba) was equipped, we achieved fxPET/MRI unit enabling sequential acquisition of PET and MRI images (Figure 1B).
Protocol
All subjects underwent a single-injection of 18F-fluoro-2-deoxy-D-glucose (FDG) and dual imaging (whole-body PET/CT with subsequent brain fxPET/MRI). PET/CT scans were performed based on standard clinical protocols. Subsequently, at the fxPET/MRI unit, fxPET scans were performed, followed by MRI scans.
Data processing and image analysis
PET images were reconstructed iteratively. Attenuation correction and scatter correction were performed using low-dose CT image for PET/CT, while using MRI T1-weighted image (T1WI) for fxPET/MRI.
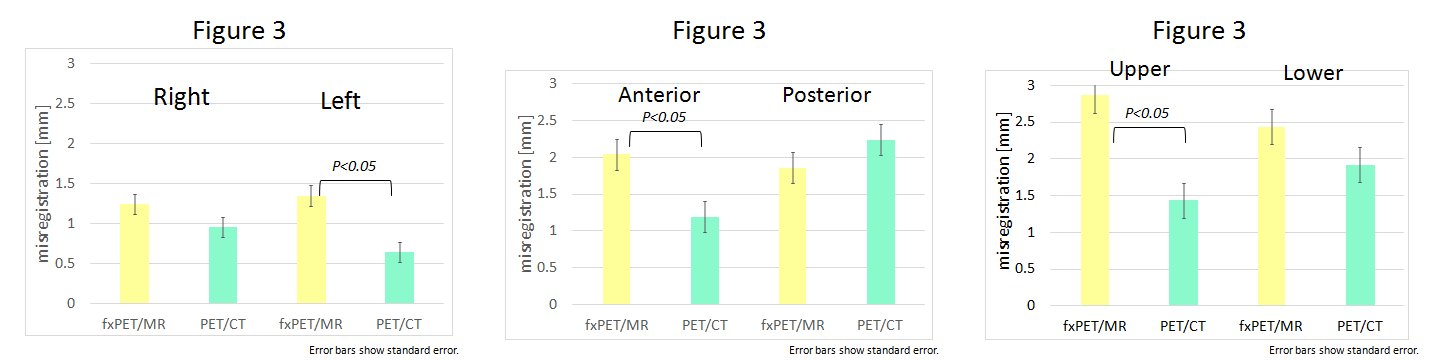
For evaluation of misregistration6, 7 we firstly determined 6 margins (right and left, anterior and posterior, and upper and lower) of the physiologic uptake of the brain in PET and CT images. Next, we calculated the difference between the two images for each margin. Same procedures was applied to fxPET and T1WI images.
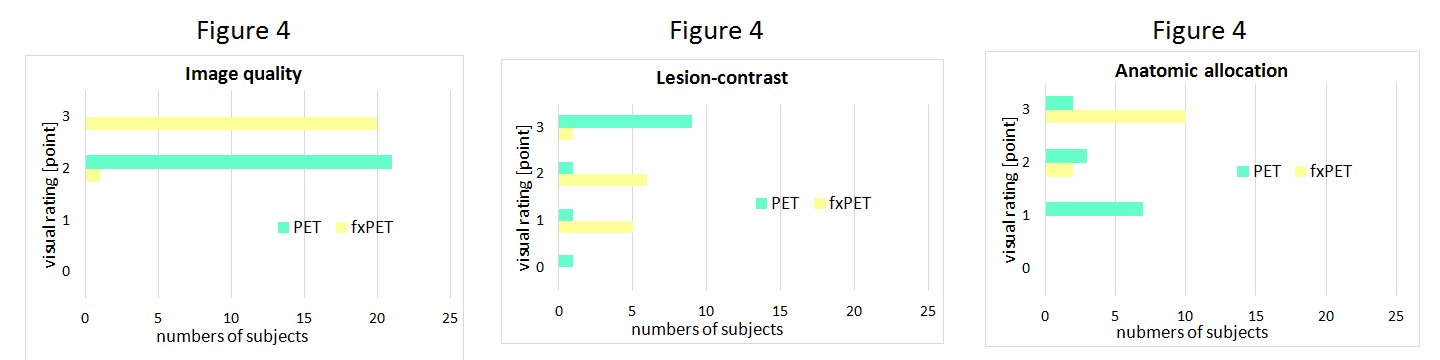
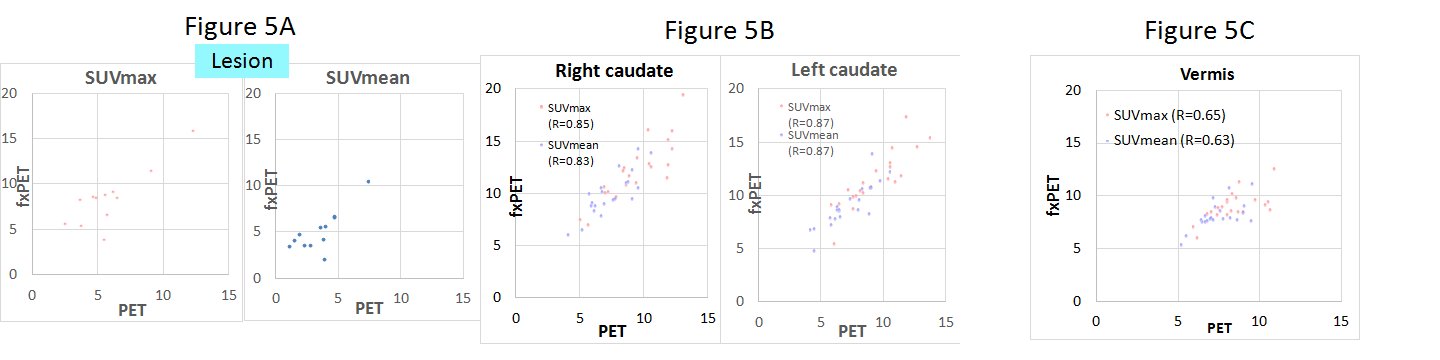
For evaluation of image quality (Figure 2), we performed visual rating and a standardized uptake value (SUV)-based analysis8, 9. As visual rating, we assessed the overall image quality of the PET image, the subjective contrast of the lesion in the PET image, and the feasibility of anatomic allocation of the PET lesion in the low-dose CT images and MRI (T1WI), related to the lesion detectability of PET/CT and fxPET/MRI. For SUV-based analysis, we firstly coregistered both PET images using the T1WI and normalized them in order to match the coordinate of the region of interest (ROI). As ROI, we selected the lesions and normal structures (bilateral caudate and vermis). Next, we measured maximum SUV (SUVmax) and mean SUV (SUVmean) within each ROI.
Resuts
The average misregistration of fxPET/MRI and PET/CT was shown in Figure 3. Although the average misregistration of PET/CT was significantly smaller than that of fxPET/MRI in the left, anterior and superior margin (p<0.05), there was no significant difference between them in the right, posterior and inferior margin.
Figure 4 showed the result of visual rating. The overall PET image quality and the subjective contrast of the lesion were better in PET than in fxPET, while the feasibility of anatomic allocation of the PET lesion in MRI (T1WI) was better than that in the low-dose CT images. The numbers of lesions detected did not show significant difference between PET/CT and fxPET/MRI (14:13).
As shown in Figure 5, SUVs (SUVmax and SUVmean) showed high correlation between PET/CT and fxPET/MRI, both in lesions and normal structures.
Discussion
The misregistration in fxPET/MRI was slightly larger than that in PET/CT, which was similar in previous studies7 comparing sequential PET/MRI with PET/CT. Although the image quality of fxPET was not as same as that of PET/CT, it was enough diagnostic quality, showing the comparable lesion detectability.Conclusion
This study showed clinical feasibility of "Flexible PET" combined with MRI for brain imaging comparable to that of PET/CT.Acknowledgements
This study was conducted as a part of the project supported by NEDO (New Energy and Industrial Technology Development Organization).References
1. Quick HH, von Gall C, et al. Integrated whole-body PET/MR hybrid imaging: clinical experience. Invest Radiol. 2013; 48(5): 280-9
2. Garibotto V, Heinzer S, et al. Clinical applications of hybrid PET/MRI in neuroimaging. Clin Nucl Med. 2013; 38(1): e13-8
3. Boss A, Weiger M and Wiesinger F. Future image acquisition trends for PET/MRI. Semin Nucl Med. 2015; 45(3): 201-11
4. Kobayashi T and Kitamura K. Design considerations for a partial-ring, multi-modal compatible whole-body TOF PET scanner: Flexible PET. Nuclear Science Symposium and Medical Imaging Conference (NSS/MIC), 2012 IEEE, pp. 2807-2812, 2012
5. Yamakawa Y, Kobayashi T, et al. Development of a dual-head mobile DOI-TOF PET system having multi-modality compatibility. Nuclear Science Symposium and Medical Imaging Conference (NSS/MIC), 2014 IEEE, pp. 1-3, 2014
6. Nakamoto Y, Sakamoto H, et al. Accuracy of image fusion using a fixation device for whole-body cancer imaging. Am J Roentgenol. 2005; 184(6): 1960-6
7. Brendle CB, Schmidt H, et al. Simultaneously acquired MR/PET images compared with sequential MR/PET and PET/CT: Alignment quality. Radiology. 2013; 268(1): 190-9
8. Eiber M, Martinez-Mollar A, et al. Value of a Dixon-based MR/PET attenuation correction sequence for the localization and evaluation of PET-positive lesions. Eur J Nucl Med Mol Imaging. 2011; 38(9): 1691-701
9. Zeimpekis KG, Barbosa F, et al. Clinical Evaluation of PET image Quality as a Function of Acquisition Time in a New TOF-PET/MRI Compared to TOF-PET/CT -Initial Results. Mol Imaging Biol. 2015; 17(5): 735-44
Figures
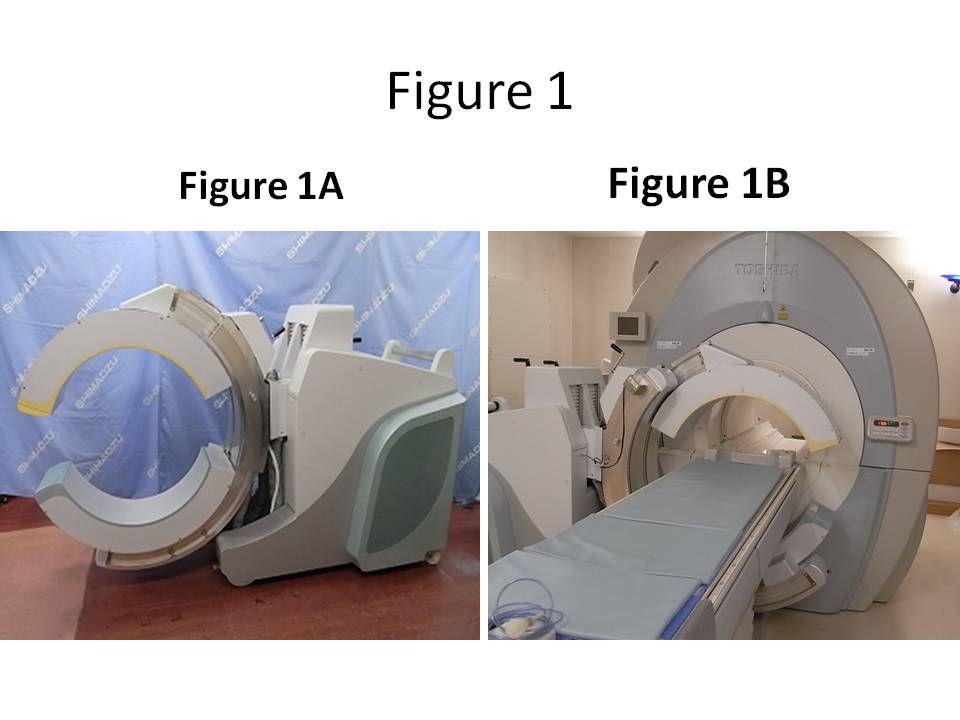
Figure 1. Illustration of "Flexible PET"/MRI system
(A) Flexible PET (fxPET) scanner
(B) fxPET with a 1.5T MR scanner
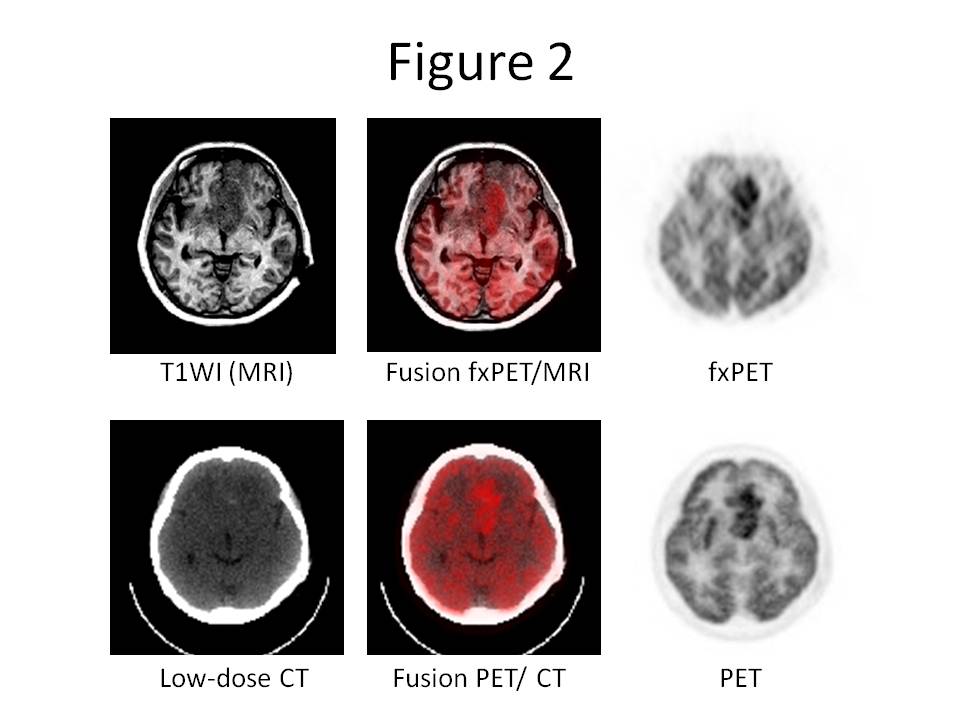
Figure 2. Example of fxPET/MRI and PET/CT image with suspected glioblastoma.
(Top) fxPET/MRI data: T1-weighted image (left), fusion image (center), and fxPET image (right). (Bottom) PET/CT data: low-dose CT image (left), fusion image (center), and PET image (right)