4555
Ex-vivo Quantitative Susceptibility Mapping of Human Brain Hemispheres1Department of Biomedical Engineering, Illinois Institute of Technology, Chicago, IL, United States, 2Rush Alzheimer's Disease Center, Rush University Medical Center, Chicago, IL, United States, 3Department of Diagnostic Radiology, Rush University Medical Center, Chicago, IL, United States, 4Department of Neurological Sciences, Rush University Medical Center, Chicago, IL, United States, 5Department of Pathology, Rush University Medical Center, Chicago, IL, United States
Synopsis
In order to establish the role of quantitative susceptibility mapping (QSM) as a diagnostic tool in aging, it is essential to combine QSM with direct assessments of age-related brain pathologies on the same individuals. Using ex-vivo QSM for this purpose may be more advantageous than in-vivo QSM, since ex-vivo QSM assesses the brain in the same condition as histology, and allows imaging of older adults independent of frailty level. However, being able to translate ex-vivo QSM findings to in-vivo is crucial. Therefore, our goal was to investigate the effects of death and fixation on brain QSM data collected ex-vivo.
Purpose
To assess the behavior of ex-vivo human brain magnetic susceptibility as a function of time postmortem, and to establish the relationship between susceptibility measurements conducted in-vivo and ex-vivo in the same brain hemispheres.Methods
Sixteen participants were recruited from the Rush Memory and Aging Project and Religious Orders Study, two longitudinal studies of aging1,2.
Data Acquisition
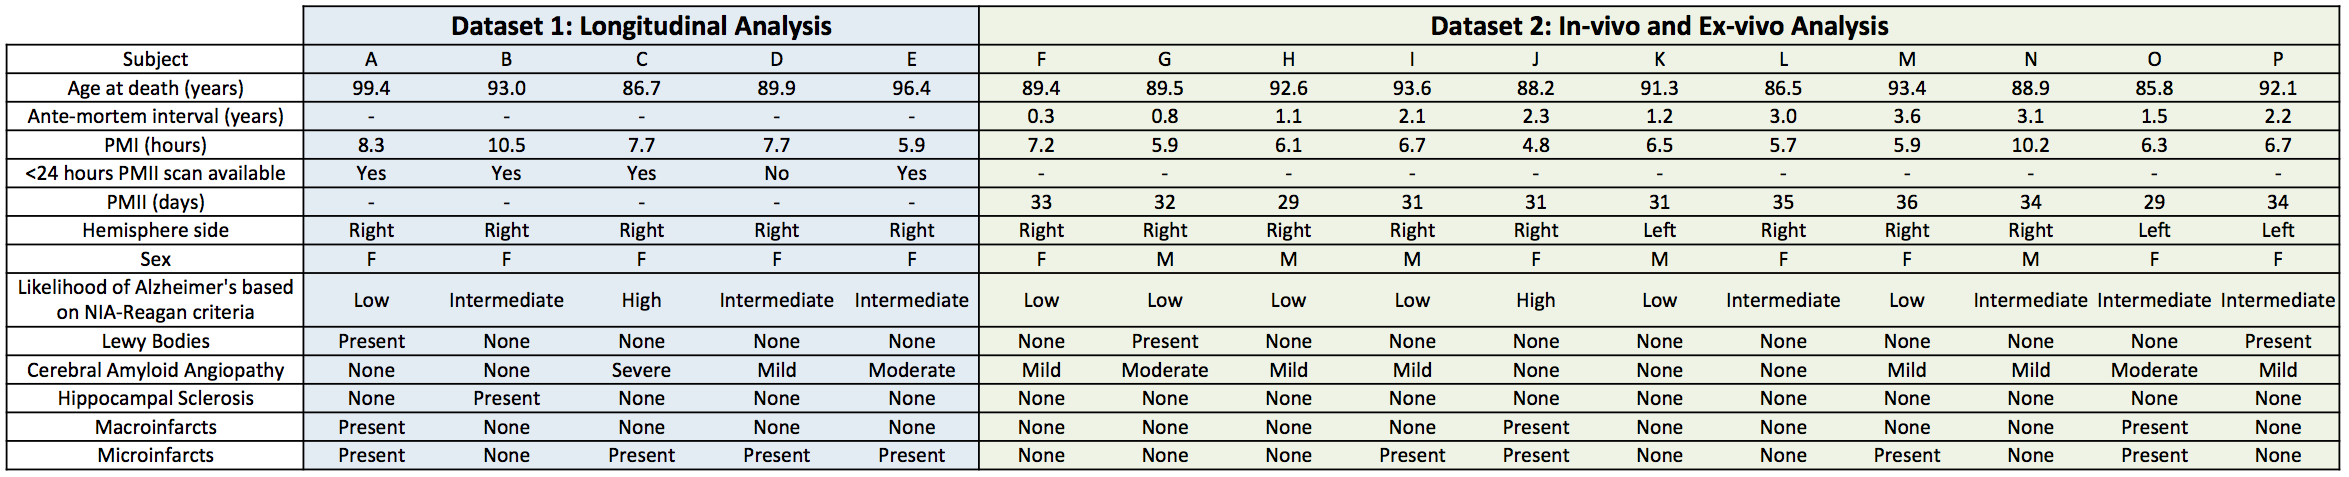
Two datasets were used in this work (Fig.1). Dataset 1 was used to assess the behavior of magnetic susceptibility over time postmortem. Dataset 2 was used to establish the relationship between in-vivo and ex-vivo magnetic susceptibility.
Dataset 1: Ex-vivo MRI data were collected weekly for six weeks on hemispheres from five participants using a 3T MRI scanner with a 3D gradient-echo sequence (10 echoes, TE1/ΔTE/TR=4.6/4.63/49.5ms), and a 2D spin-echo sequence (5 echoes, TE1/ΔTE/TR=16.5/16.5/4055ms).
Dataset 2: Both in-vivo and ex-vivo MRI data were collected on eleven participants. Participants were scanned in-vivo using a 1.5T MRI scanner with a 2D gradient-echo sequence (2 echoes, TE1/TE2/TR=8/17.1/2000ms), and also ex-vivo, approximately 30 days postmortem, using the scanner and protocol described in Dataset 1.
Quantitative Susceptibility Mapping (QSM)
Total field maps were produced for the in-vivo and ex-vivo QSM data5. Local fields were calculated using RESHARP6. Magnetic susceptibility maps were created with MEDI7, and processed with consistency on cone data8 (CCD) to suppress streaking artifacts. The reference values for in-vivo and ex-vivo QSM maps were the mean susceptibility value of cerebrospinal fluid in the ventricles and the formaldehyde solution, respectively.
Longitudinal Assessment of Ex-vivo Susceptibility
For each participant in Dataset 1, spin-echo data from all time-points were linearly registered9 to those collected six weeks postmortem. Caudate, putamen, and globus pallidus were manually selected on the reference images, and mean susceptibility values were recorded for each time-point.
Considering the susceptibility measurements at all time-points, the ratio of the variation between participants to the total variation was calculated for each region, using components of variance analysis (100 bootstraps). A ratio near 1 suggests that the total variation is largely due to differences between-participants and not due to changes over time postmortem. Ratios from all regions were averaged.
Relationship Between In-vivo and Ex-vivo Susceptibility
For each participant in Dataset 2, ex-vivo gradient-echo data were nonlinearly registered10 to the in-vivo data. Caudate, putamen, and globus pallidus were manually selected on the ex-vivo gradient-echo data, and mean susceptibility values were recorded for in-vivo and ex-vivo data.
Ex-vivo susceptibility measurements from all regions and participants were regressed on their corresponding in-vivo measurements from the same participants, using linear mixed modeling with random effects for the slope (1000 bootstraps). For each iteration, the ratio of the regression’s residual variance over the total variance of the ex-vivo susceptibility was calculated. A low ratio suggests that ex-vivo susceptibility can be well modeled as a linear function of in-vivo susceptibility.
Results and Discussion
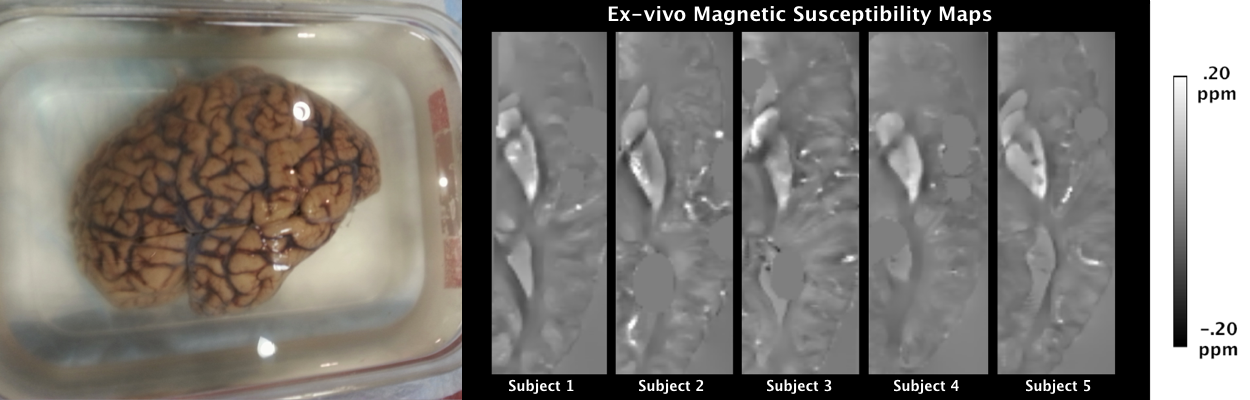
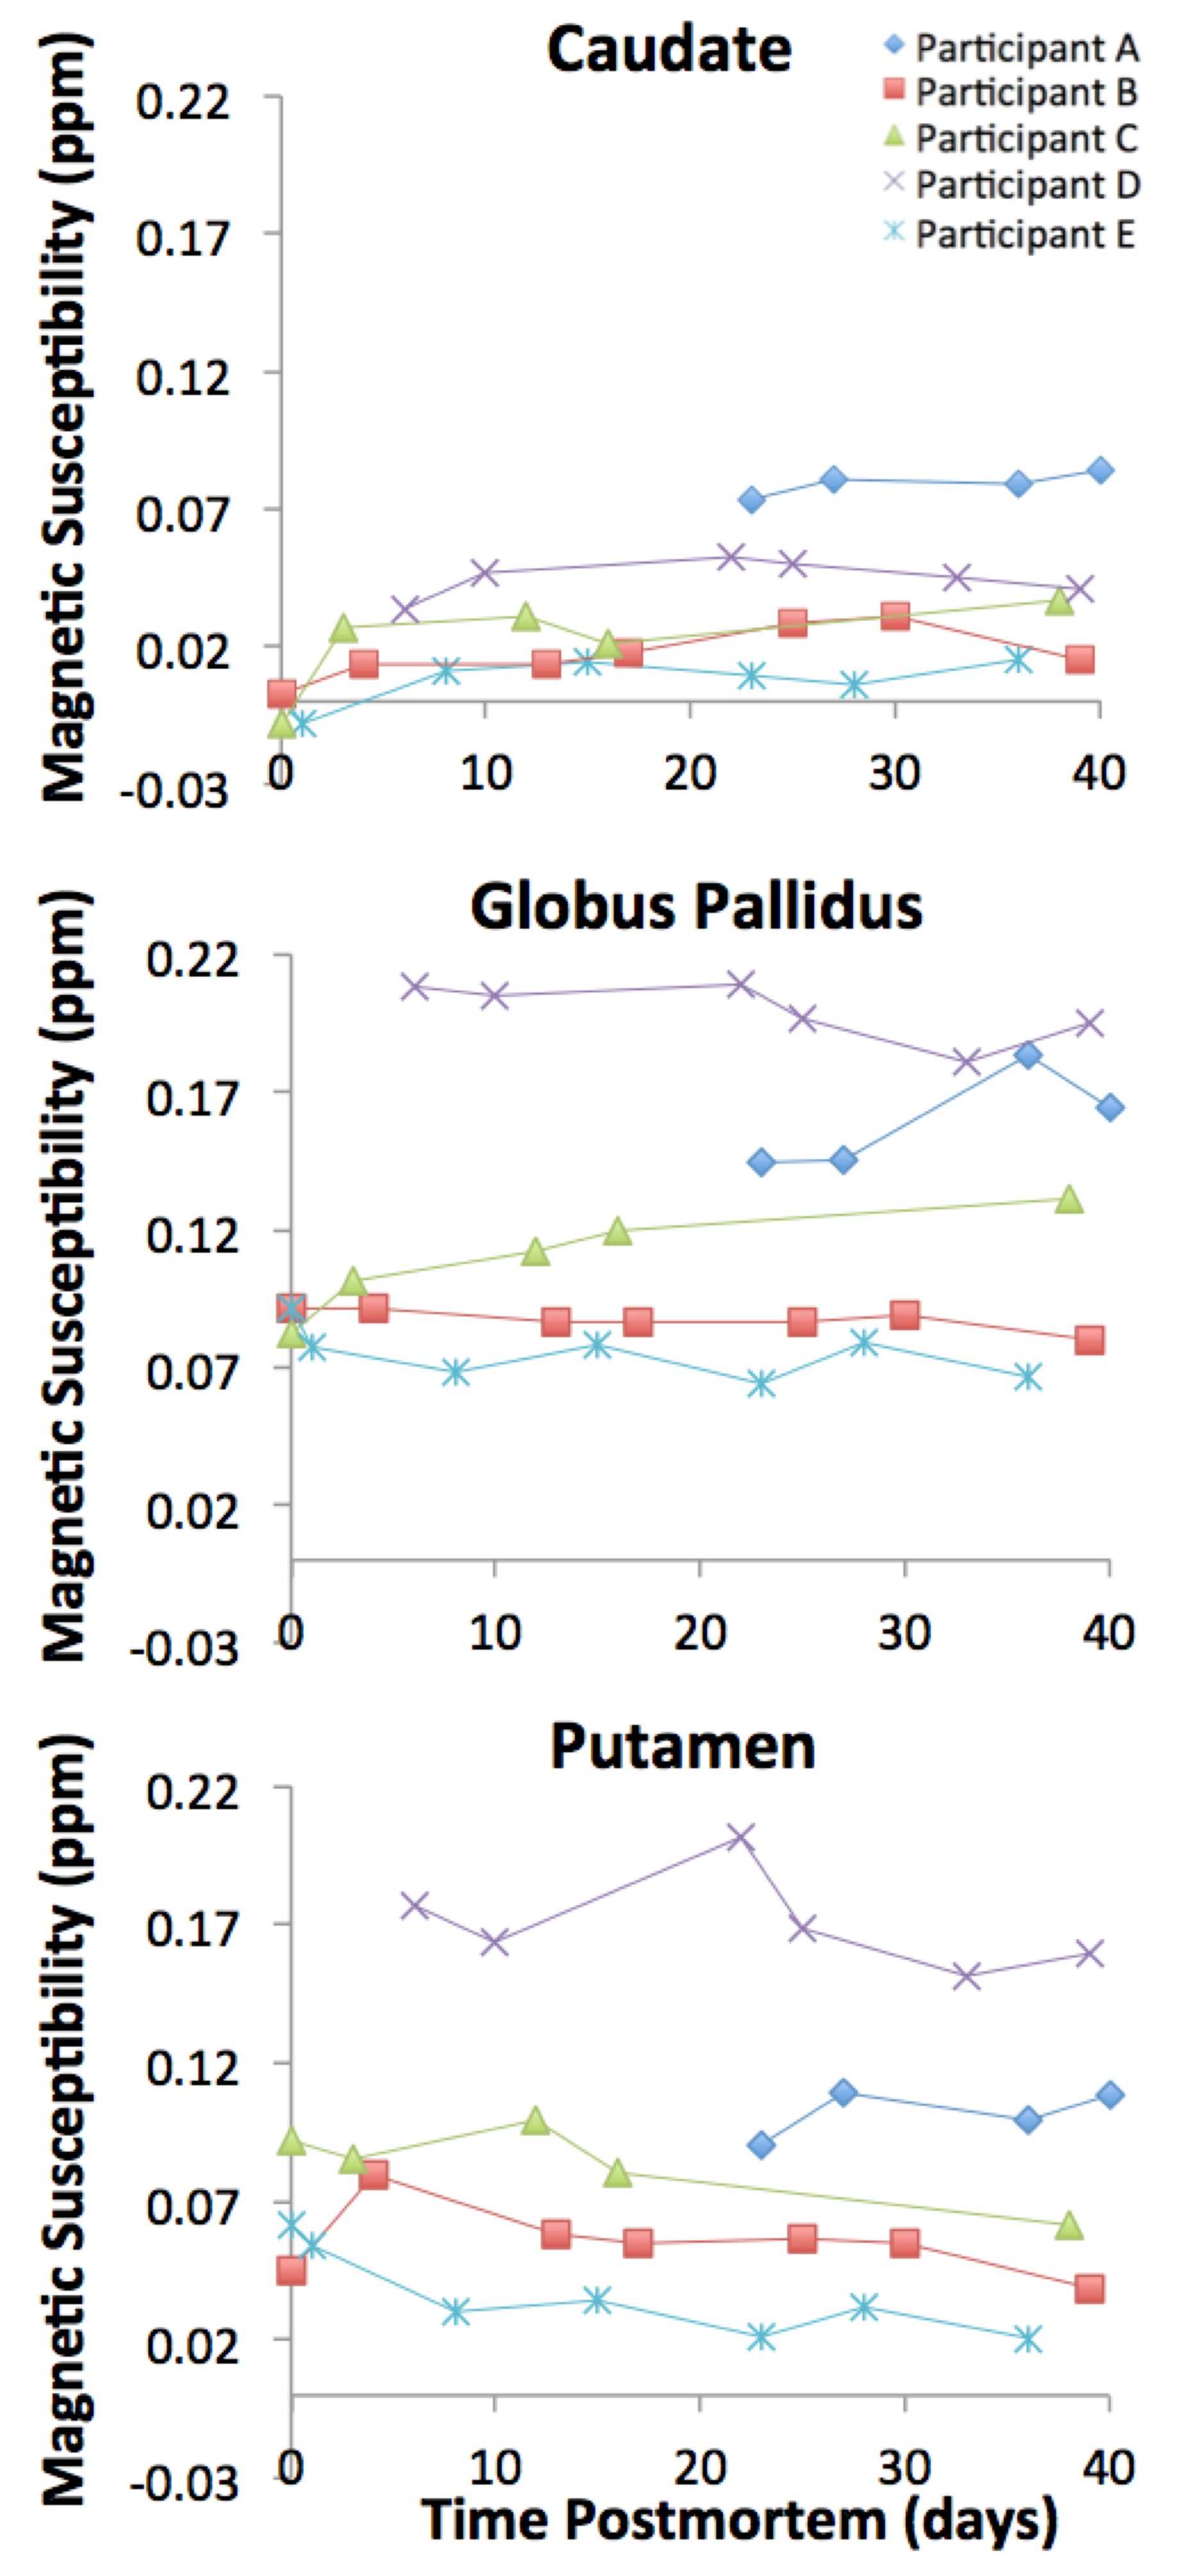
Inspection of ex-vivo susceptibility maps revealed features similar to those of published in-vivo maps on older adults11 (Fig.2). Ex-vivo susceptibility values in the caudate, globus pallidus, and putamen remained relatively constant over time postmortem (Fig.3). Components of variance analysis yielded a ratio of 0.85±0.09 (CI=[0.53,0.94]), suggesting that the total variation in ex-vivo susceptibility was mostly due to differences between participants rather than changes within participants over time postmortem12,13.
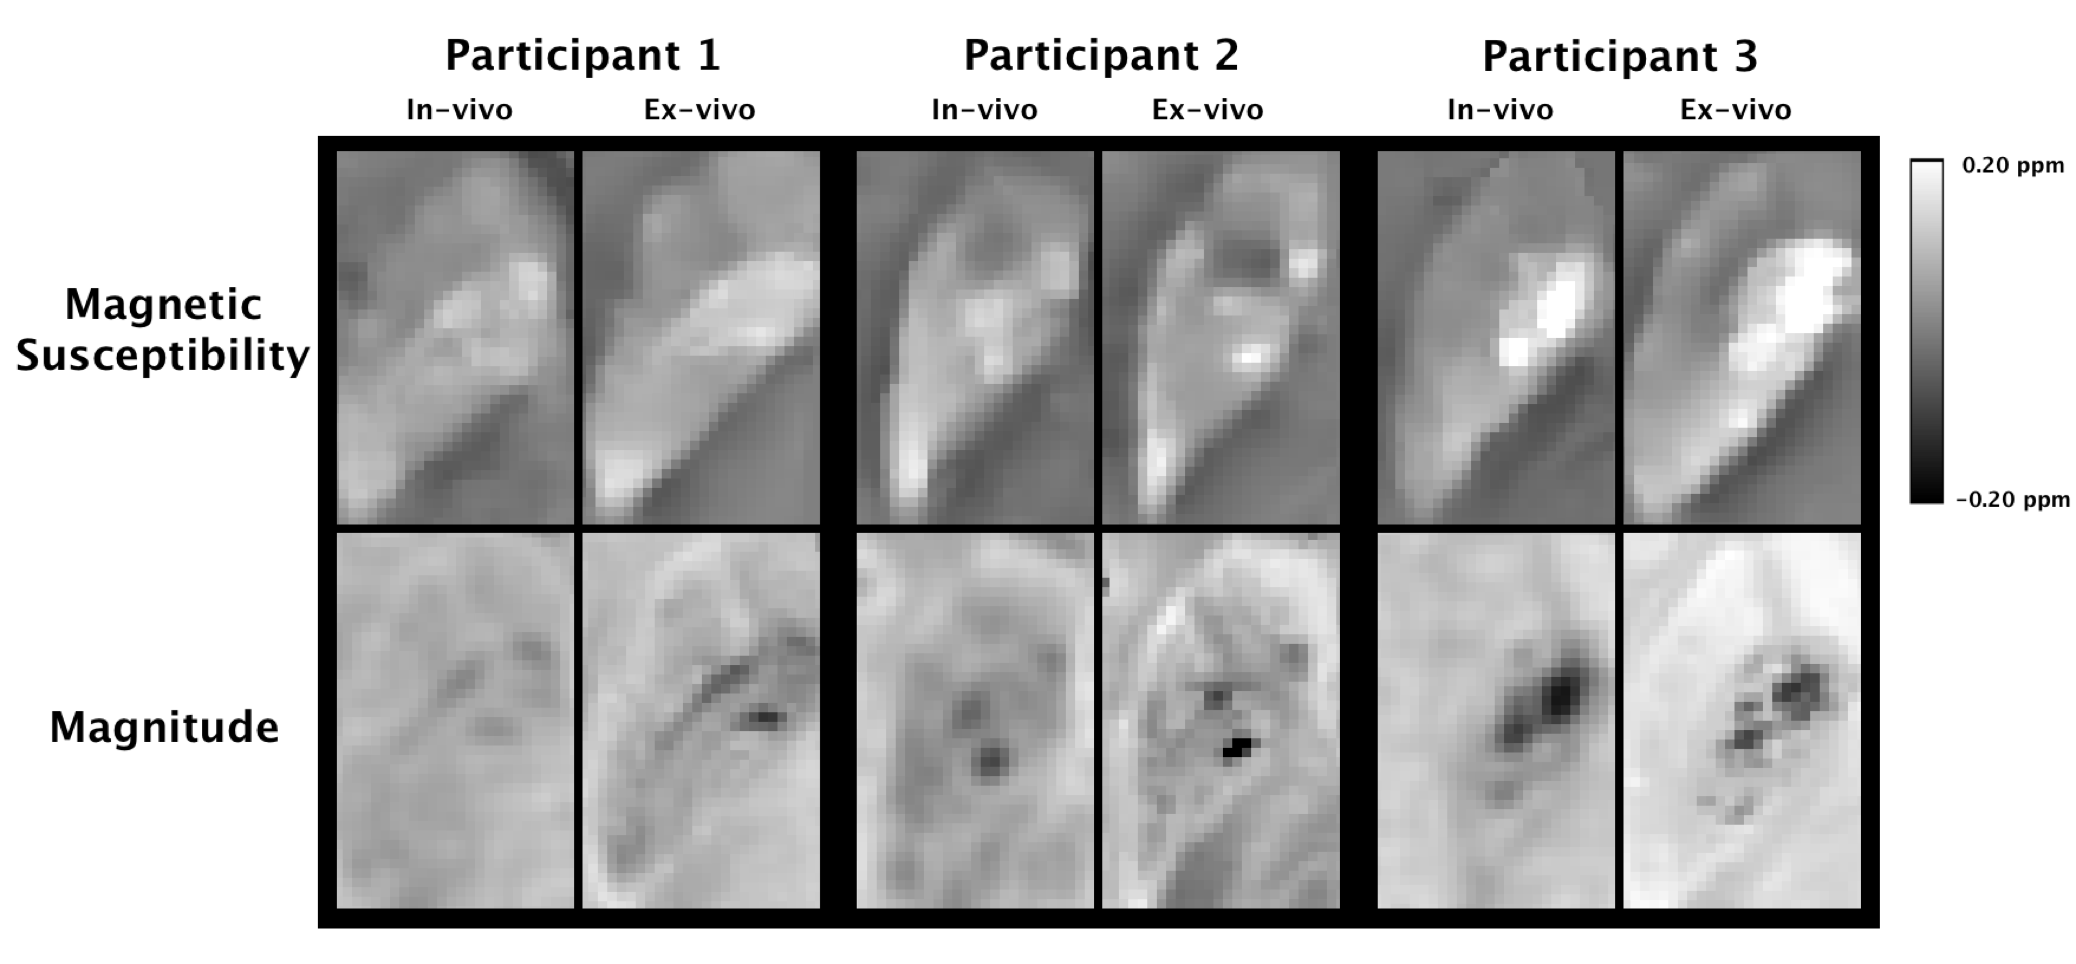
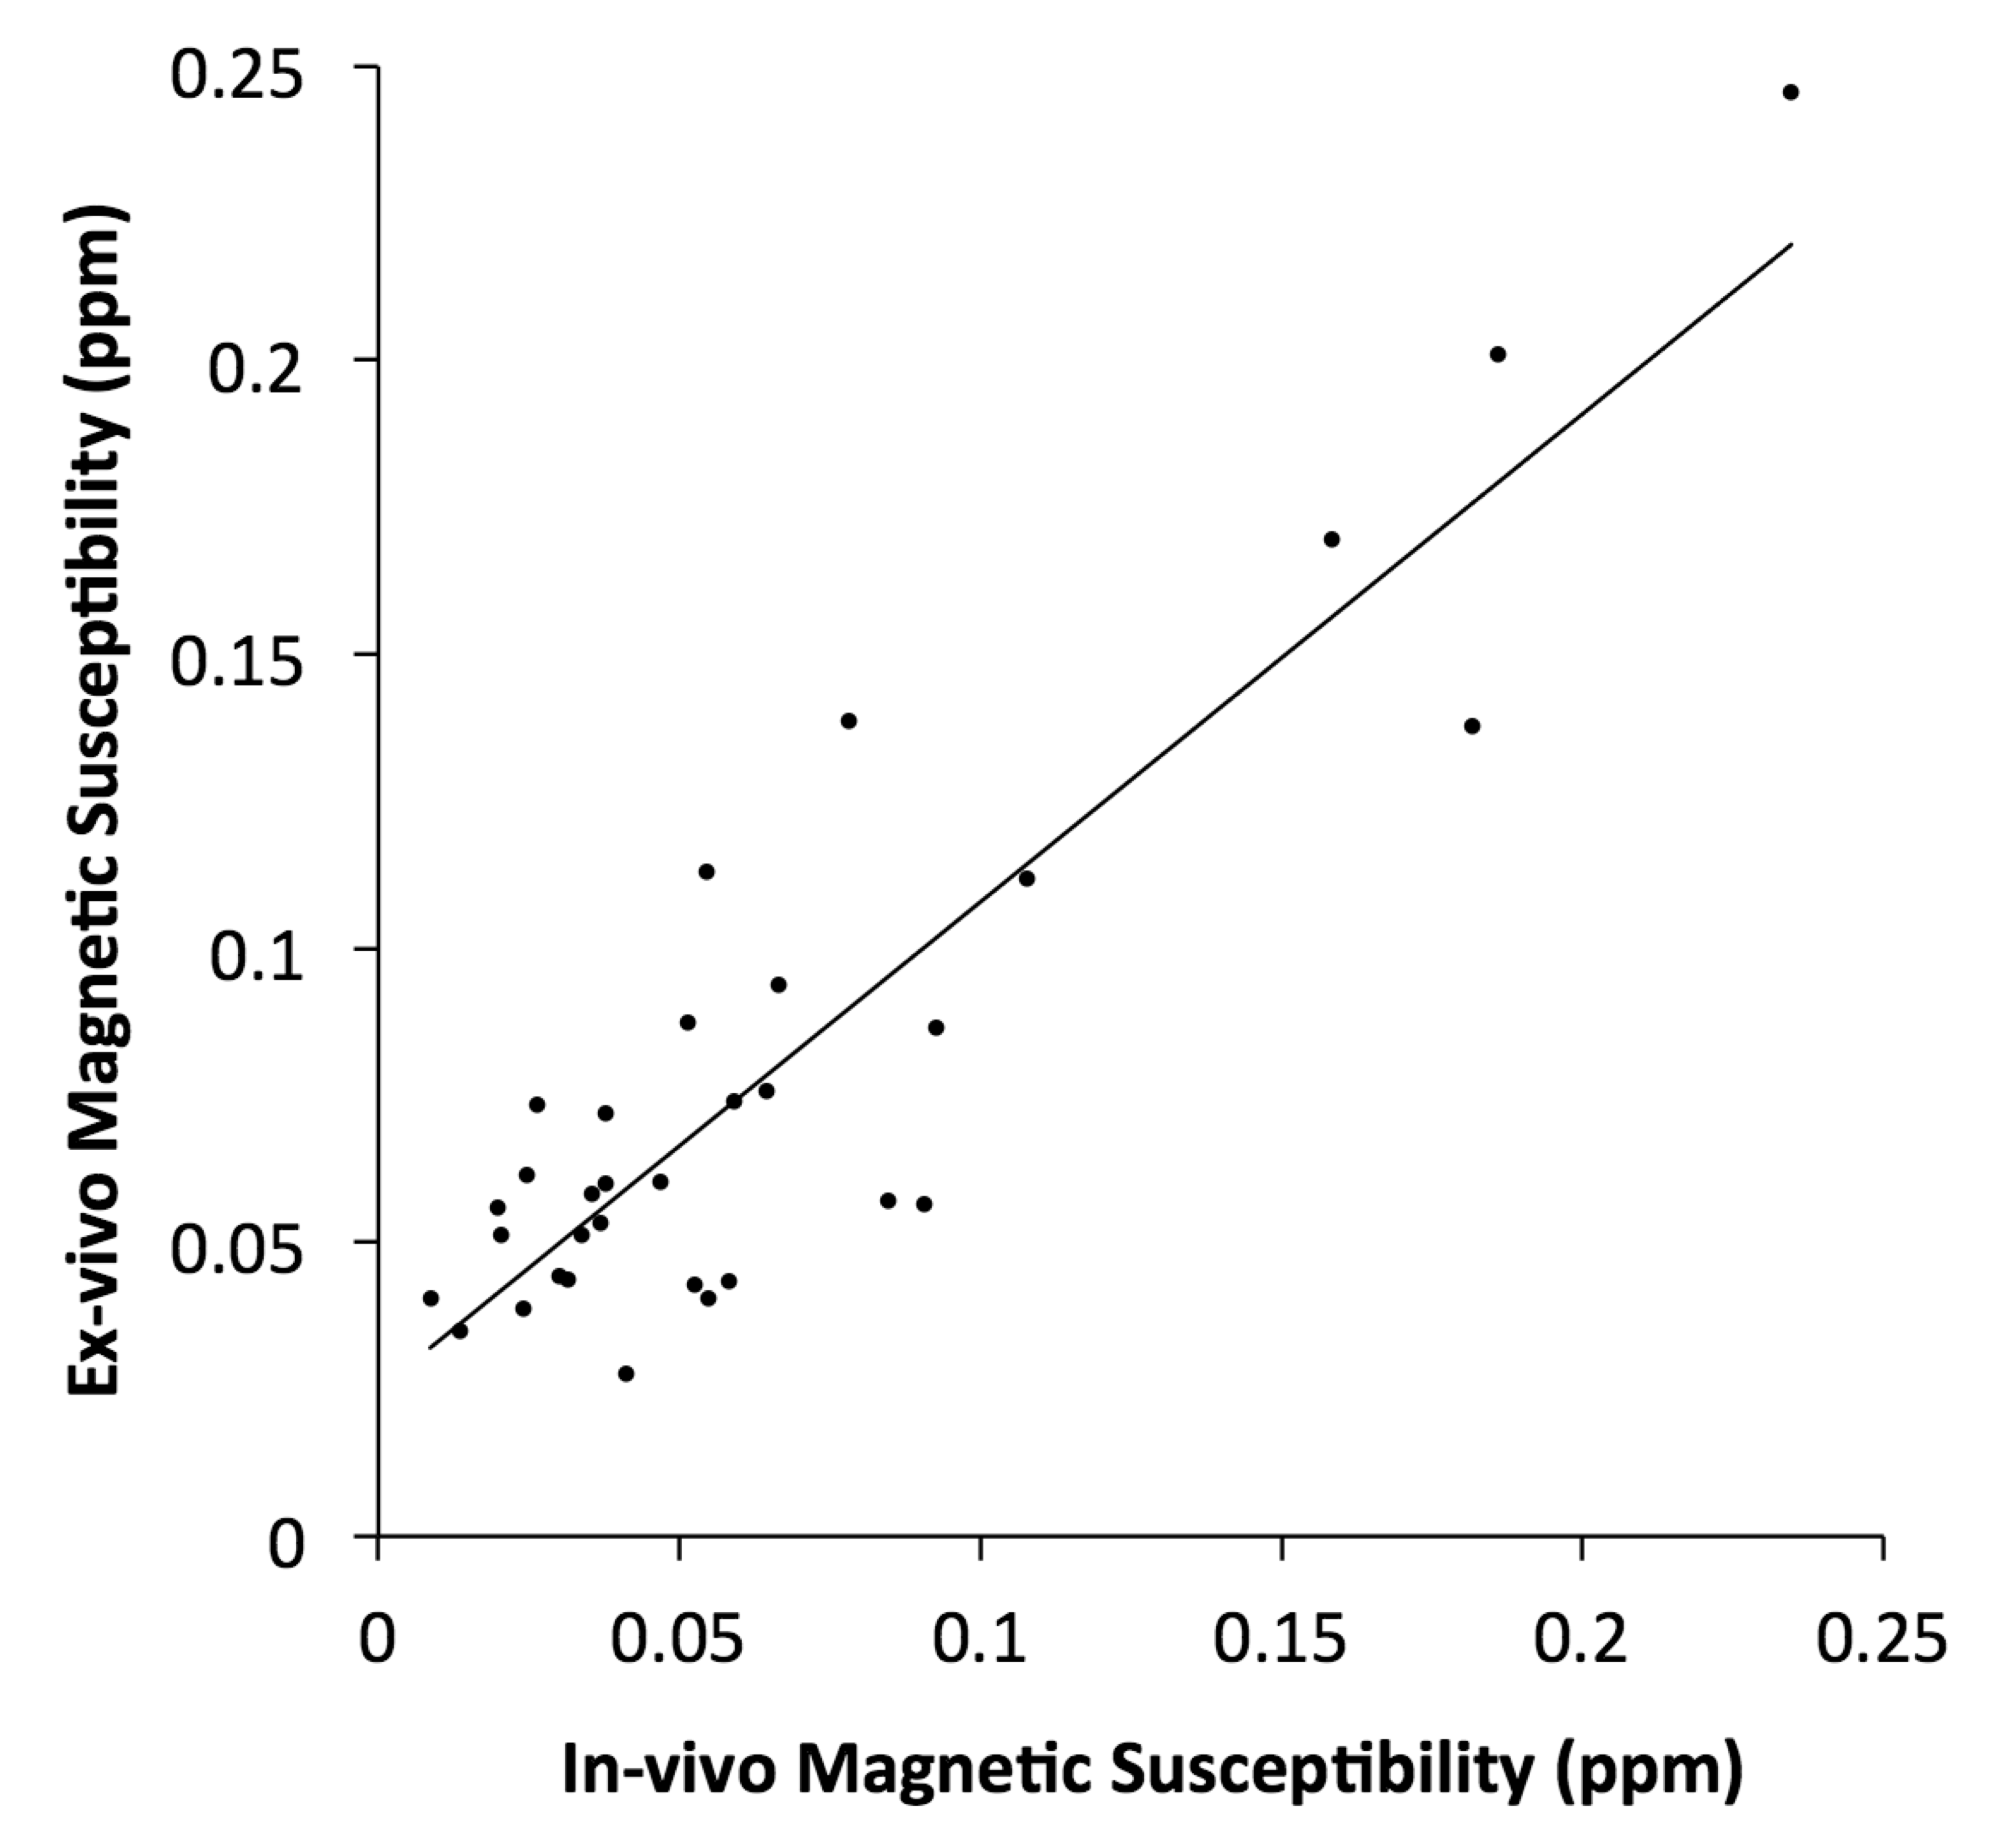
Visual inspection showed good agreement between in-vivo and ex-vivo susceptibility maps from the same hemispheres (Fig.4). The ratio of the residual variance in the regression of regional ex-vivo susceptibility values on the corresponding in-vivo measurements from the same participants, over the total variance of ex-vivo susceptibility was relatively small at 0.11±0.05 (CI=[0.04,0.23]), suggesting that ex-vivo susceptibility may be well modeled as a linear function of in-vivo susceptibility (Fig.5).
Conclusion
This work demonstrated that magnetic susceptibility measured ex-vivo does not vary substantially in the first six weeks after death. This finding suggests that future cross-sectional ex-vivo QSM studies may not be contaminated by differences in postmortem interval to imaging across individuals (if imaged <6 weeks postmortem). Additionally, it was shown that ex-vivo susceptibility may be well modeled as a linear function of in-vivo susceptibility. This result suggests that ex-vivo QSM captures information linked to antemortem magnetic susceptibility of the human brain. Since ex-vivo MRI has important advantages over in-vivo MRI when studying links to neuropathology (e.g. assesses the brain in the same condition as histopathologic examination, and allows imaging of older adults independent of frailty level), the findings of the present work indicate that ex-vivo QSM can become an important tool for the assessment of the neuropathologic correlates of magnetic susceptibility in aging.Acknowledgements
No acknowledgement found.References
1. Bennett DA, Schneider JA, Buchman AS, Barnes LL, Boyle PA, Wilson RS. Overview and findings from the Rush Memory and Aging Project. Curr Alzheimer Res 2012;9:646–663.
2. Bennett DA, Wilson RS, Arvanitakis Z, Boyle PA, de Toledo-Morrell L, Schneider JA. Selected findings from the Religious Orders Study and Rush Memory and Aging Project. J Alzheimers Dis 2013;33 Suppl 1:S397-403.
3. Schneider JA, Arvanitakis Z, Bang W, Bennett DA. Mixed brain pathologies account for most dementia cases in community-dwelling older persons. Neurology 2007;69:2197-2204.
4. Bennett DA, Schneider JA, Wilson RS, Bienias JL, Arnold SE. Education modifies the association of amyloid but not tangles with cognitive function. Neurology 2005;65(6):953-5.
5. Jenkinson M. Fast, automated, N-dimensional phase-unwrapping algorithm. Magn Reson Med 2003;49:193-197.
6. Sun H, Wilman AH. Background field removal using spherical mean value filtering and Tikhonov regularization. Magn Reson Med 2014;71:1151-1157.
7. Liu J, Liu T, de Rochefort L, et al. Morphology enabled dipole inversion for quantitative susceptibility mapping using structural consistency between the magnitude image and the susceptibility map. Neuroimage 2012;59:2560-2568.
8. Wen Y, Wang Y, Liu T. Enhancing k-space quantitative susceptibility mapping by enforcing consistency on the cone data (CCD) with structural priors. Magn Reson Med 2016;75:823-830.
9. Jenkinson M, Smith SM. A global optimisation method for robust affine registration of brain images. Med Image Anal 2001;5:143-156.
10. Ou Y, Sotiras A, Paragios N, Davatzikos C. DRAMMS: Deformable registration via attribute matching and mutual-saliency weighting. Med Image Anal 2011;15:622-639.
11. Bilgic B, Pfefferbaum A, Rohlfing T, Sullivan EV, Adalsteinsson E. MRI estimates of brain iron concentration in normal aging using quantitative susceptibility mapping. Neuroimage 2012;59:2625-2635.
12. Gellein K, Flaten TP, Erikson KM, Aschner M, Syversen T. Leaching of trace elements from biological tissue by formalin fixation. Biol Trace Elem Res 2008;121:221-225.
13. Bush VJ, Moyer TP, Batts KP, Parisi JE. Essential and toxic element concentrations in fresh and formalin-fixed human autopsy tissues. Clin Chem 1995;41:284-294.
14. Langkammer C, Schweser F, Krebs N, Deistung A, Goessler W, Scheurer E, Sommer K, Reishofer G, Yen K, Fazekas F, Ropele S, Reichenbach JR. Quantitative susceptibility mapping (QSM) as a means to measure brain iron? A post mortem validation study. Neuroimage 2012;62:1593-1599.
Figures