4554
T1 mapping from variable flip angle SPGR and IR-SPGR data using DESPOT1-HIFI1Amirkabir University of Technology, Tehran, Iran, 2Robarts Research Institute, London, Canada
Synopsis
This work aims at improving the calculation of T1 maps at high magnetic fields from a set of VFA SPGR and IR-SPGR images for direct correction of B1 inhomogeneities using DESPOT1-HIFI. In the present work we (i) call attention to an erroneous assumption regarding the IR-SPGR signal intensity equation in the original DESPOT1-HIFI method and derive an alternative equation, and (ii) propose a reduced-dimensions least-squares fitting method, which turns the complex multi-parameter fitting into a simple one-dimensional search.
PURPOSE
To improve the calculation of T1 maps at high magnetic fields from a set of VFA SPGR and IR-SPGR images for direct correction of B1 inhomogeneities using DESPOT1-HIFI 1. In the present work we (i) call attention to an erroneous assumption regarding the IR-SPGR signal intensity equation in the original DESPOT1-HIFI method and derive an alternative equation, and (ii) propose a reduced-dimensions least-squares fitting method, which turns the complex multi-parameter fitting into a simple one-dimensional search.THEORY
The IR-SPGR acquisition involves the application of a 180° pulse followed by a delay of and a train of low-angle SPGR pulses. While the MPRAGE 2 model is too complex to be used for multi-parametric nonlinear least-squares fitting, a simpler equation can be derived with the assumptions of reference 1:
The longitudinal magnetization $$$M_z(Tr^{-})$$$ at the end of each cycle immediately prior to the next inversion pulse is related to the longitudinal magnetization $$$M_z(0^{+})$$$ at the beginning of the cycle immediately after the inversion pulse:
$$M_z(Tr^{-})=M_z(0^{+})e^{-Tr/T1}+M_0(1-e^{-Tr/T1})$$ (1)
where $$$M_0$$$ is the equilibrium magnetization and $$$Tr$$$ is the time between successive inversion pulses.
Assuming an adiabatic inversion:
$$M_z(0^{+})=-M_z(0^{-})$$ (2)
Additionally, at steady state:
$$M_z(0^{-})=M_z(Tr^{-}) $$ (3)
Combining equations (1), (2), and (3):
$$M_z(0^{+})=-\frac{1-e^{-Tr/T1}}{1+e^{-Tr/T1}}M_0$$ (4)
based on which, the longitudinal magnetization at time $$$TI$$$ at each inversion cycle is derived:
$$M_z(TI^{-})=-M_0\frac{1-e^{-Tr/T1}}{1+e^{-Tr/T1}}e^{-TI/T1}+M_0(1-e^{-TI/T1})$$ (5)
With some algebraic simplifications an approximate IR-SPGR equation is derived:
$$S_{IR-SPGR}^{(approx)}=\rho(1-\frac{2e^{-TI/T1}}{1+e^{-Tr/T1}})\sin(\kappa\alpha_p)$$ (6)
where $$$\rho$$$ is a factor proportional to $$$M_0$$$ and includes the $$$T_2^*$$$ and receive effects. $$$\alpha_p$$$ is the prescribed flip angle, and models spatial variations of the transmitted flip angle from the prescribed.
DESPOT1-HIFI derives a unique solution for $$$\kappa$$$, $$$T_1$$$, and $$$\rho$$$ by least squares minimization of the combined SPGR and IR-SPGR data to the corresponding signal equations:
$$f(\rho,T_1,\kappa)=\sum_{i=1}^{N_{IR-SPGR}}[\rho(1-\frac{2e^{-TI/T1}}{1+e^{-Tr/T1}})\sin(\kappa\alpha_{p,i})-S_{IR-SPGR,i}]^2+\sum_{j=1}^{N_{SPGR}}[\frac{\rho(1-e^{-TR/T_1})\sin(\kappa\alpha_{p,j})}{1-e^{-TR/T_1}\cos(\kappa\alpha_{p,j})}-S_{SPGR,j}]^2$$ (7)
where $$$TR$$$ is the SPGR repetition time.
Unfortunately, however, the IR-SPGR equation used in the original DESPOT1-HIFI method is that of a general IR-SE sequence, which is not applicable to IR-SPGR acquisitions, resulting in significant errors in the calculated T1 maps.
METHODS
Reference T1 data were acquired using a 2D IR-FSE sequence on a 3T GE scanner with TE/TR=11.24ms/5000ms, TI={100,400,800,1500,3000}ms. 3D SPGR/IR-SPGR data were acquired using the same scanner with TE/TR=3.71ms/8.36ms. $$$TI_{IR-SPGR}$$$=450ms, $$$\alpha_{IR-SPGR}$$$=5˚, $$$\alpha_{SPGR}$$$=4˚ and 18˚.
A custom-made agarose gel phantom comprising 9 nickel chloride doped agarose tubes and two healthy volunteers were imaged. Informed consent was obtained from the subjects. Reference T1 maps were calculated by a 3-parameter fit to the IR-FSE data. DESPOT1-HIFI T1 values were calculated by the least-squares fitting described in (7). As the range of possible $$$\kappa$$$ values is known, a global grid-search on $$$\kappa$$$ can be used, ensuring a global minimum is found. Since for each value of $$$\kappa$$$, $$$T_1$$$ and $$$\rho$$$ can be efficiently estimated using the conventional linear DESPOT1 3, the three-parameter NLS fitting is reduced to a search over one dimension, providing a fast and efficient solution. The reduced-dimensions grid-search fitting algorithm was compared to the conventional three-parameter fitting. The fitting procedure was repeated using the original IR-SPGR equation used in 1.
RESULTS
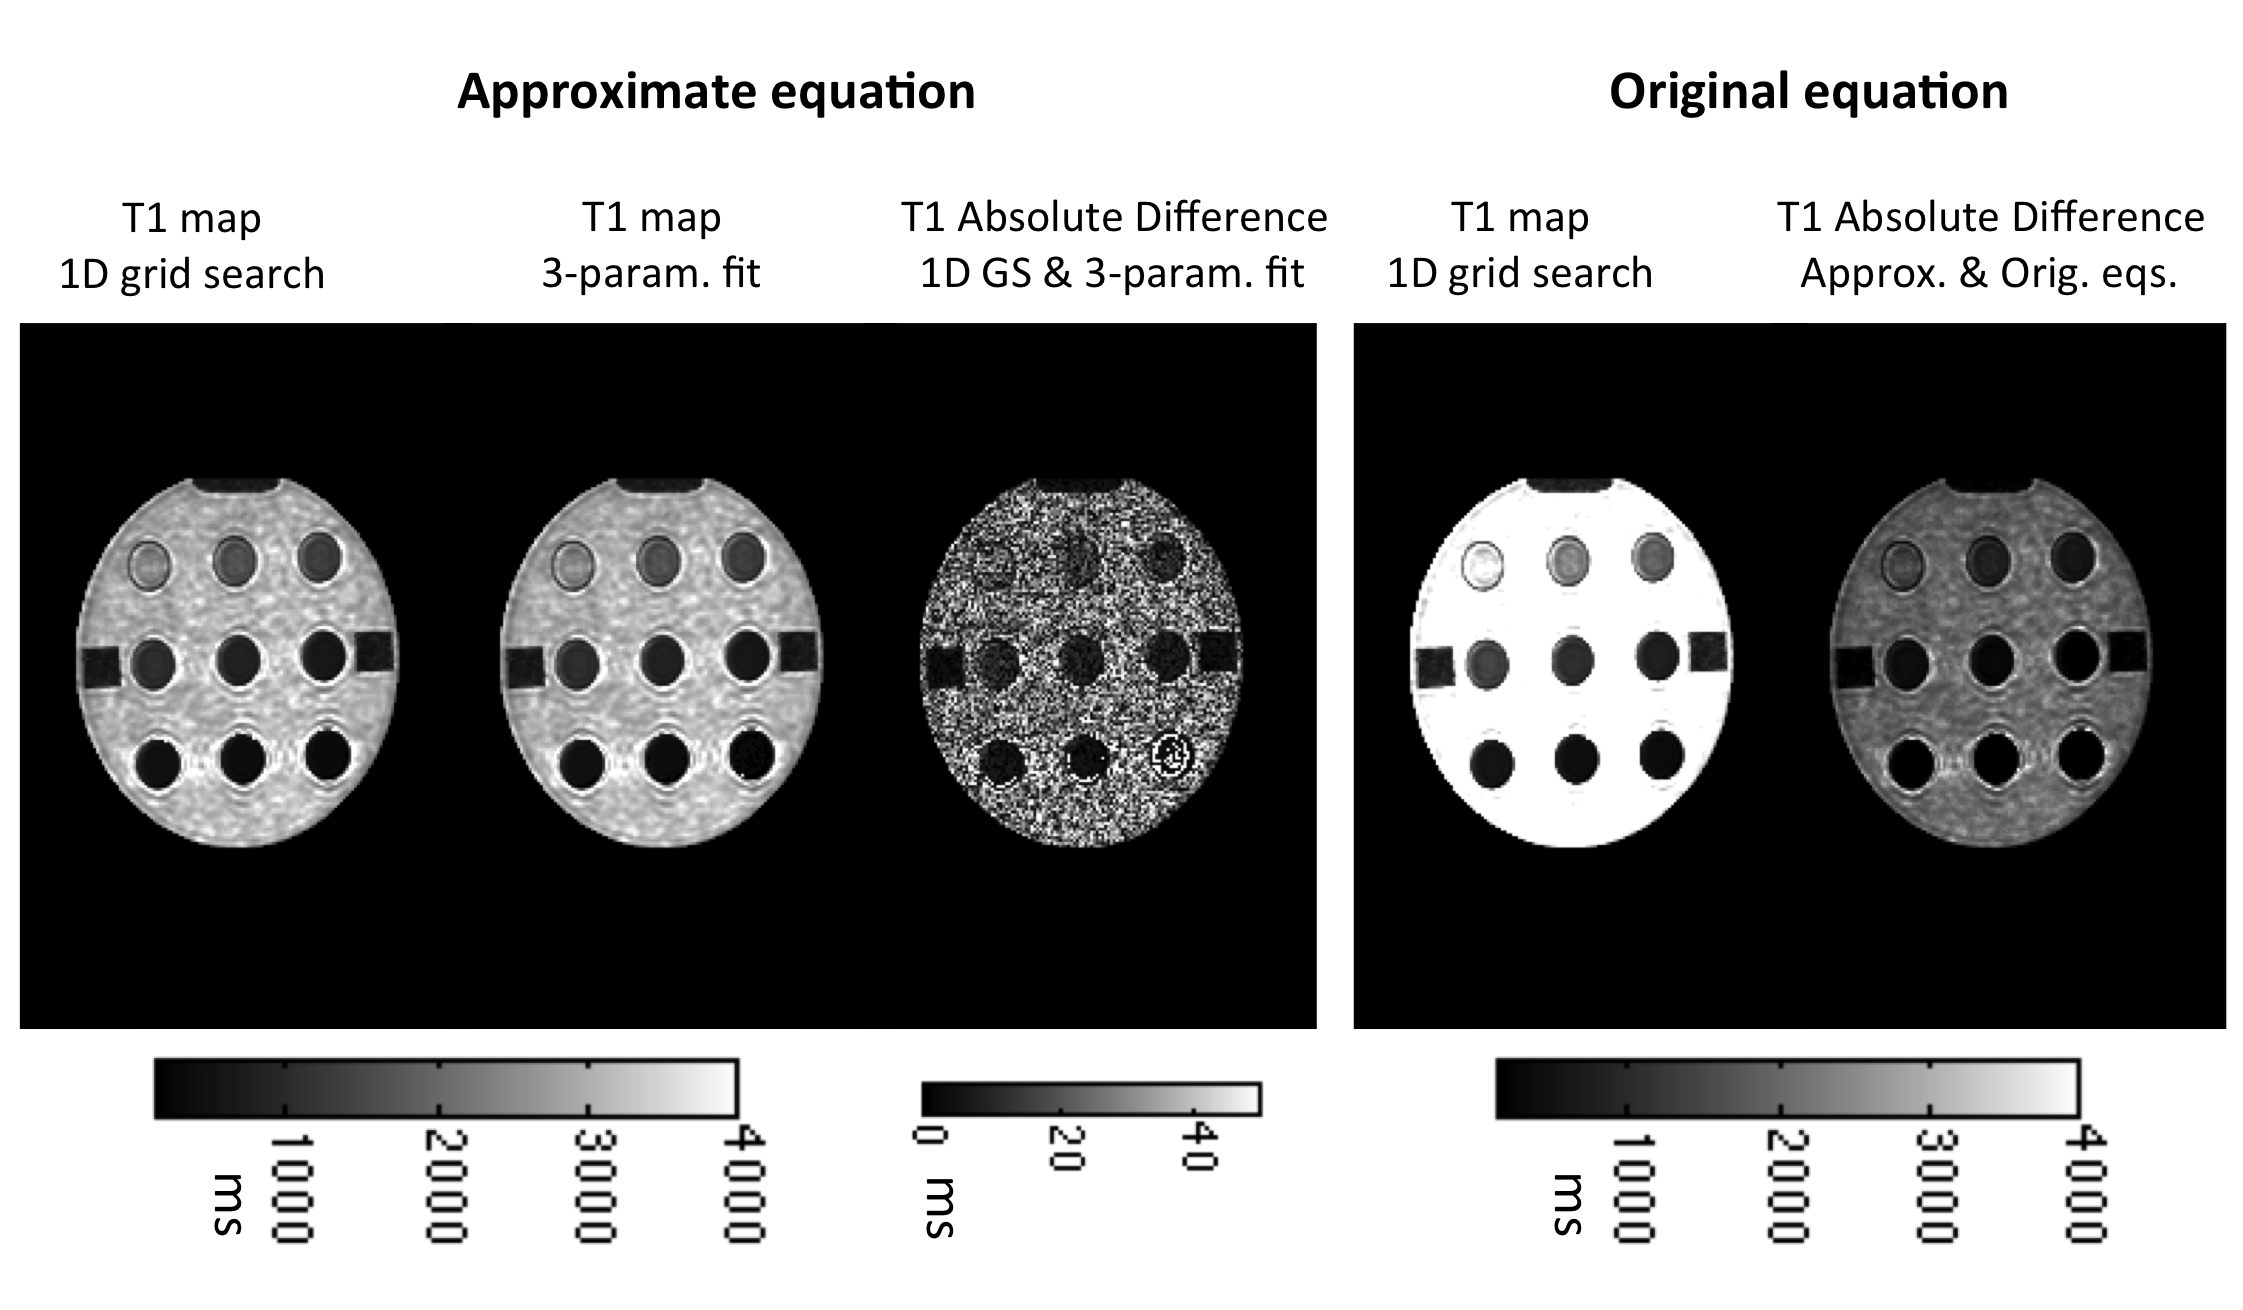
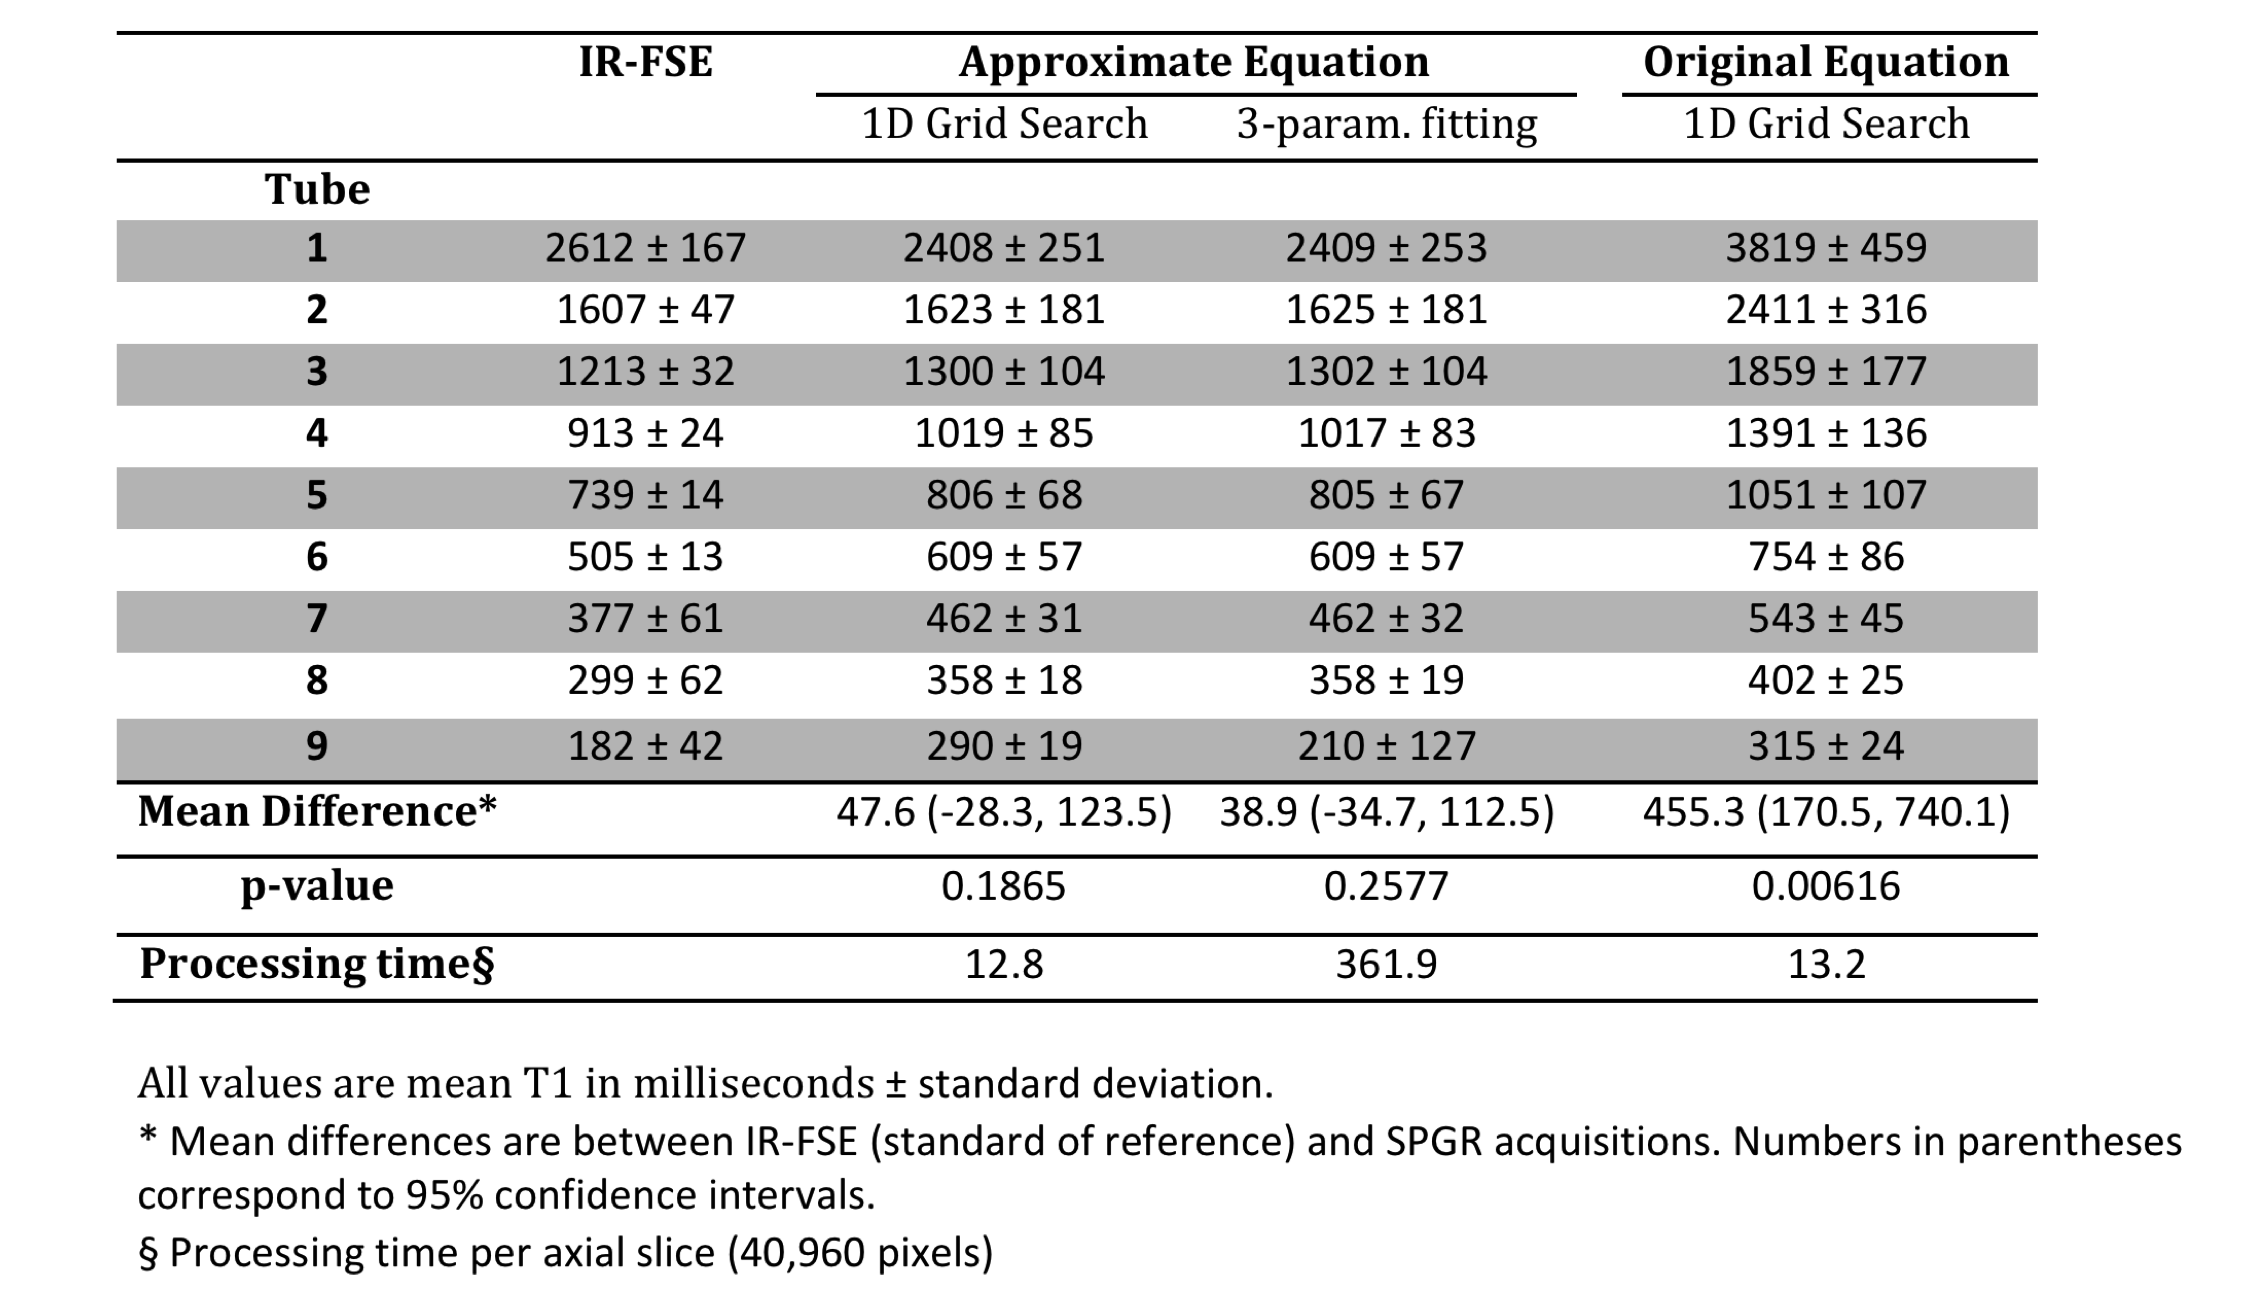
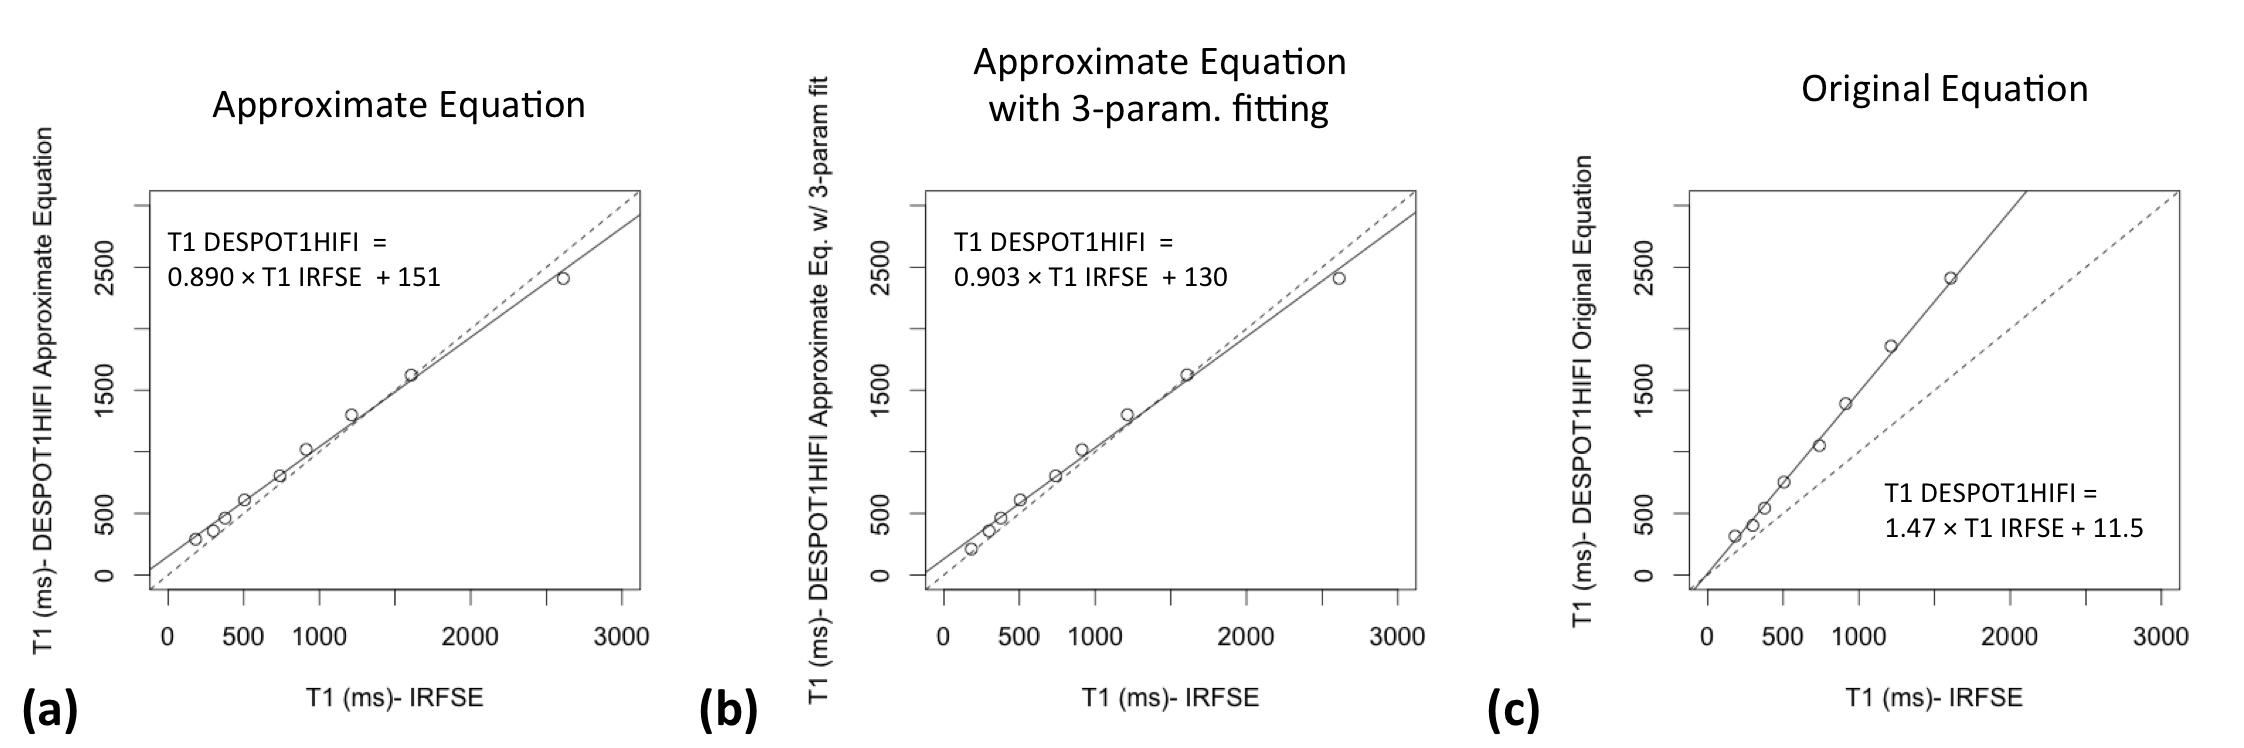
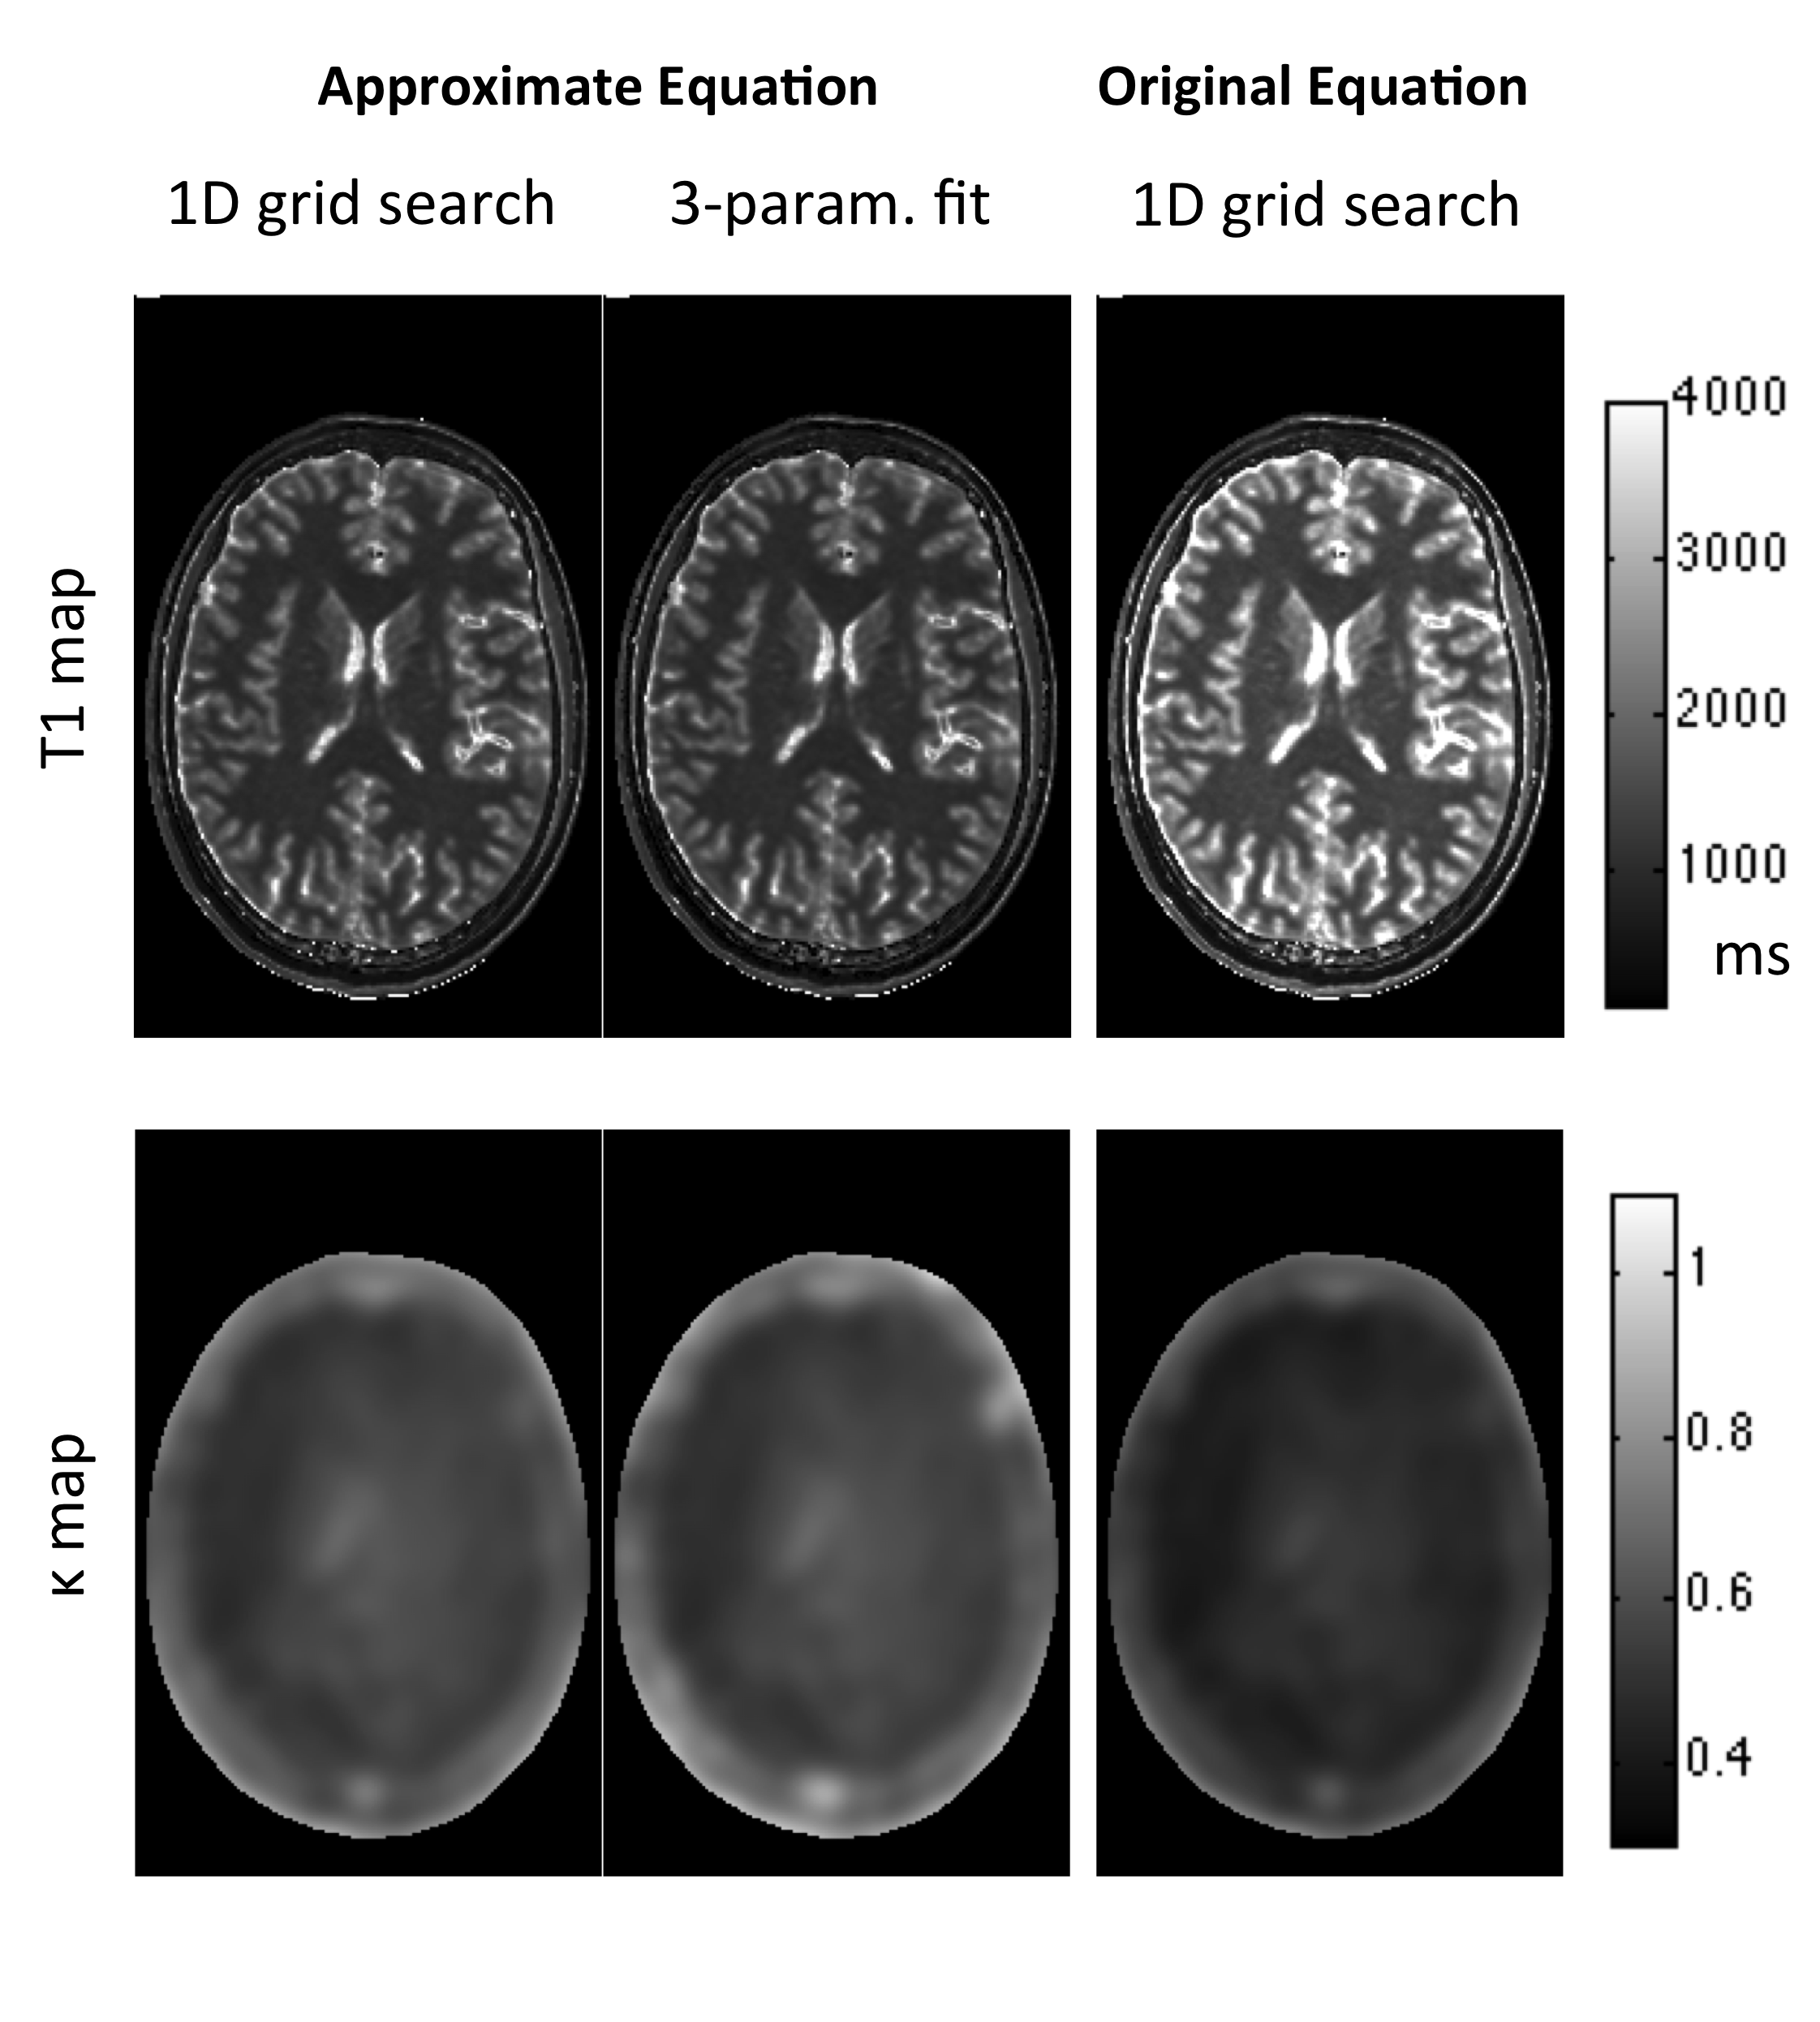
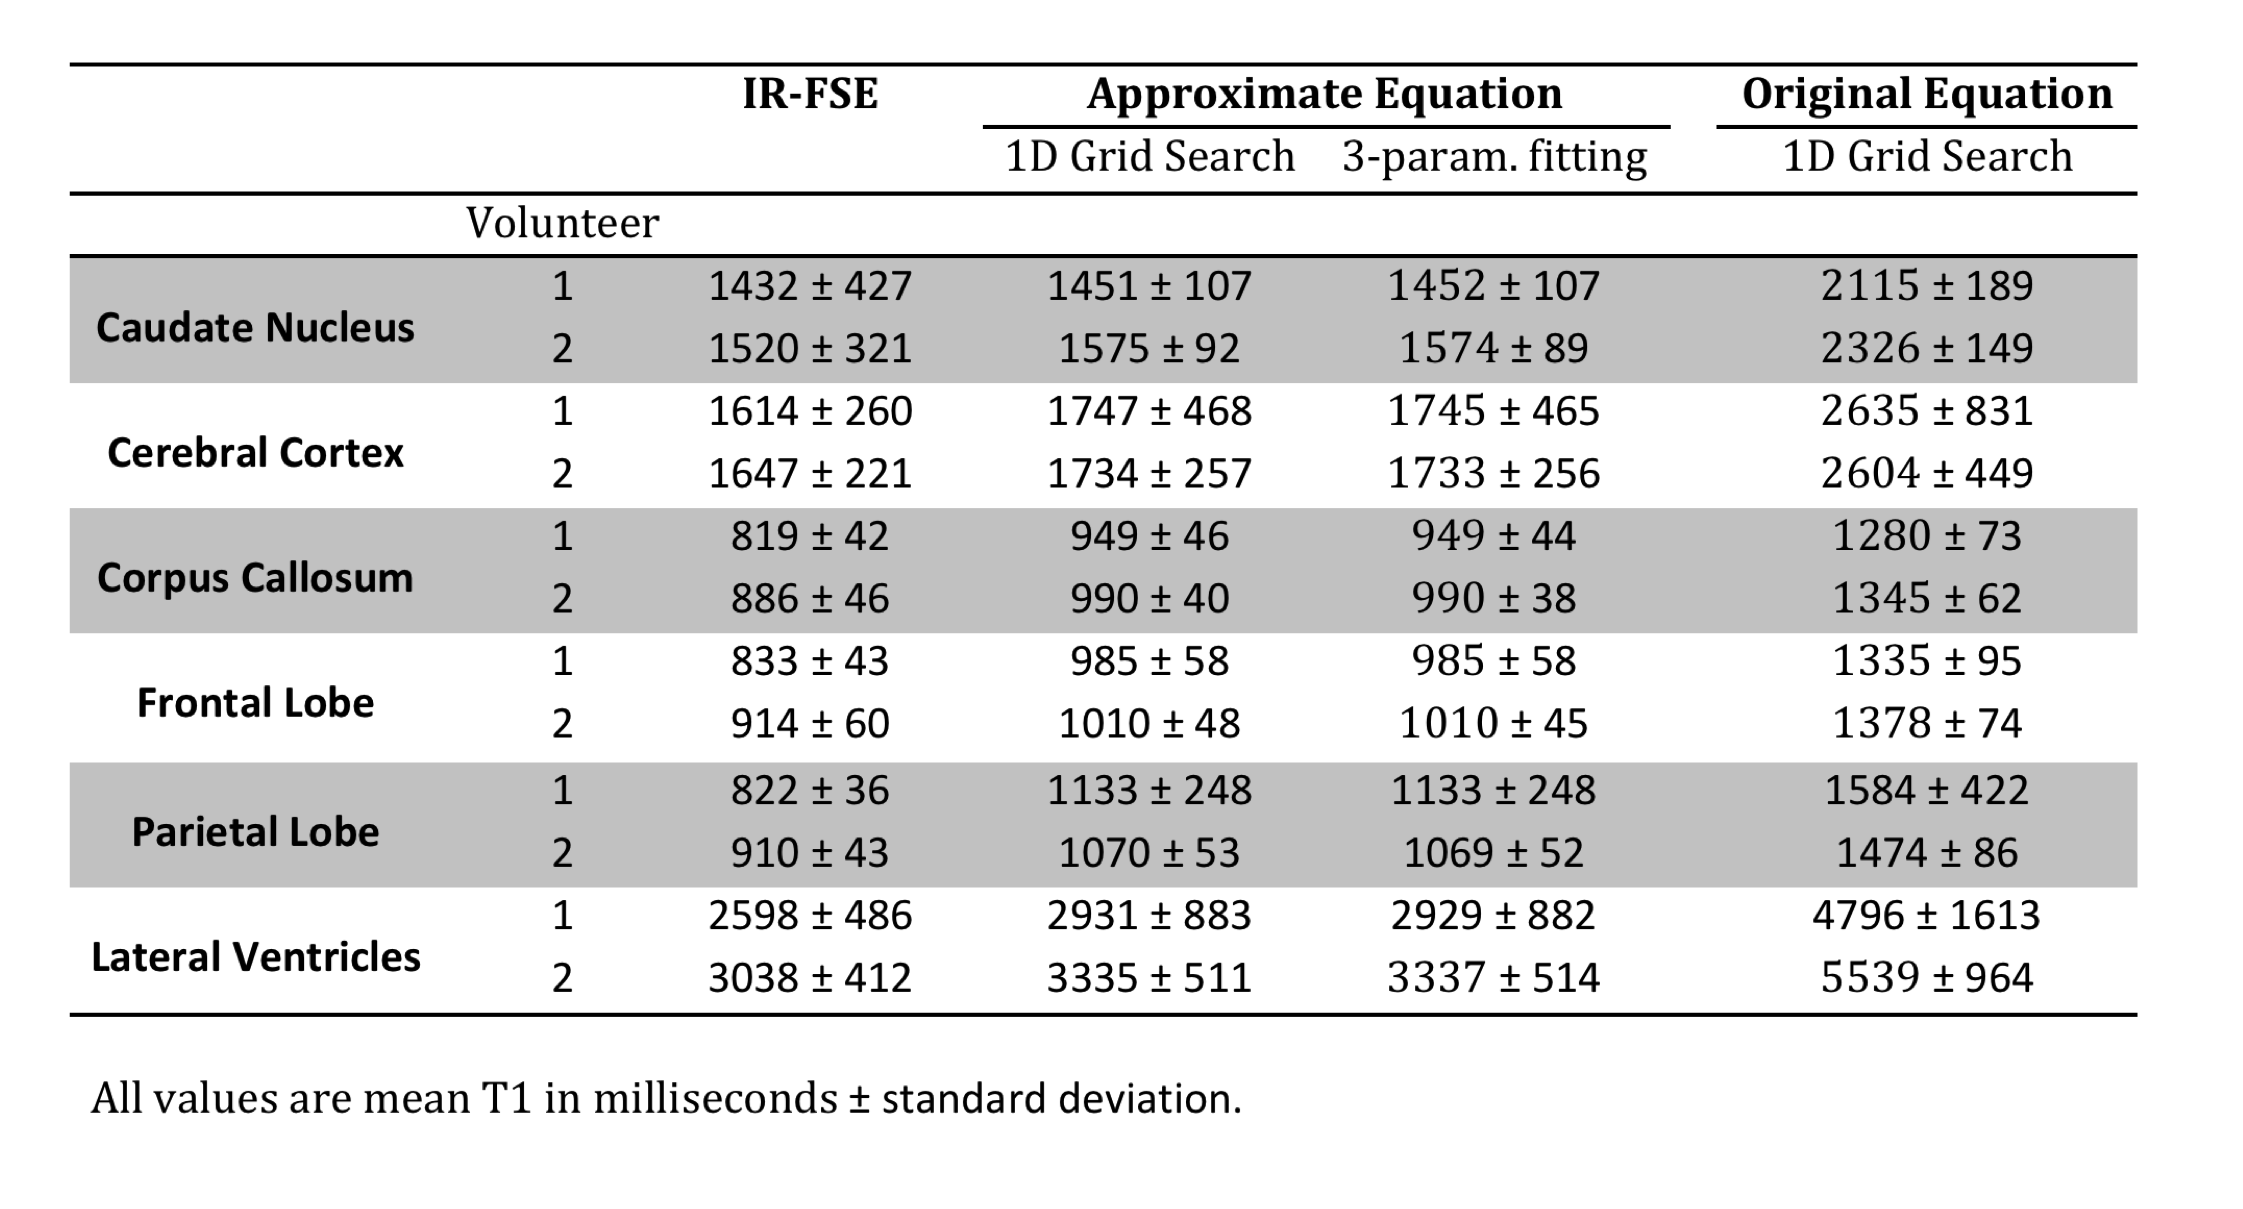
Figures 1-2 and table 1 show phantom data. In vivo measurements are shown in figure 3 and table 2. T1 data computed from the original IR-SPGR equation showed significant differences from the IR-FSE reference (p<0.05), while no significant difference was observed for the approximate equation. No significant difference was observed between grid-search and 3-parameter fitting (p=0.36, 95%CI=(-11.9,29.3)), while the former was 28 times faster. All DESPOT1-HIFI data showed a highly significant linear correlation with reference data (R2>0.99, p<0.05). However, T1 data calculated using the original equation showed a systematic T1 over-estimation.DISCUSSION
Our results clearly confirm the need for a correction to the IR-SPGR equation used in the original DESPOT1-HIFI method. The original equation resulted in less accurate measurements compared to the IR-FSE reference. In particular T1 data from the original equation showed consistent over-estimation of T1 values, which can be explained based on the fact that B1 effects result in fixed percentage error 4. The proposed grid-search algorithm is as accurate as the conventional 3-parameter fitting with significant gain in processing speed. Moreover, this algorithm does not require initialization of the search parameters and ensures a global optimum is found. Further investigation on a larger sample size is foreseen.CONCLUSION
Accurate T1 mapping using DESPOT1-HIFI is possible by replacing the erroneous IR-SPGR equation used in the original DESPOT1-HIFI method with a simple approximate to the MPRAGE equation. The proposed reduced-dimensions grid-search algorithm provides a fast and accurate approach to T1 calculations.Acknowledgements
The author thanks Dr. Trevor Wade for assistance with the phantom studies.References
1. Deoni, S. C. L. High-resolution T1 mapping of the brain at 3T with driven equilibrium single pulse observation of T1 with high-speed incorporation of RF field inhomogeneities (DESPOT1-HIFI). J. Magn. Reson. Imaging JMRI 26, 1106–1111 (2007).
2. Mugler, J. P. & Brookeman, J. R. Three-dimensional magnetization-prepared rapid gradient-echo imaging (3D MP RAGE). Magn. Reson. Med. 15, 152–157 (1990).
3. Deoni, S. C. L., Rutt, B. K. & Peters, T. M. Rapid combined T1 and T2 mapping using gradient recalled acquisition in the steady state. Magn. Reson. Med. 49, 515–526 (2003).
4. Cheng, H.-L. M. & Wright, G. A. Rapid high-resolution T(1) mapping by variable flip angles: accurate and precise measurements in the presence of radiofrequency field inhomogeneity. Magn. Reson. Med. 55, 566–574 (2006).
Figures