4553
N-Acetylcysteine Supplementation Elevates Human Brain Glutathione In Vivo: A Proof-of-Concept Study using J-edited 1H MRS1Radiology, Weill Cornell Medicine, New York, NY, United States, 2Neurology, Mount Sinai Beth Israel Medical Center, New York, NY, United States, 3Neurology and Neuroscience, Weill Cornell Medicine, New York, NY, United States, 4Healthcare Policy and Research, Weill Cornell Medicine, New York, NY, United States
Synopsis
A prior finding of robust cortical glutathione (GSH) deficits in patients with chronic fatigue syndrome (CFS) and major depressive disorder (MDD) provided a compelling rationale for this pilot study that aimed to assess whether 4 weeks of daily supplements of 1800mg of the GSH synthetic precursor N-acetylcysteine (NAC) would normalize brain GSH in CFS patients, as measured in vivo with J-edited MRS. The study’s main finding was that NAC supplementation significantly increased cortical GSH levels in CFS patients compared to controls, while levels of the antioxidant remained statistically unchanged in controls despite a slight numerical increase.
INTRODUCTION
Previously reported robust 36% and 21% deficits of cortical glutathione (GSH) – the primary tissue antioxidant – in patients with chronic fatigue syndrome (CFS) and major depressive disorder (MDD), respectively, compared to healthy controls1, suggested the viability of neuroprotective treatments based on restoring cerebral antioxidant reserves in these disorders. The aim of this study was to assess whether 4 weeks of daily supplements of the GSH synthetic precursor N-acetylcysteine (NAC) which, unlike GSH, crosses the blood-brain barrier, would lead to in situ synthesis, elevation, normalization of brain GSH levels, as measured with J-edited 1H MRS.
METHODS
For this proof-of-concept pilot clinical study, we recruited 17 medication-free patients meeting the CDC criteria for CFS2 and 13 healthy control (HC) subjects. Following baseline cortical GSH measurement with J-edited 1H MRS and clinical assessments, both CFS and HC participants received a 4-week supplement of 1800mg NAC/day. After 4 weeks, identical 1H MRS scan and clinical assessments were conducted to measure the effect of NAC on cortical GSH levels and on CFS symptoms as assessed with the CDC CFS symptom inventory3. Plasma makers of oxidative stress in the form F2a-isoprostanes4 were also measured at baseline and following NAC supplementation in both groups to assess the effect of the intervention on oxidative stress status.
J-edited Brain 1H MRS: In vivo cortical GSH spectra were recorded in 15 min on a 3.0 T GE MR system from a 3.0x3.0x2.0-cm3 occipital cortex (OCC) voxel using J-edited MRS, with TE/TR 68/1500 ms and 290 interleaved excitations (580 total) (Figure 1). Levels of GSH were derived by frequency-domain fitting of the J-edited spectra, and then expressed as peak area ratios relative to the unsuppressed intravoxel water (W) signal.
RESULTS
At baseline (Figure 2[a]), GSH/W in the CFS group ([2.0 ± 0.4]x10-3) was lower (p = 0.04) than in the HV group ([2.3 ± 0.4]x10-3). Following 4 weeks of daily NAC supplementation, GSH levels rose significantly relative to baseline in CFS ([2.3 ± 0.4]x10-3) (p=0.004) (Figure 2[b]) to match those in HV ([2.4 ± 0.4]x10-3) (p = 0.42) (Figure 1[c]), which did not differ compared baseline ([2.3 ± 0.4]x10-3) (p=0.33) (Figure 2[d]). NAC supplementation markedly improved symptoms in CFS patients (Figure 3), with significant decreases in CDC CFS symptom inventory total scores (p<0.0001), “case definition” scores (p<=0.0001) and “other symptoms” scores (p<0.0001). However, GSH levels did not correlate with any the clinical symptoms, although there was a significant decrease in the levels plasma markers of oxidative stress, F2a-isoprostanes, following NAC supplementation in CFS patients that was not seen in HC subjects (Figure 4).
DISCUSSION AND CONCLUSION
The results of this pilot clinical study have provided, for the first time, direct in vivo evidence that dietary NAC crosses the blood-brain barrier to spur in situ synthesis and elevation of cortical GSH levels. Importantly, while 4 weeks of supplementing NAC numerically increased mean GSH in both the CFS patients and HC subjects (Figure 2), only the increase in the patient group reached statistical significance. This finding is notable because it represents the first in vivo human brain documentation of the long-postulated “feedback inhibition” of GSH synthesis5 (Figure 5), whereby GSH regulates its own synthesis, activating or inhibiting the rate-limiting enzyme, g-glutamylcysteine ligase (GCL), in the synthesis pathway (Figure 5) to start or stop synthesis when GSH levels are low or adequate, respectively. Thus, NAC spurred GSH increase in CFS, but not in HC, due to the deficit present in patients at baseline. Lastly, while increasing cortical GSH levels with NAC ameliorated symptoms in CFS patients, this treatment response quite likely represented a strong placebo effect due to the lack of an appropriate placebo control group. This possibility, along with the relatively small sample size of this study likely account for the lack of a correlation between cortical GSH and clinical symptoms. However, we found that NAC supplementation, likely in conjunction with the associated elevation of in situ cortical GSH, ameliorated oxidative stress status in CFS patients, but not in control subjects (Figure 4). Future studies evaluating the clinical efficacy, optimal dose and treatment duration of NAC in disorders implicating oxidative stress or redox imbalance are warranted.
Acknowledgements
No acknowledgement found.References
Shungu DC, Weiduschat N, Murrough JW, Mao X, Pillemer S, Dyke JP, Medow MS, Natelson BH, Stewart JM, Mathew SJ. Increased ventricular lactate in chronic fatigue syndrome. III. Relationships to cortical glutathione and clinical symptoms implicate oxidative stress in disorder pathophysiology. NMR in Biomedicine. 2012 Sep 1;25(9):1073-87.
Fukuda K, Straus SE, Hickie I, Sharpe MC, Dobbins JG, Komaroff A. The chronic fatigue syndrome: a comprehensive approach to its definition and study. Annals of internal medicine. 1994 Dec 15;121(12):953-9.
Wagner D, Nisenbaum R, Heim C, Jones JF, Unger ER, Reeves WC. Psychometric properties of the CDC Symptom Inventory for assessment of chronic fatigue syndrome. Population Health Metrics. 2005 Jul 22;3(1):1.
Basu S. F2-isoprostanes in human health and diseases: from molecular mechanisms to clinical implications. Antioxidants & redox signaling. 2008 Aug 1;10(8):1405-34.
Richman PG, Meister A. Regulation of gamma-glutamyl-cysteine synthetase by nonallosteric feedback inhibition by glutathione. Journal of Biological Chemistry. 1975 Feb 25;250(4):1422-6.
Figures
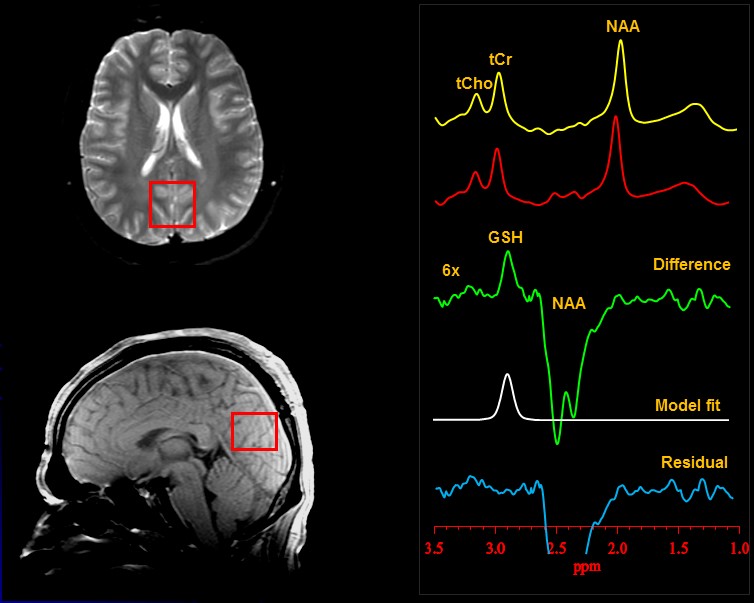
Figure 1: Illustration of brain occipital cortex GSH detection by J-edited difference 1H MRS, followed by frequency-domain fitting of the difference spectrum to obtain GSH peak areas that yield GSH levels.
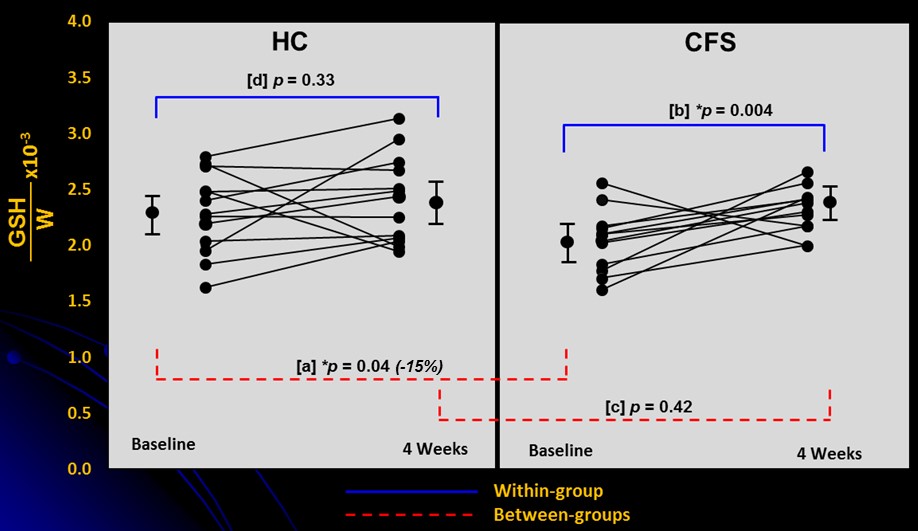
Figure 2: Changes in cortical GSH levels following 4 weeks of supplementation with NAC in healthy controls (HC) subjects and in patients with CFS. Baseline to 4-week changes are shown both within (blue lines) and between (red lines) HC and CFS subjects.
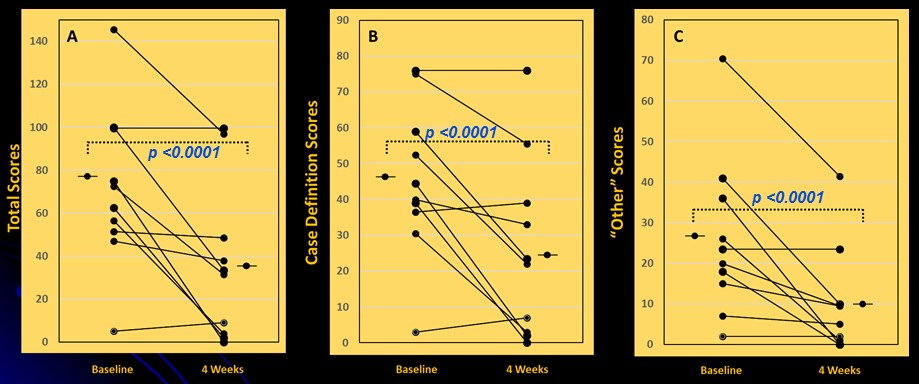
Figure 3: Changes in CFS symptoms, as assessed with the CDC CFS Symptom Inventory scores, in CFS patients following 4 weeks of dietary NAC supplementation. [A] Total scores, [B] “case definition” scores, and [C] “other symptoms” scores. In all cases, NAC supplementation improved (lowered) symptoms.
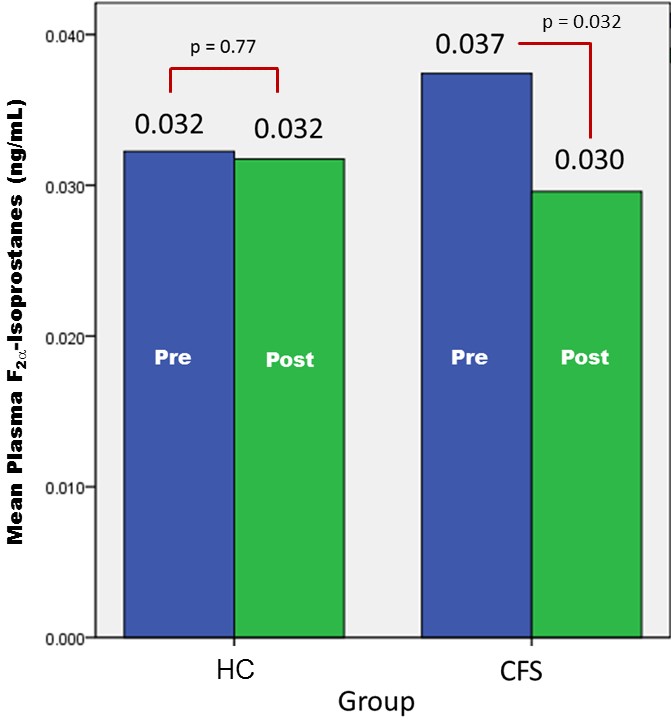
Figure 4: Plasma levels of the highly reliable marker of oxidative stress, F2a-isoprostanes, in healthy controls (HC) and CFS patients before (Pre) and following (Post) 4 weeks of NAC supplementation. There was a significant improvement of oxidative stress status in CFS, but not in HC. It should be noted, however, that likely due to the limited sample size, the apparent differences in isoprostanes levels between CFS and HC were not significant, either at pre- or post-NAC.
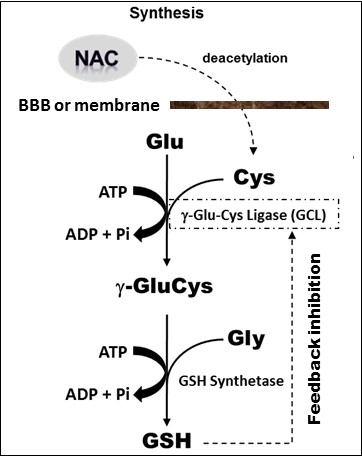
Figure 5: Enzyme-catalyzed in situ synthesis of GSH from deacetylation of supplemented NAC precursor to cysteine (Cys). The reaction of Cys with glutamate (Glu) catalyzed by g-glutamycysteinyl ligase (GCL) is rate limiting, followed by GSH synthetase-catalyzed addition of glycine (Gly) to form g-GluCysGly, commonly known as glutathione or GSH. Note that GSH regulates its own synthesis through feedback inhibition of GCL (i.e., no additional GSH is synthesized when its tissue concentration is normal or adequate).