4551
Brain parenchyma pulsatility assessed with ferumoxytol enhanced T2* MRI.1Dept. of Medical Physics, University of Wisconsin-Madison, MADISON, WI, United States, 2Dept. of Radiology, University of Wisconsin-Madison, Madison, WI, United States
Synopsis
Pulsatility differences in large intracranial arteries and veins have been observed in patients with dementia using 4D flow MRI. How microvascular pulsatility is affected, however, is unclear. Non-invasive methods to monitor capillary pulsatility are still lacking. In this work, we present a method to assess brain parenchyma microvascular pulsatility using T2* signal changes over the cardiac cycle using ferumoxytol enhanced MRI. Significant differences in PI of the cortical gray matter were found when compared to white matter PI values. This method to assess microvascular blood volume pulsatility over the cardiac cycle might serve as a marker to study capillary pulsatility.
Purpose:
Changes to cerebrovasculature function are observed across an array of diseases including dementia, hypertensive arteriopathy, and cerebral atherosclerosis. Recently, pulsatility differences in large intracranial arteries and veins have been observed in patients with dementia using 4D flow MRI.1,2 How microvascular pulsatility is affected, however, is unclear.3 Capillary pulsatility has been measured using multi photon microscopy in rat models.4 However, non-invasive methods to monitor capillary pulsatility are still lacking. A potential approach to investigate capillary pulsatility consist of measuring the change of blood volume (CBV) over the cardiac cycle using a blood-pool MRI contrast agent. Pulsations in CBV volume are expected to be 1-13% and is thus would be challenging to differentiate from thermal and physiologic noise with conventional DCE techniques with a gadolinium-based contrast agent. Ferumoxytol is an ultrasmall superparamagnetic iron oxide (USPIO) particle that exhibits strong T2* shortening effects and has an exceptionally long intravascular half-life.5 These characteristics enable steady state CBV imaging with the potential for significantly higher SNR. The purpose of this work is to assess the feasibility of ferumoxytol enhanced T2* MRI as a means to capture capillary pulsatility.Methods:
Subjects: The study population consisted of 10 healthy subjects (age range 20-51y, mean=30y, 7F). MR images were acquired using 2D EPI and 3D spiral trajectories sequences on a 3.0T scanner (MR750, GE Healthcare Waukesha, WI, USA) with a 32ch brain coil (Nova Medical, Wilmington, MA, USA). For all patients, scanning was performed before and after the administration of two doses of ferumoxytol (AMAG Pharmaceuticals, Inc., Cambridge, MA). Ferumoxytol was diluted to 60 ml and injected as a slow infusion during 5 minutes. 2D EPI images were acquired at 3 time points: pre-contrast, after a first injection (1mg/kg) and a second injection (4mg/kg), for a total ferumoxytol dose of 5mg/kg. The following imaging parameters were used: TR/TE = 56/35 ms, flip angle = 8 degrees, slice thickness = 3mm, echo train length =1, scan time = 30s. 3D spiral images were acquired only after the second contrast injection, with the following imaging parameters: TR/TE = 31/29.3 ms, flip angle = 15 degrees, spiral in sampling, scan time = 10.7 min, 1.5x1.5x2mm3 resolution. All data were collected with continuous RF and gradients with peripheral gating data that were stored for retrospective cardiac gating. The gating data were acquired simultaneously with image acquisition. Gating data were analyzed for heart rate variability during the scan. Brain parenchyma was manually segmented into three regions: gray matter, white matter and a complete cerebral hemisphere (regions of interest were drawn on 1 slice per EPI measurement). In the 3D spiral images, brain parenchyma was average over 3 slices. CBV pulsation was assessed via the pulsatility index, $$$PI = (max - min / mean)$$$. Statistical analysis was performed using paired student’s t-test (significance at P<0.05).Results:
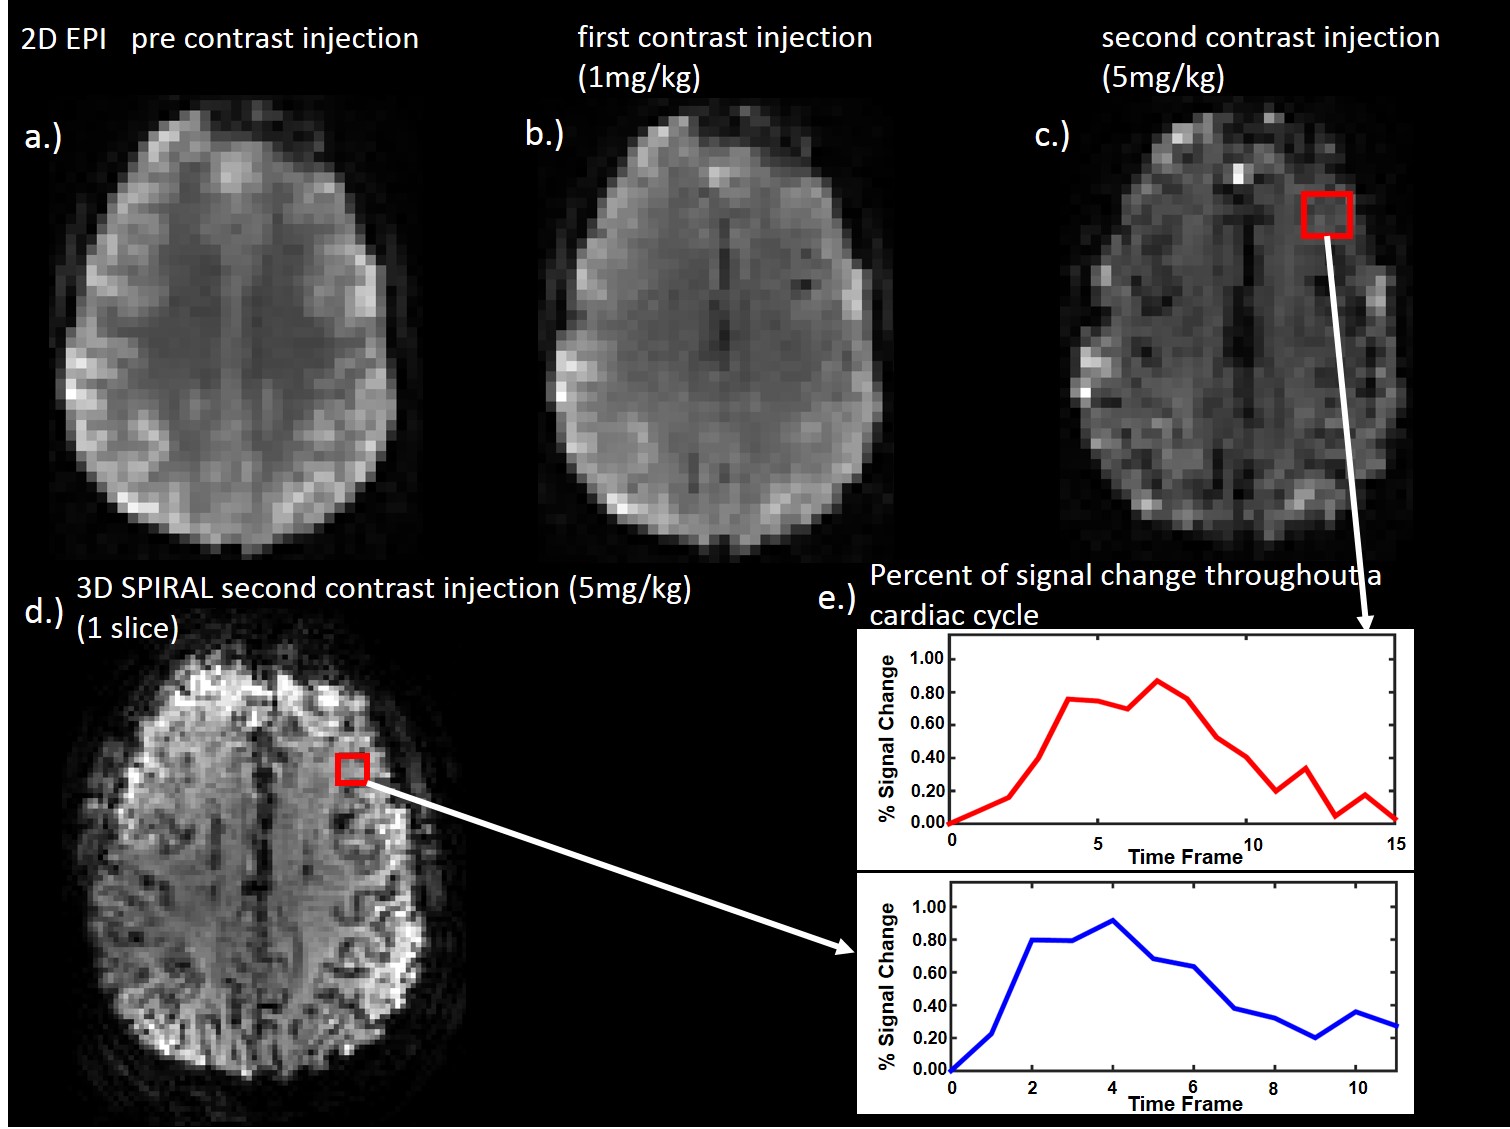
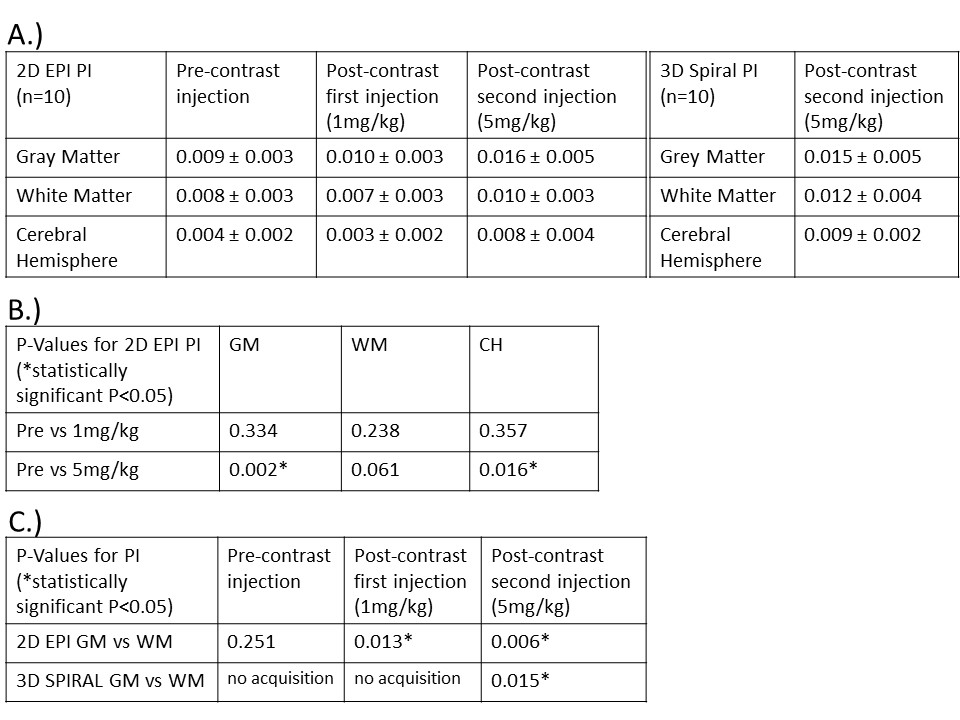
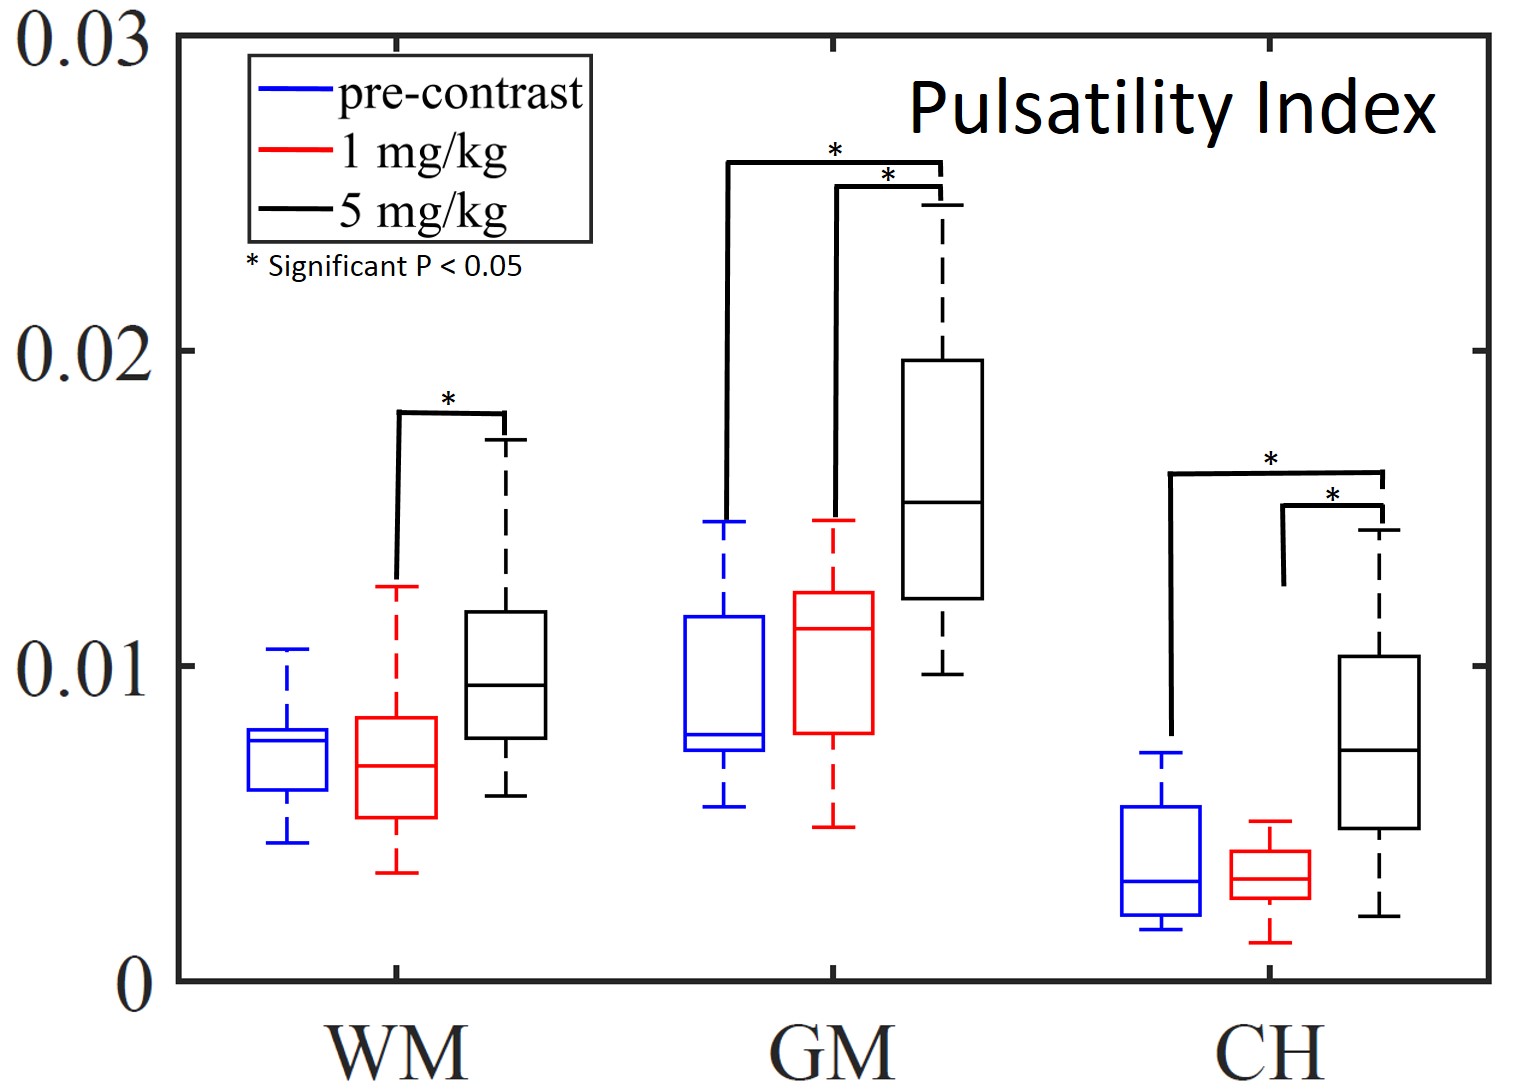
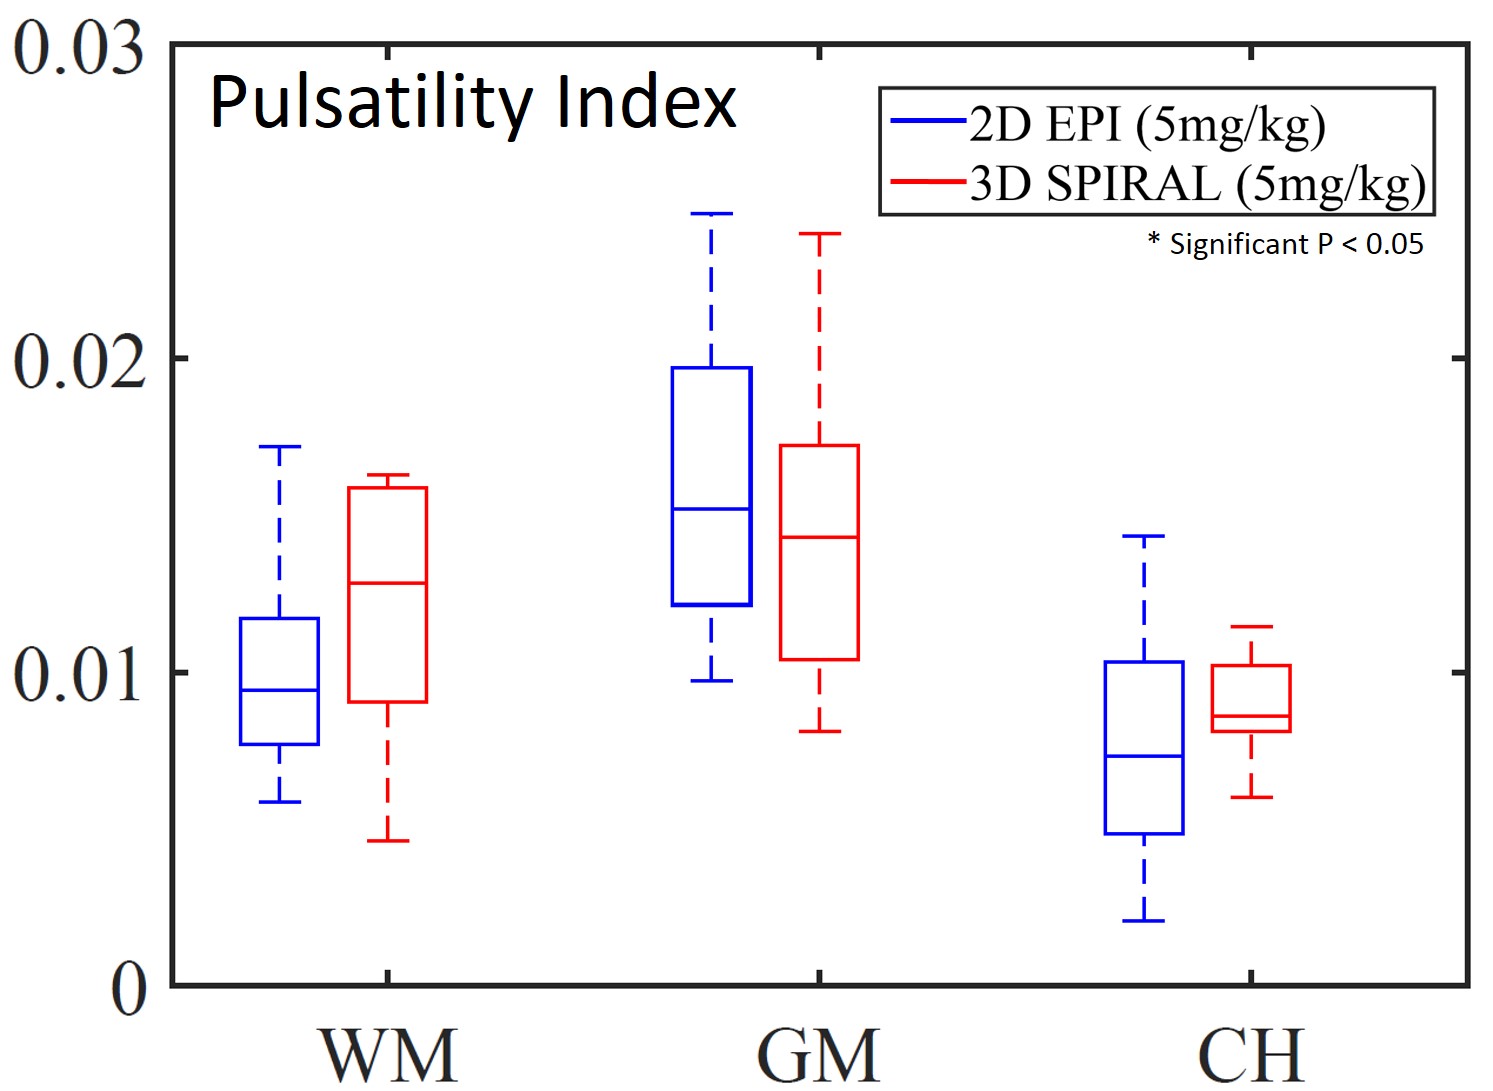
Figure 1 shows 2D EPI images pre- and post-contrast injection (a, b, c) and 1 slice of the 3D spiral acquisition (d). 2D EPI and 3D spiral images were retrospectively sorted and gated to assess T2* signal changes throughout the cardiac cycle (e). Figure 2 shows the PI in gray matter, white matter and cerebral hemisphere from 2D EPI images acquired: pre-contrast, after the first injection (1mg/kg) and the second injection (5mg/kg) (A). Results for the PI in the 3D spiral images are also shown. The PI increased significantly with contrast concentration in the gray matter and cerebral hemisphere in the 2D EPI images. Also, there was a significant increase in PI in the gray matter when compared to white matter PI after contrast injection in both 2D EPI and 3D spiral acquisitions (B, C). Figure 3 shows box plots displaying the PI in the 10 healthy volunteers in the white matter, gray matter and cerebral hemisphere after segmenting the 2D EPI images at 3 different contrast concentrations. Figure 4 shows the PI from 2D EPI and 3D spiral images after the second contrast injection (5mg/kg) in the gray matter, white matter and cerebral hemisphere in 10 healthy controls. No significant differences were found between the two imaging modalities on the segmented regions.Discussion and Conclusion:
In this work, we introduce a novel approach to assess brain parenchyma microvascular pulsatility using T2* signal changes using ferumoxytol enhanced MRI. Significant differences in PI of the cortical gray matter were found when compared to white matter PI values. This non-invasive method to assess microvascular blood volume pulsatility over the cardiac cycle might serve as a potential marker to study capillary pulsatility and narrow the gap of knowledge between arterial and venous measurements.Acknowledgements
We gratefully acknowledge R01NS066982, K24 DK102595 (NIH grant), ASNR Alzheimer’s Grant Award and GE Healthcare for assistance and support.References
1. Rivera-Rivera LA, Turski P, Johnson KM, Hoffman C, Berman SE, Kilgas P, Rowley HA, Carlsson CM, Johnson SC, Wieben O. 4D flow MRI for intracranial hemodynamics assessment in Alzheimer's disease. J Cereb Blood Flow Metab. 2015. doi: 10.1177/0271678X15617171. PubMed PMID: 26661239.
2. Rivera-Rivera LA, Schubert T, Turski P, Johnson KM, Berman SE, Rowley HA, Carlsson CM, Johnson SC, Wieben O. Intracranial venous blood flow and pulsatility in Alzheimer’s disease with 4D flow MRI. Journal of Cerebral Blood Flow & Metabolism, 2016 Aug 4. pii: 0271678X16661340.
3. Stone J, Johnstone DM, Mitrofanis J, O'Rourke M. The mechanical cause of age-related dementia (Alzheimer's disease): the brain is destroyed by the pulse. J Alzheimers Dis. 2015;44(2):355-73. doi: 10.3233/JAD-141884. PubMed PMID: 25318547.
4. Rashid S, McAllister JP, 2nd, Yu Y, Wagshul ME. Neocortical capillary flow pulsatility is not elevated in experimental communicating hydrocephalus. J Cereb Blood Flow Metab. 2012;32(2):318-29. doi: 10.1038/jcbfm.2011.130. PubMed PMID: 21934694; PMCID: PMC3272598.
5. Christen T, Ni W, Qiu DQ, Schmiedeskamp H, Bammer R, Moseley M, Zaharchuk G. High-resolution cerebral blood volume imaging in humans using the blood pool contrast agent ferumoxytol. Magn Reson Med. 2013;70(3):705-10. doi: 10.1002/mrm.24500. PubMed PMID: WOS:000323543600012.
Figures