4549
Validation of inhomogeneous Magnetization Transfer (ihMT) as a myelin biomarker1Aix Marseille Univ, CNRS, CRMBM, UMR 7339, Marseille, France, 2Aix Marseille Univ, CNRS, IBDM, UMR 7288, Marseille, France, 3Division of MR Research, Beth Israel Deaconess Medical Center, Harvard Medical School, Boston, MA, United States, 4Aix Marseille Univ, APHM, Hôpital de La Timone, Pôle de Neurosciences Cliniques, Service de Neurologie, Marseille, France
Synopsis
The ihMT (inhomogeneous Magnetization transfer) signal qualitatively demonstrates sensitivity for myelinated structures. However, image intensity and contrast vary with the saturation parameters, further questioning the specificity of ihM for myelin. This study validated ihMT as a myelin biomarker by demonstrating for various ihMT sequences, linear relationships between ihMT signal and intensity of fluorescence microscopy (a quantitative myelin specific histology technique) collected in plp-GFP mouse brain.
Introduction
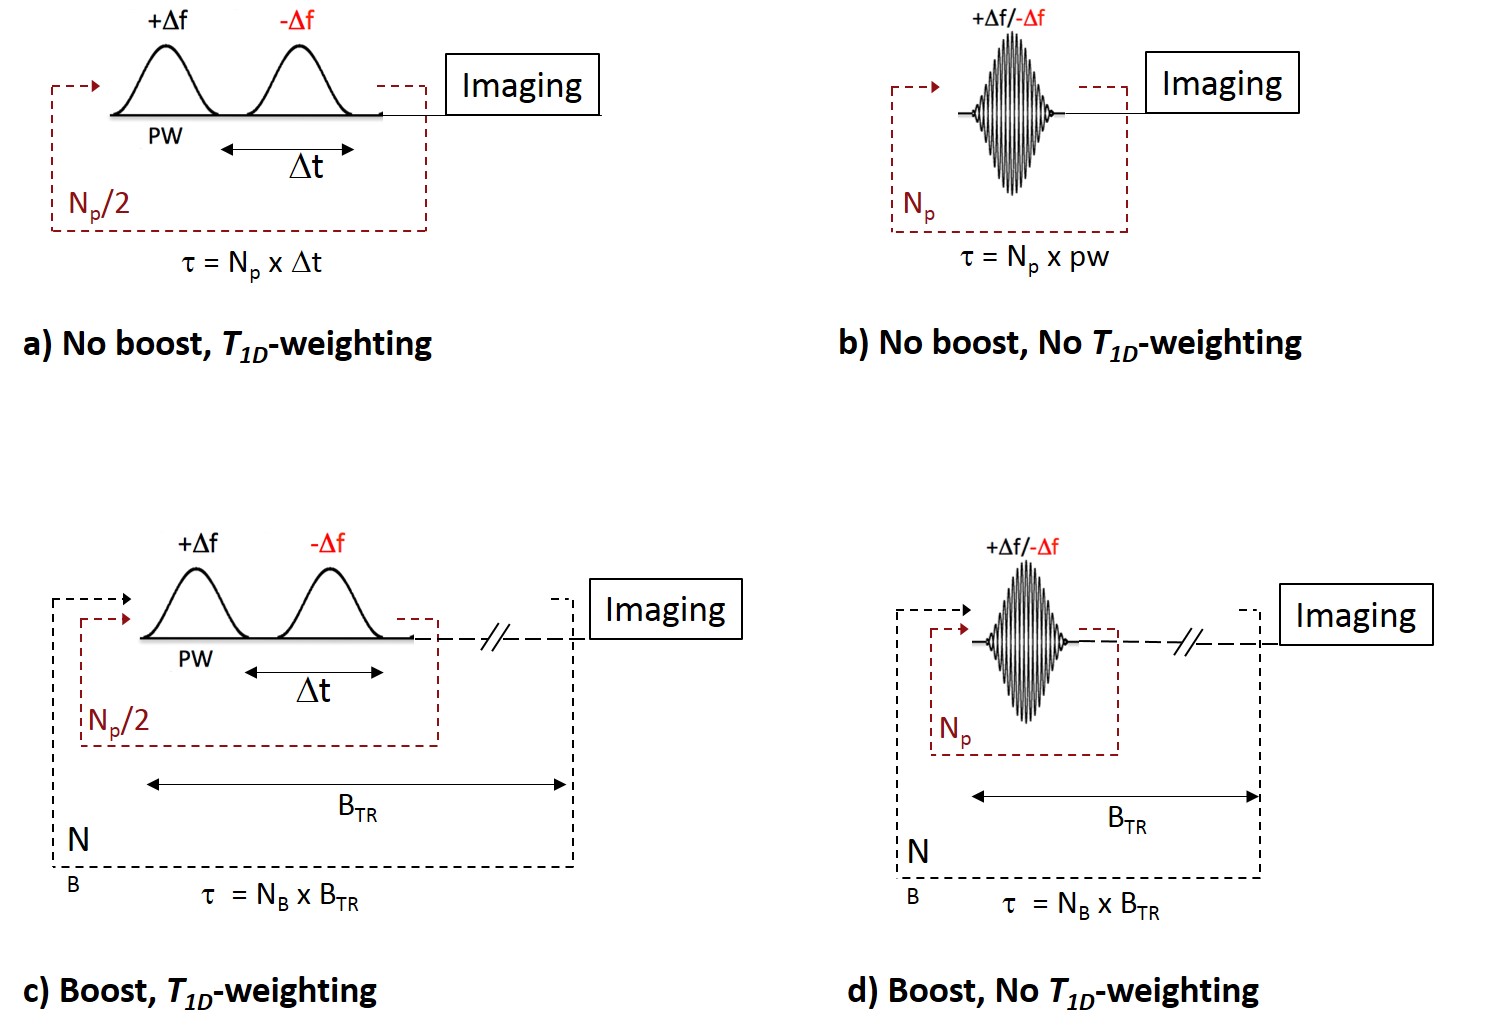
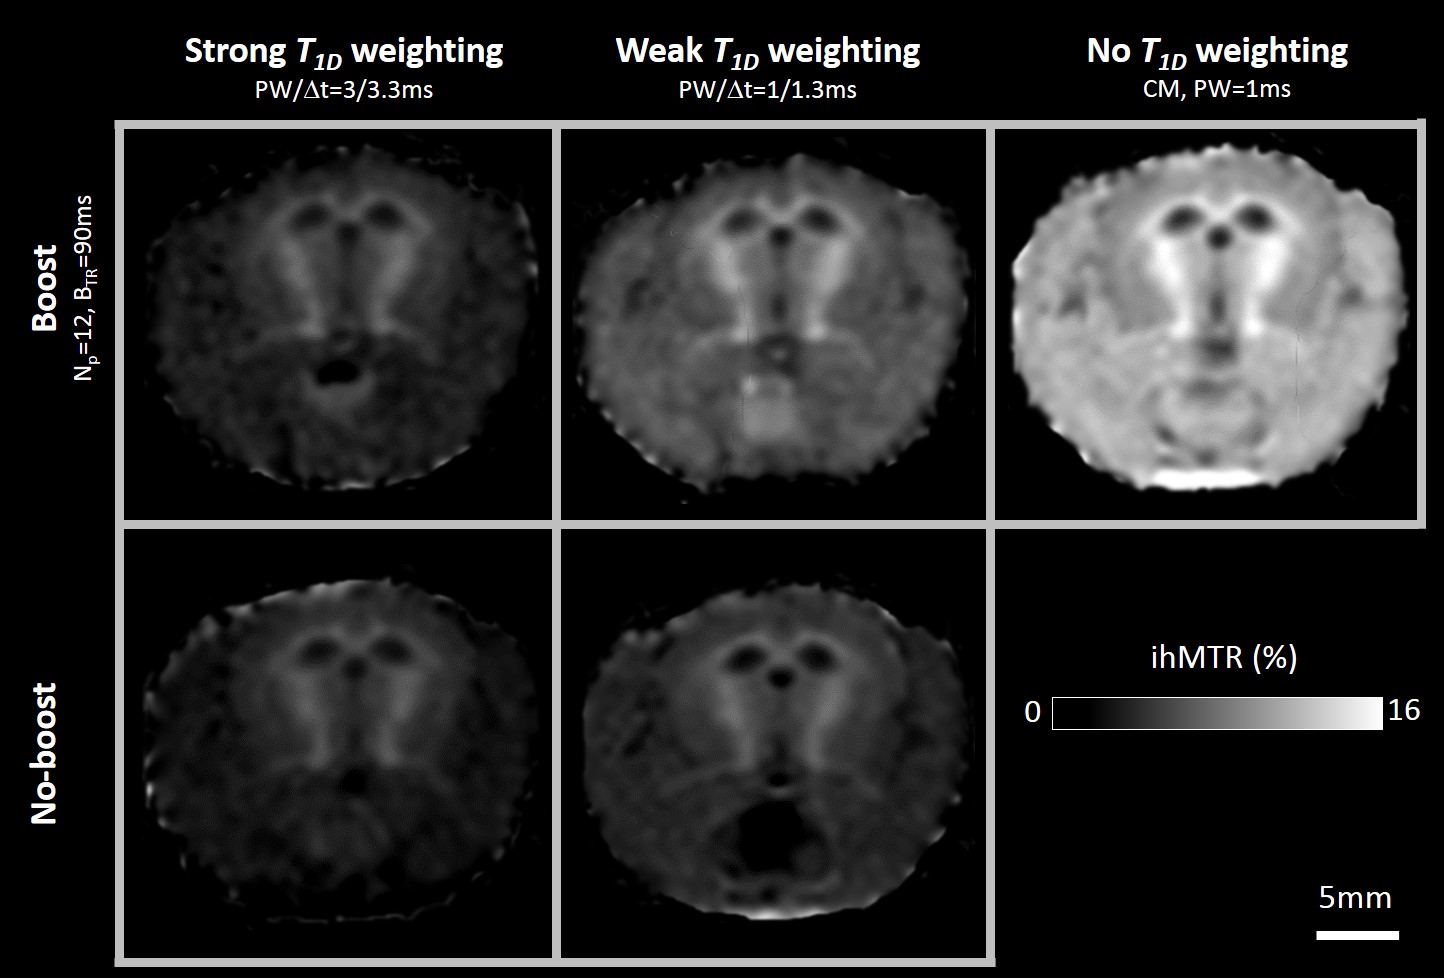
Inhomogeneous magnetization transfer (ihMT) was recently interpreted as a dipolar relaxation time (T1D) weighted imaging technique (1–3). In particular, adjustments of the dual-offset saturation, achieved by alternating frequency RF pulses or cosine modulation (CM) (Figs.1a,b) allows filtering or reveals ihMT signals of components within a specific range of T1Ds (2). Another important recent finding is the possibility to boost the ihMT sensitivity using a concentrated and sparse RF power deposition during the saturation period (4,5) (Figs.1c,d). Regardless of the ihMT sequence variant used for imaging, ihMT signal qualitatively demonstrates sensitivity to myelinated structures. However, image intensity and contrast vary with the saturation parameters (Fig.2), further questioning the putative specificity of ihMT for myelin. In this context a validation experiment against a quantitative myelin specific histological technique is required to demonstrate that ihMT is a myelin biomarker. One such histological technique is fluorescence microscopy performed on a transgenic plp-GFP mouse line expressing the green fluorescent protein (GFP) driven by the mouse myelin proteolipid protein (plp) gene promoter (6). Plp is specifically and massively expressed in the oligodendrocytes, the terminally differentiated cells responsible for myelin synthesis. The fluorescence signal collected by microscopy in plp-GFP mice is thus proportional to myelin content. Our study aimed at validating ihMT as a myelin biomarker by looking for relationships between ihMTR values in plp-GFP mouse brain for various ihMT sequences with different T1D-weightings and sensitivity boost, and with fluorescence intensity collected in the same mice.Method
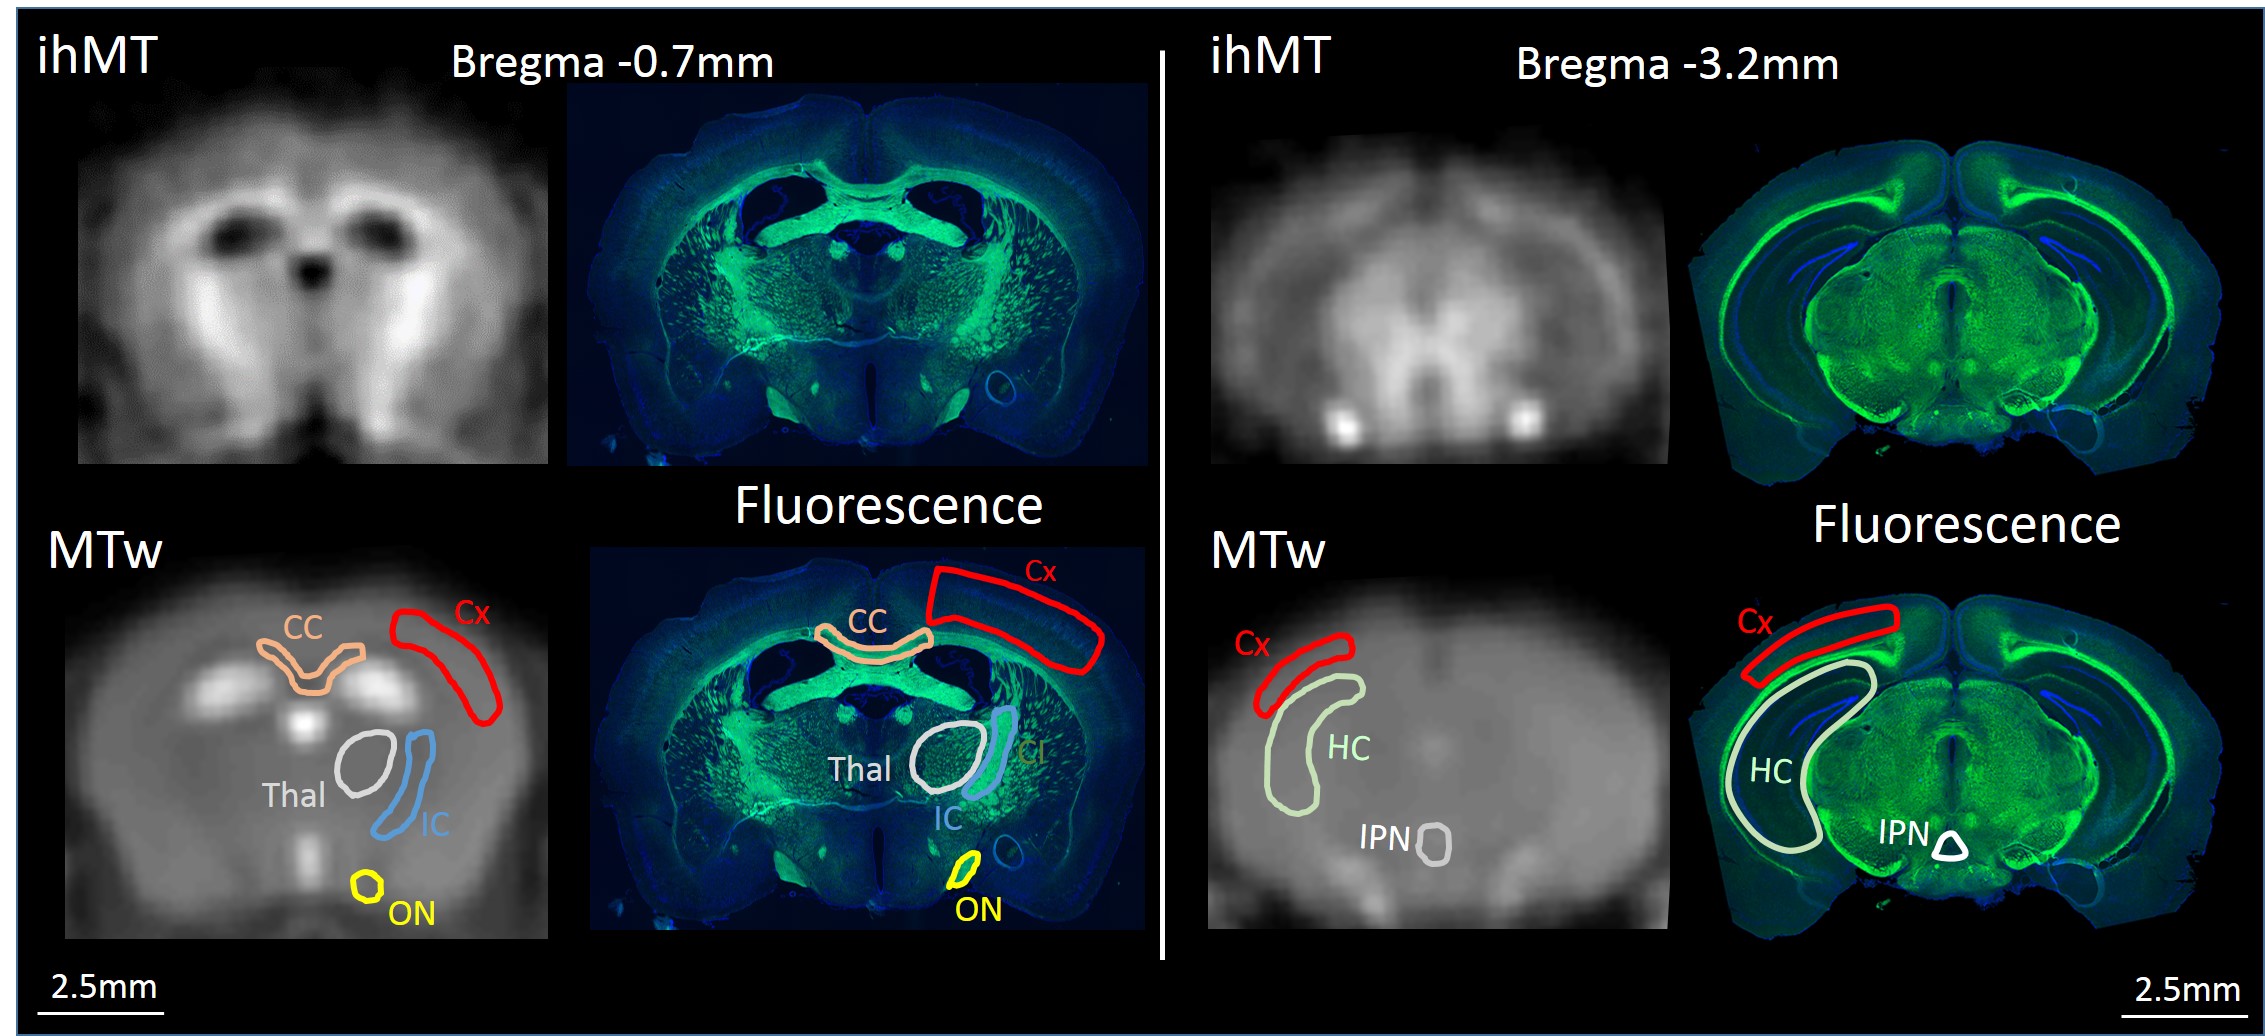
MR experiments were performed on a Bruker Avance 500 MHz/89mm wide bore vertical imager on anaesthetized healthy plp-GFP mice (10 weeks, n=3). A 2D ihMT prepared single shot RARE sequence (7) (TR/TE=3.4s/1.82ms, FOV=25x25mm², Mtx=64x64 (300μm in-plane resolution), slice thickness=1mm, 2 slices located -0.7mm and -3.2mm from Bregma) was used to acquire ihMT images with 5 different configurations: configuration 1: no-boost and strong T1D weighting (Fig. 1a, PW/Δt=3/3.3ms); configuration 2: no-boost and weak T1D weighting (Fig. 1a, PW/Δt=1/1.3ms); configuration 3: boost and strong T1D weighting (Fig. 1c, Np=12, BTR=90ms, PW/Δt=3/3.3ms); configuration 4: boost and weak T1Dweighting (Fig. 1c, Np=12, BTR=90ms, PW/Δt=1/1.3ms); configuration 5: boost and no-T1D weighting (Fig. 1d, Np=12, BTR=90ms, CM PW=1ms). Other common saturation parameters were: total deposited energy (Etr=40μT².s), saturation time (t=0.9s) and frequency offset (Δf=10kHz). For each configuration a total number of 20 NEX were acquired to increase SNR. After the MR experiments, mice were sacrificed and perfused with fixative (PFA 4%). Mice brain were extracted and sectioned for fluorescence analyses performed in 20µm thick histological slices located at levels similar to MRI slices. IhMTR values (defined as the ihMT signal divided by the unsaturated M0 signal) were measured in regions with different expected myelin content and for which uniform signal was assumed throughout the larger thickness of the MRI slice (Fig.3). Quantification of myelin content was obtained in the same areas from the mean GFP signal intensity measurement (ImageJ software (NIH)) and relationships between the different ihMTR values and myelin content were estimated.Results and Discussion
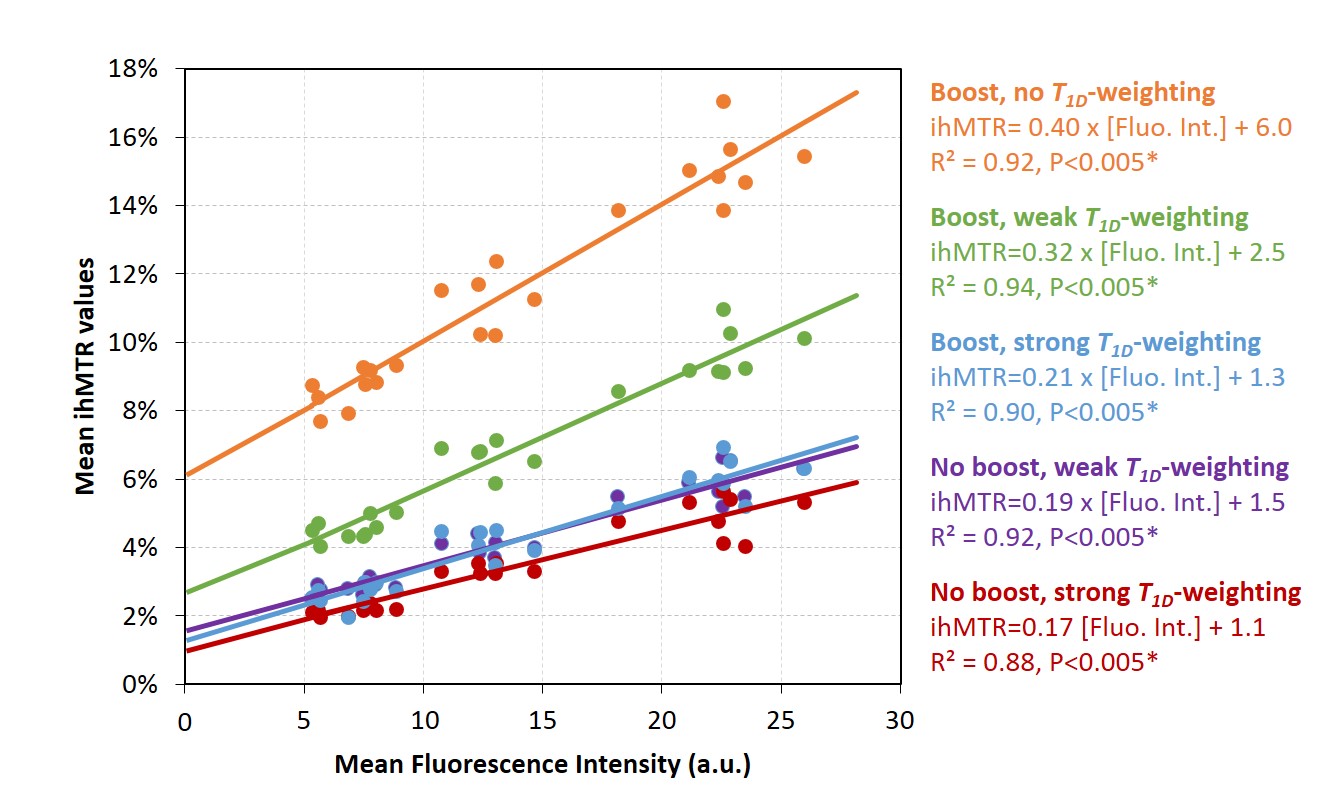
IhMTR images of different configurations are shown on Fig.2. Figure 3 shows examples of boost and weak T1D-weighting ihMT images and corresponding GFP fluorescence images, along with the location of ROIs where quantitative analyses were performed. Mean ihMTR values in the different ROIs and for the 5 different configurations plotted as a function of myelin content are reported on Fig. 4. The high R² values (R²>0.9) associated with linear fit performed for each set of ihMT configuration illustrated the strong linear correlation between ihMTR values and GFP intensity, and hence validated ihMT as a biomarker of myelin content regardless of the saturation parameters, that is, regardless of T1D-weighting or sensitivity boost. However, these latters manifested themselves through the different slopes (sensitivity) and intercepts (specificity) of affine functions obtained for each configuration and must be taken into account for myelin quantification with ihMTR values. In particular, boosted techniques without strong T1D-weighting (orange and green curves) provided higher sensitivity (higher slope) but reduced specificity (higher intercept value). Conversely, techniques with strong T1D-weighting showed little change in specificity and moderate increase of sensitivity with the boost approach (purple and red curves). This suggested that the boosted techniques are more efficient in revealing short T1D components. Future work will study if these components arise from myelin or if they could be considered as confounding factors for myelin quantification.Conclusion
This study demonstrates strong linear correlation between ihMTR and myelin fluorescent signal in plp-GFP mice, regardless of the saturation parameters, thus validating the ihMT technique as a myelin biomarker technique.Acknowledgements
Support from A*MIDEX grant (n°ANR-11-IDEX-0001-02) funded by the
French Government “Investissements d’Avenir” program.
The authors thank N.C. for animal handling.
References
1. Varma G, Girard OM, Prevost VH, Grant A, Duhamel GD, Alsop DC. Interpretation of magnetization transfer from inhomogeneously broadened lines (ihMT) in tissues as a dipolar order effect within motion restricted molecules. J. Magn. Reson. 2015;260:67–76. doi: 10.1016/j.jmr.2015.08.024.
2. Duhamel G, Prevost VH, Varma G, Alsop DC, Girard OM. T1D-w ihMT: Dipolar relaxation time weighted imaging using inhomogeneous magnetization transfer. In: International Society for Magnetic Resonance in Medicine. Singapore; 2016. p. 2909.
3. Swanson SD, Malyarenko DI, Fabiilli ML, Welsh RC, Nielsen J-F, Srinivasan A. Molecular, dynamic, and structural origin of inhomogeneous magnetization transfer in lipid membranes: Origin of ihMT Contrast. Magn. Reson. Med. 2016:n/a-n/a. doi: 10.1002/mrm.26210.
4. Varma G, Girard OM, Prevost VH, Duhamel G, Alsop DC. Increasing the Inhomogeneous Magnetization Transfer (ihMT) Signal in Vivo with High Amplitude, Low Duty Cycle Irradiation. i 2890 (2016). In: International Society for Magnetic Resonance in Medicine. Singapore; 2016. p. 2890.
5. Girard OM, Varma G, MChinda S, Prevost VH, Le Troter A, Rapacchi S, Guye M, Ranjeva J-P, Alsop DC, Duhamel GD. Theoretical and Experimental Optimization of a 3D Steady- State Inhomogeneous Magnetization Transfer (ihMT) Gradient Echo Sequence: Boosting the ihMT Sensitivity with Sparse Energy Deposition. In: International Society for Magnetic Resonance in Medicine. Singapore; 2016.
6. Ferent J, Ruat M, Traiffort E. Investigation of the proteolipid protein promoter activity during demyelination and repair. Differ. Res. Biol. Divers. 2013;85:182–189. doi: 10.1016/j.diff.2013.05.002.
7. Girard OM, Prevost VH, Varma G, Cozzone PJ, Alsop DC, Duhamel G. Magnetization transfer from inhomogeneously broadened lines (ihMT): Experimental optimization of saturation parameters for human brain imaging at 1.5 Tesla. Magn. Reson. Med. 2015;73:2111–21. doi: 10.1002/mrm.25330.
Figures