4546
The first observation of 17O MRI in normal rats at 21.1 TVictor D. Schepkin1, Andreas Neubauer2, Christian Schuch3, Tilo Glaeser3, Michael Kievel3, Steven L. Ranner1, William W. Brey1, Shannon Helsper1, and Lothar Schad2
1CIMAR, NHMFL/FSU, Tallahassee, FL, United States, 2University of Heidelberg, Mannheim, Germany, 3NUKEM Isotopes, Alzenau, Germany
Synopsis
The capability of 17O MRI in a rat head was evaluated at the high magnetic field of 21.1 T (NHMFL, Tallahassee). The results demonstrated that 17O MR relaxation times are dependent on the magnetic field strength which correlates with experimental observations for sodium. Well separated MR peaks of 17O water and 6-17O glucose provided the time courses of water distribution and glucose consumption in vivo. 3D 17O MRI is possible with a resolution of 1 mm3 in normal rats. 17O MRI is a promising tool for future tumor detection and evaluation of tumor glucose consumption rates.
Introduction
The natural abundance 17O MR signal in vivo ranks third after proton and sodium. For the same acquisition interval, the 17O signal is 3 times less than sodium 1. Thus, the capability of the 17O MRI for in vivo studies at the magnetic field of 21.1 T (NHMFL, Tallahassee) is a promising tool. It is already expected that the increased magnetic field can bring a gain in scan time or in imaging resolution. However, the ultra-high magnetic field can also change 17O MR relaxation times, which will be demonstrated below. The main goal of this study is to explore the capability of 17O in vivo MRI at 21.1 T and present the results of using labeled 17O glucose and 17O water as the first steps for future tumor detection based on the Warburg effect.Methods
The MR experiments were performed on a 21.1 T magnet using Bruker MRI Avance III console (PV 5.1). The MR frequency for 17O was 121.65 MHz. The in vivo RF probe has a double tuned 17O/1H volume RF coil with an internal diameter of 33 mm, covering the whole rat head. Duration of the 90 RF pulse for 17O in vivo was 165 μs. The 17O MR relaxation times T1 and T2 were measured using 180°-t-90° or 90°-t-180° pulse sequences respectively using 256 steps, NA = 16. Both data were fitted by a single exponential function. 3D MR rat head imaging scans were performed using a modified Bruker UTE pulse sequence with voxel of 1 mL, matrix 64x64x64, FOV=64x64x64 mm, TR = 15 ms, TE = 0.2 ms, NA = 16 for natural 17O abundance or NA=1 after 17O enrichments. Scan time in the last case was 1.5 min. The time course of 17O MR signal was investigated after IV tail injections of 1 mL PBS solution containing 17% enriched H217O or 1.5 ml of PBS with 500 mg of 6-17O 47% enriched D-glucose. The in vivo experiments were performed using 3 male Fisher 344 rats (~ 200 g). All animal experiments were conducted according to the protocols approved by The Florida State University ACUC.Results and Discussion
The relaxation times T1 and T2 at 21.1 T are presented in comparison to the previous data of others at a lower magnetic field 2, 3 (Fig. 1). It was found that T2 of 17O in a rat head was 2.07 ± 0.03 ms (n = 3), which is much less than the 3.03 ms found earlier at 9.4 T 2. The corresponding T1 relaxation time at 21.1 T was 5.35 ± 0.09 ms (n=3), which is a bit higher than at 9.4 T and close to 16.4 T 3. Additionally, the 17O MR relaxation times in 0.45% saline solution, are both larger at 21.1 T (T1 = 7.6 ± 0.24 ms, T2 = 6.5 ± 0.2 ms) than at 9.4 T (T1= 6.5 ms, T2=4.1 ms) 2. Thus, the 17O MR relaxation mechanism is dependent on the strength of the magnetic field, as was also observed for sodium 4, 5. 3D MRI of 17O in a rat head can be acquired with a resolution of 1x1x1 mm with a scan time of 1.5 min after an IV injection of 1 ml of 17% enriched H217O (Fig. 2). The image acquired one minute after 17O water injection demonstrated the increased perfusion of the rat brain and cortical areas. The 17O water signal decreased after the injection due to its distribution inside the rat body with the exponential decay time of 11 ± 0.4min (n=2). Injection of the 6-17O labeled glucose yielded in 1.5 minutes a separate MR peak of glucose well separated from the 17O water signal (Fig. 3). The glucose peak, after the initial bolus passage, was slowly decreasing as a result of glucose metabolism (Fig 3). The exponential glucose breakdown time was 48.2 ± 1.9 min (n=2). At the same time the rate of increase for the 17O MR water peak was ~ 1.5 times less.Conclusion
The results demonstrate that 17O MR relaxation times are dependent on the strength of the magnetic field which correlates with the earlier observations for sodium. The well separated 17O MR signals of glucose and water at the ultra-high magnetic field and the corresponding time courses provided separate rates of water distribution and glucose consumption in the rat head. 3D 17O MRI is possible with a resolution of 1 mm3 in the rat head. Thus, enriched oxygen MRI can be a promising tool for future tumor detection based on the Warburg hypothesis and for evaluating the rates of glucose metabolism in tumors.Acknowledgements
The study was performed at the National High Magnetic Field Laboratory (Tallahassee) supported by NSF, grant No. DMR-115490. Many thanks to Richard Desilets, Ashley Blue, Jason Kitchen, Malathy Elumalai, and Peter Gor’kov for their valuable help with RF probes.References
[1] Budinger T, Bird M, Frydman L, et al. Towards 20 T magnetic resonance for human brain studies: opportunities for discovery and neuroscience rationale. MAGMA, Magnetic Resonance Materials in Physics, Biology and Medicine (Magn Reson Mater Phy) 2016; 1-23. [2] Zhu X, Merkle H, Kwang J, et al. 17O relaxation time and NMR sensitivity of cerebral water and their field dependence. Magn Reson Med. 2001; 45:543-549. [3] Lu M, Zhang Y, Ugurbil K, et al. In vitro and in vivo studies of 17O NMR sensitivity at 9.4 and 16.4 T. Magn Reson Med. 2013; 69:1523-1527. [4] Schepkin V. Sodium MRI of glioma in animal models at ultrahigh magnetic fields. NMR Biomed. 2016; 29:175-186. [5] Nagel A, Umathum R, Rosle M, et al. 19K and 23Na relaxation times and MRI of rat head at 21.1 T. NMR in Biomed. 2016; 29:759-766.Figures
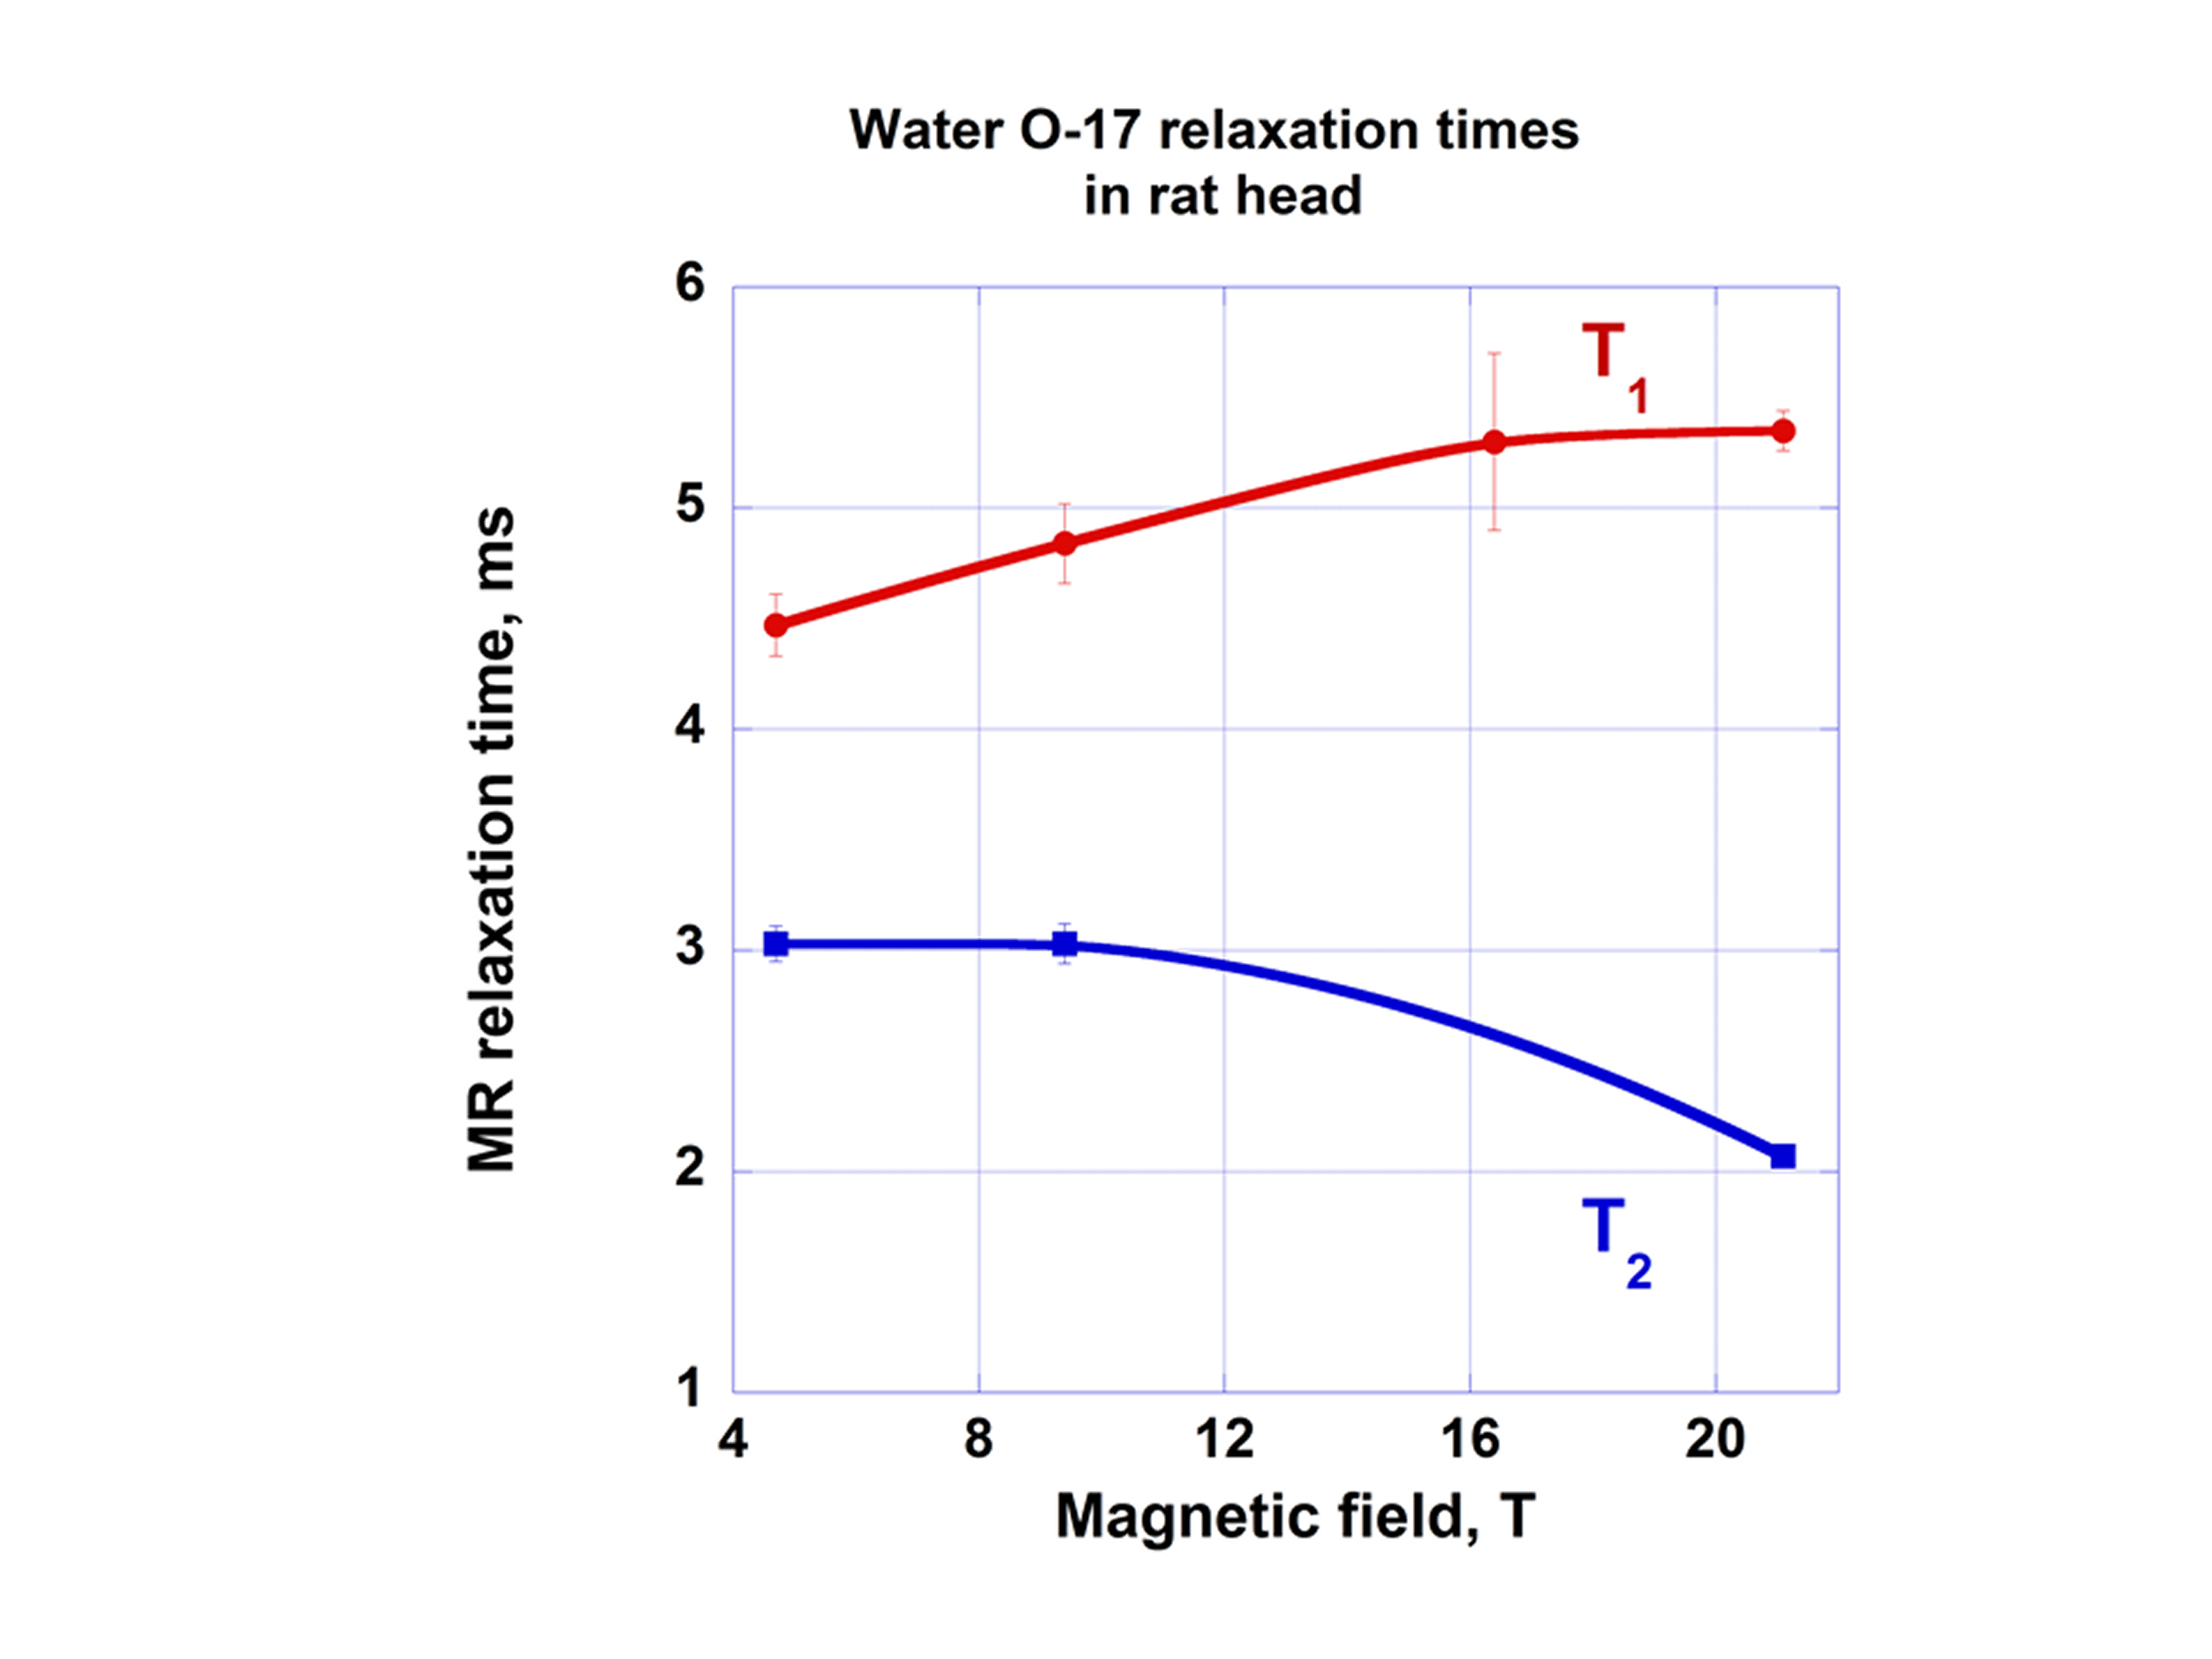
Fig.
1. Magnetic field strength dependence of
17O MR relaxation times in a rat head. The data at 21.1 T is presented relative to
the lower field data of others 2, 3.
Note the decrease of the T2 relaxation time at the high
magnetic field.
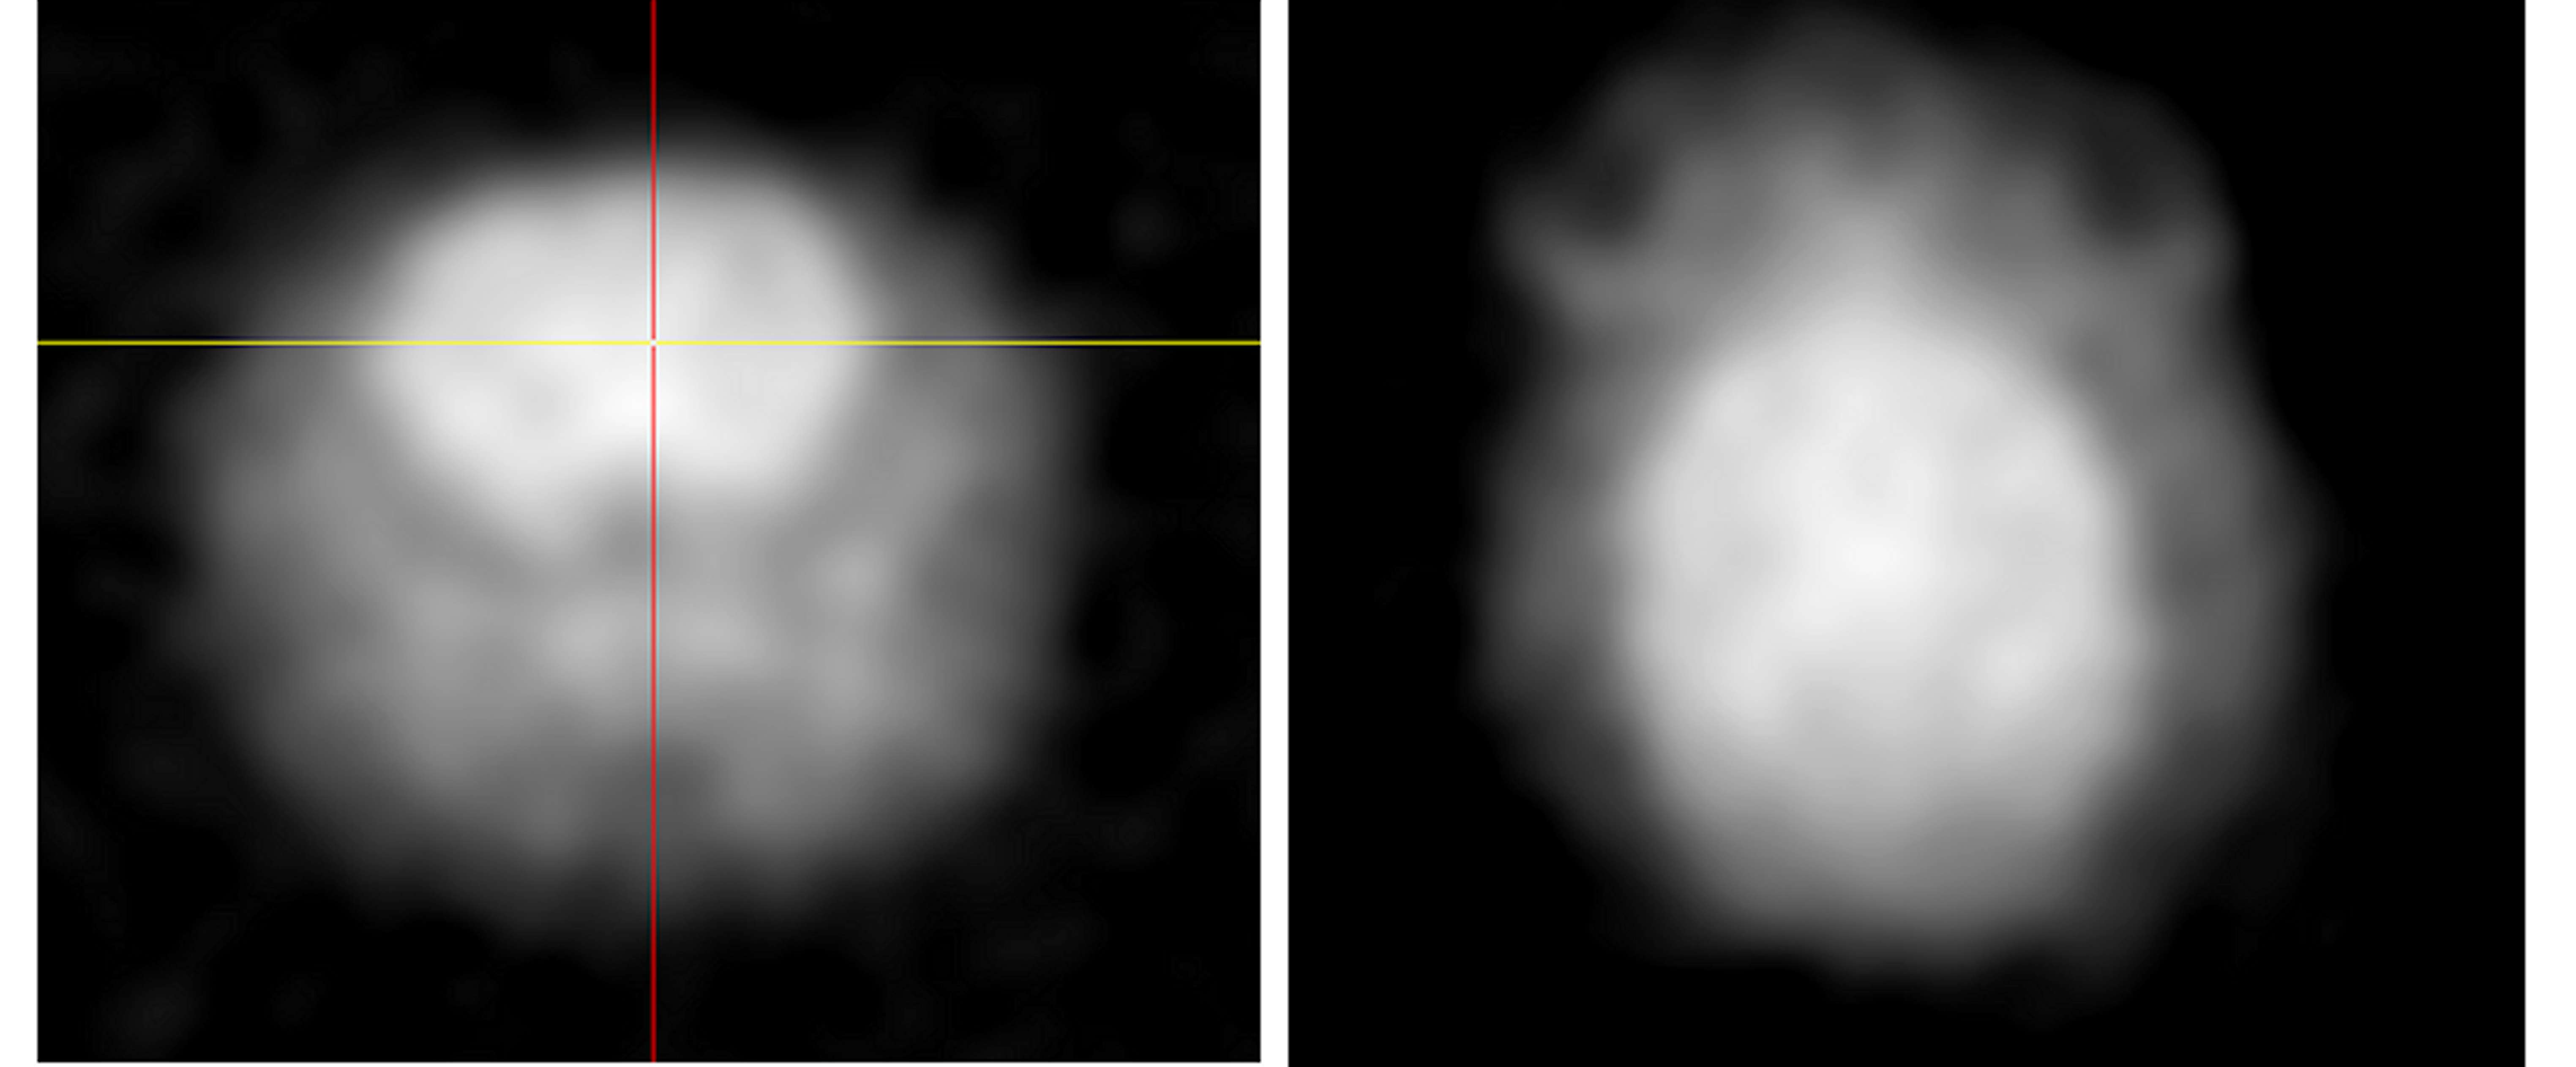
Fig. 2. 17O 3D MRI of
rat head 1 min after injection of 17% enriched H217O. Scan time was 1.5 min, resolution 1x1x1
mm. Note the increased perfusion in all
areas of the rat brain and in the cortical areas.
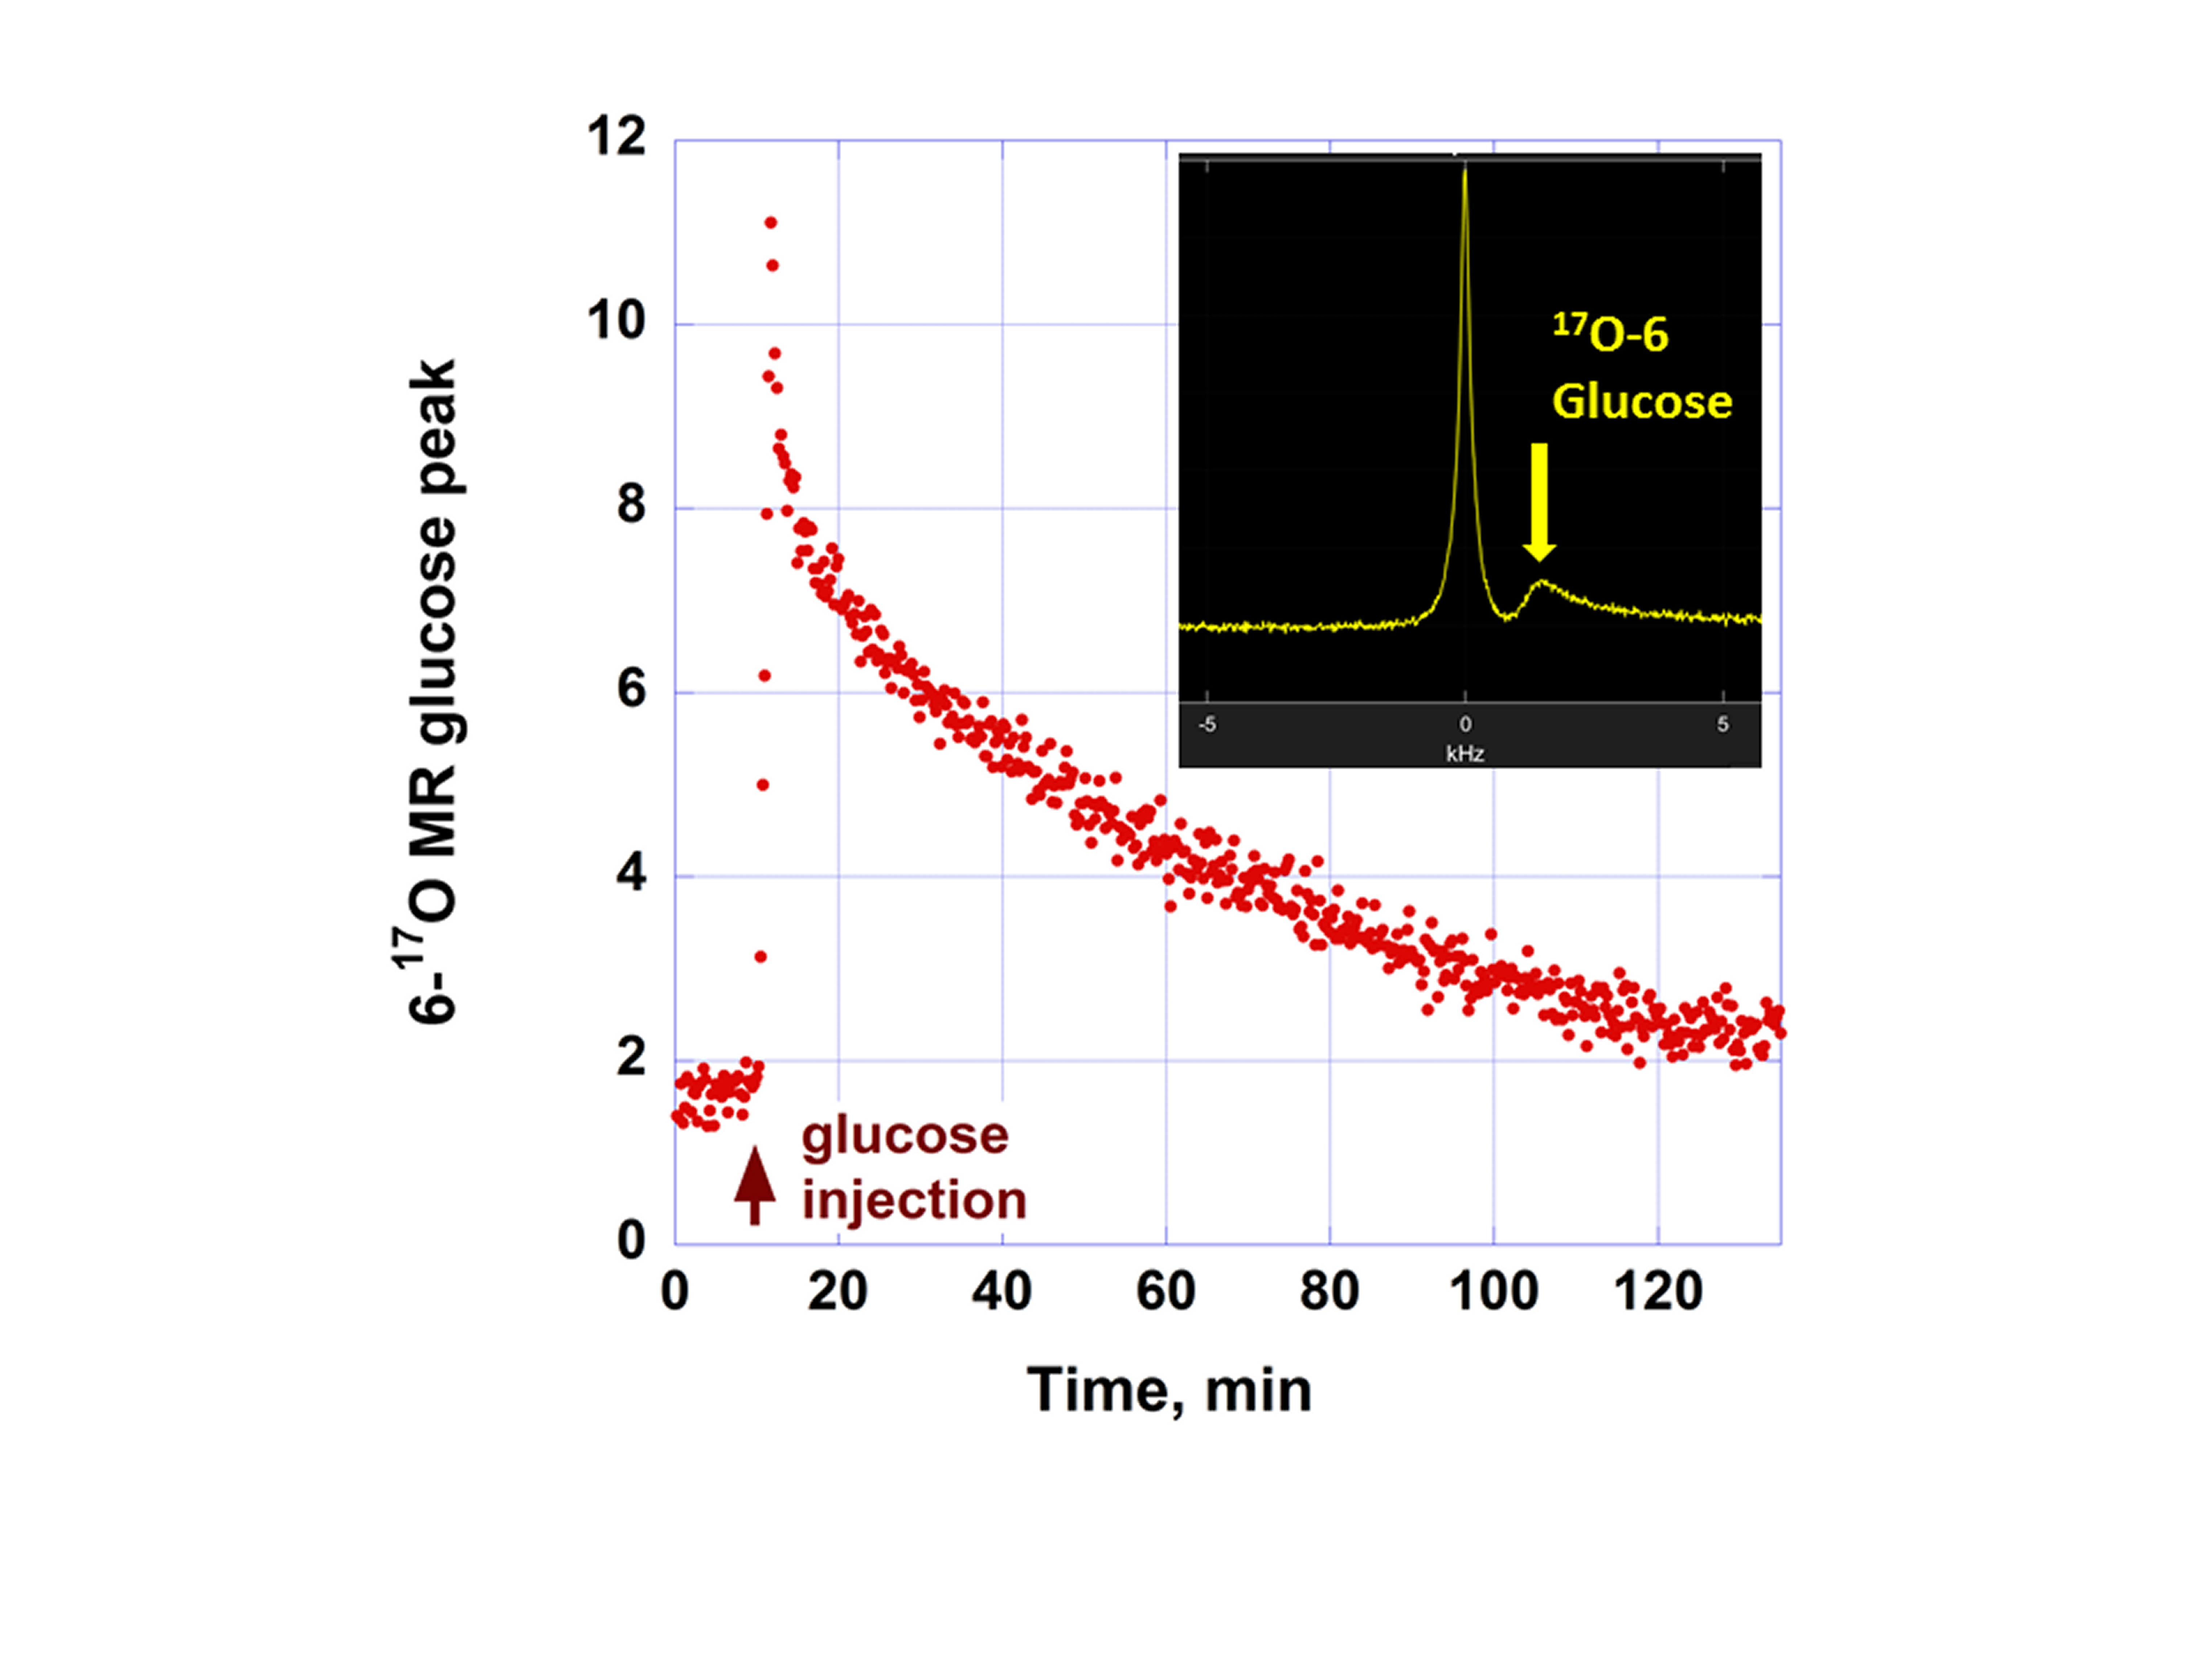
Fig. 3. The
time course of metabolic 17O MR glucose signal decrease in a rat
head after IV injection of the 17O labeled glucose. Each point represents
a 6-17O glucose MR peak with a step of 15 s. The insert demonstrates one of such peaks,
when the glucose MR signal is maximum.
The MR peak of 6-17O glucose is at -12.3 ppm relative to 17O water
peak. Glucose signal in the rat head after
the initial quick bolus passage was fitted reasonably well by the exponential
function with a decay time of 48.2 ±
1.9 min (n=2).