4545
Advancing Quantitative Brain Injury Lesion Imaging Using Total Field Inversion QSM1Radiology, Harvard Medical School / BIDMC, Boston, MA, United States, 2Cornell University
Synopsis
Traumatic brain injury often results in brain lesions which are subtle. Current conventional MRI techniques (GRE and SWI) are field strength and echo time dependent, causing lesions to possible be missed. QSM methods can overcome this, but with many artifacts and missed lesions due to masking artifacts. TFI QSM can overcome this issue, as we demonstrate in this study of TBI patients.
INTRODUCTION
Traumatic brain injury (TBI) is a leading cause of death and disability, with an estimated 1.5 million people in the United States sustaining nonfatal TBI annually1. While CT imaging can well demonstrate large cerebral hemorrhages, smaller cerebral microhemorrhages (CMH), which may be associated with these injuries, are better visualized on MRI. Identifying CMH burden can help characterize the severity of post traumatic brain injury, and understand patient symptoms2,3. T2*-weighted gradient- recalled-echo (GRE) MRI has been the method of choice to detect CMH, with susceptibility-weighted imaging (SWI), providing greater sensitivity by manipulating magnitude images with phase information 4 . These methods, however, are dependent on imaging field strength and echo times5. Quantitative susceptibility mapping (QSM) can estimate the intrinsic susceptibility distribution of tissue, is independent of data acquisition parameters, and should reflect the actual spatial extent of lesions6-9. It has also been shown that QSM enables discrimination between diamagnetic and paramagnetic lesions10. A challenge to performing QSM imaging arises from assumptions implicit in most background field removal methods, resulting in imprecise separation of background and tissue fields. This issue is particularly prominent near the brain boundary, where large tissue–air susceptibility differences are present11. To avoid the separate fitting of background and local field, Laplacian-based QSM methods have been proposed based on the partial differential formulation of the forward signal equation, which implicitly eliminates the background field 12,13. However, the implementation of the Laplacian requires some compromise between robustness against error amplification and the integrity of the visualized cortical brain tissue14. This tradeoff often results in necessary erosion of the brain mask, which may prevent visualization of structures at the brain boundaries. The total field inversion preconditioned QSM method (TFI) has been recently demonstrated to reduce the error propagation associated with imprecise background field removal, and suppress streaking artifacts in intracerebral hemorrhage on QSM images. In this work we compare a traditional masking based QSM method, Morphology enabled dipole inversion (MEDI), with TFI QSM in a cohort of TBI patients and controls, to evaluate TFI QSM’s ability to depict brain both normal brain parenchyma and hemorrhagic brain lesions.METHODS
Under an IRB approved protocol, outpatients with history of TBI and control subjects were recruited. Subjects underwent Imaging using a GE Discovery MR750 3.0 T MRI scanner (G.E., Waukesha, WI), using a 3D multi shot multi-echo EPI acquisition [3D MSME] (TR 98ms, Echoes=3 [ TE=16, 39.5, 62.5], matrix 224x224, Resolution =1x1x1mm3), and a 3D FSPGR (TR/TE/TI 9.5/3.8/900 ms, Resolution =1x1x1mm3) using an 8 channel GE head coil. MEDI QSM images were created using the MEDI toolbox using the default mask [genmask.m]15, and TFI QSM images were created using the method described by Liu et al16. Both magnitude and QSM images were created from the 3DMSME data, and were reviewed with the T1 weighted FSPGR images by a board certified neuroradiologist and a radiology resident, evaluating for differences in depiction of normal anatomy and lesions.RESULTS
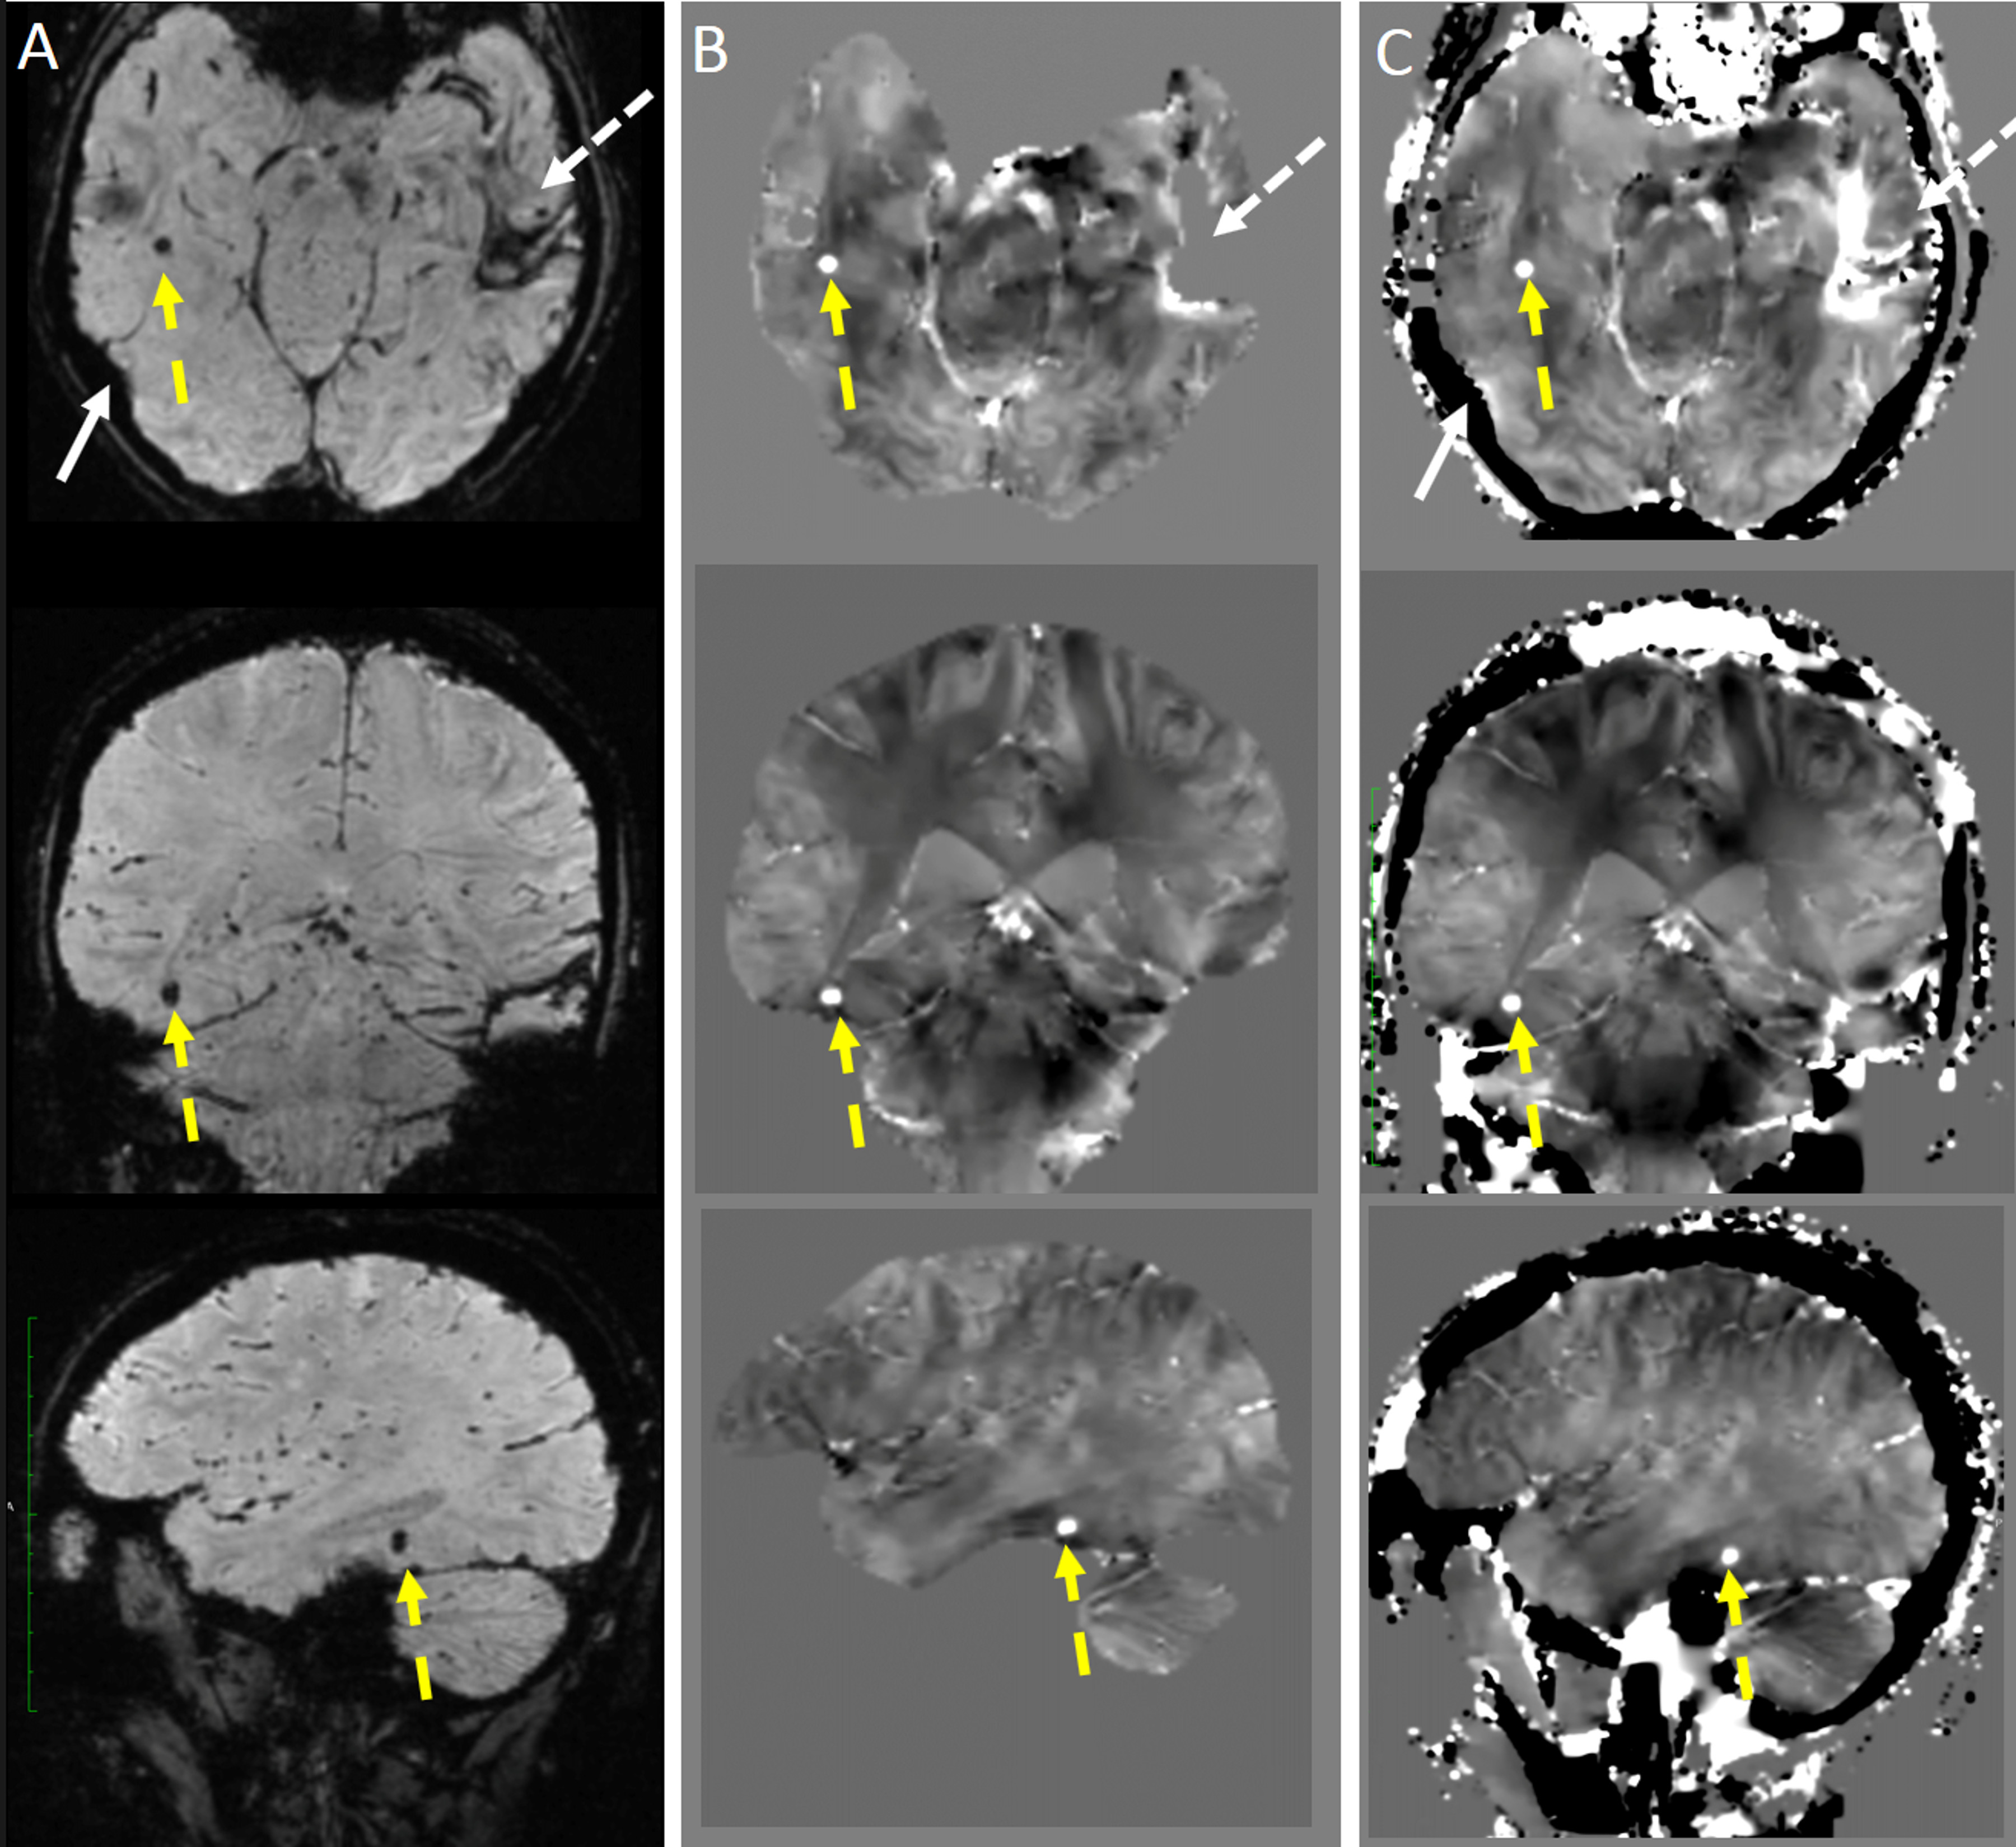
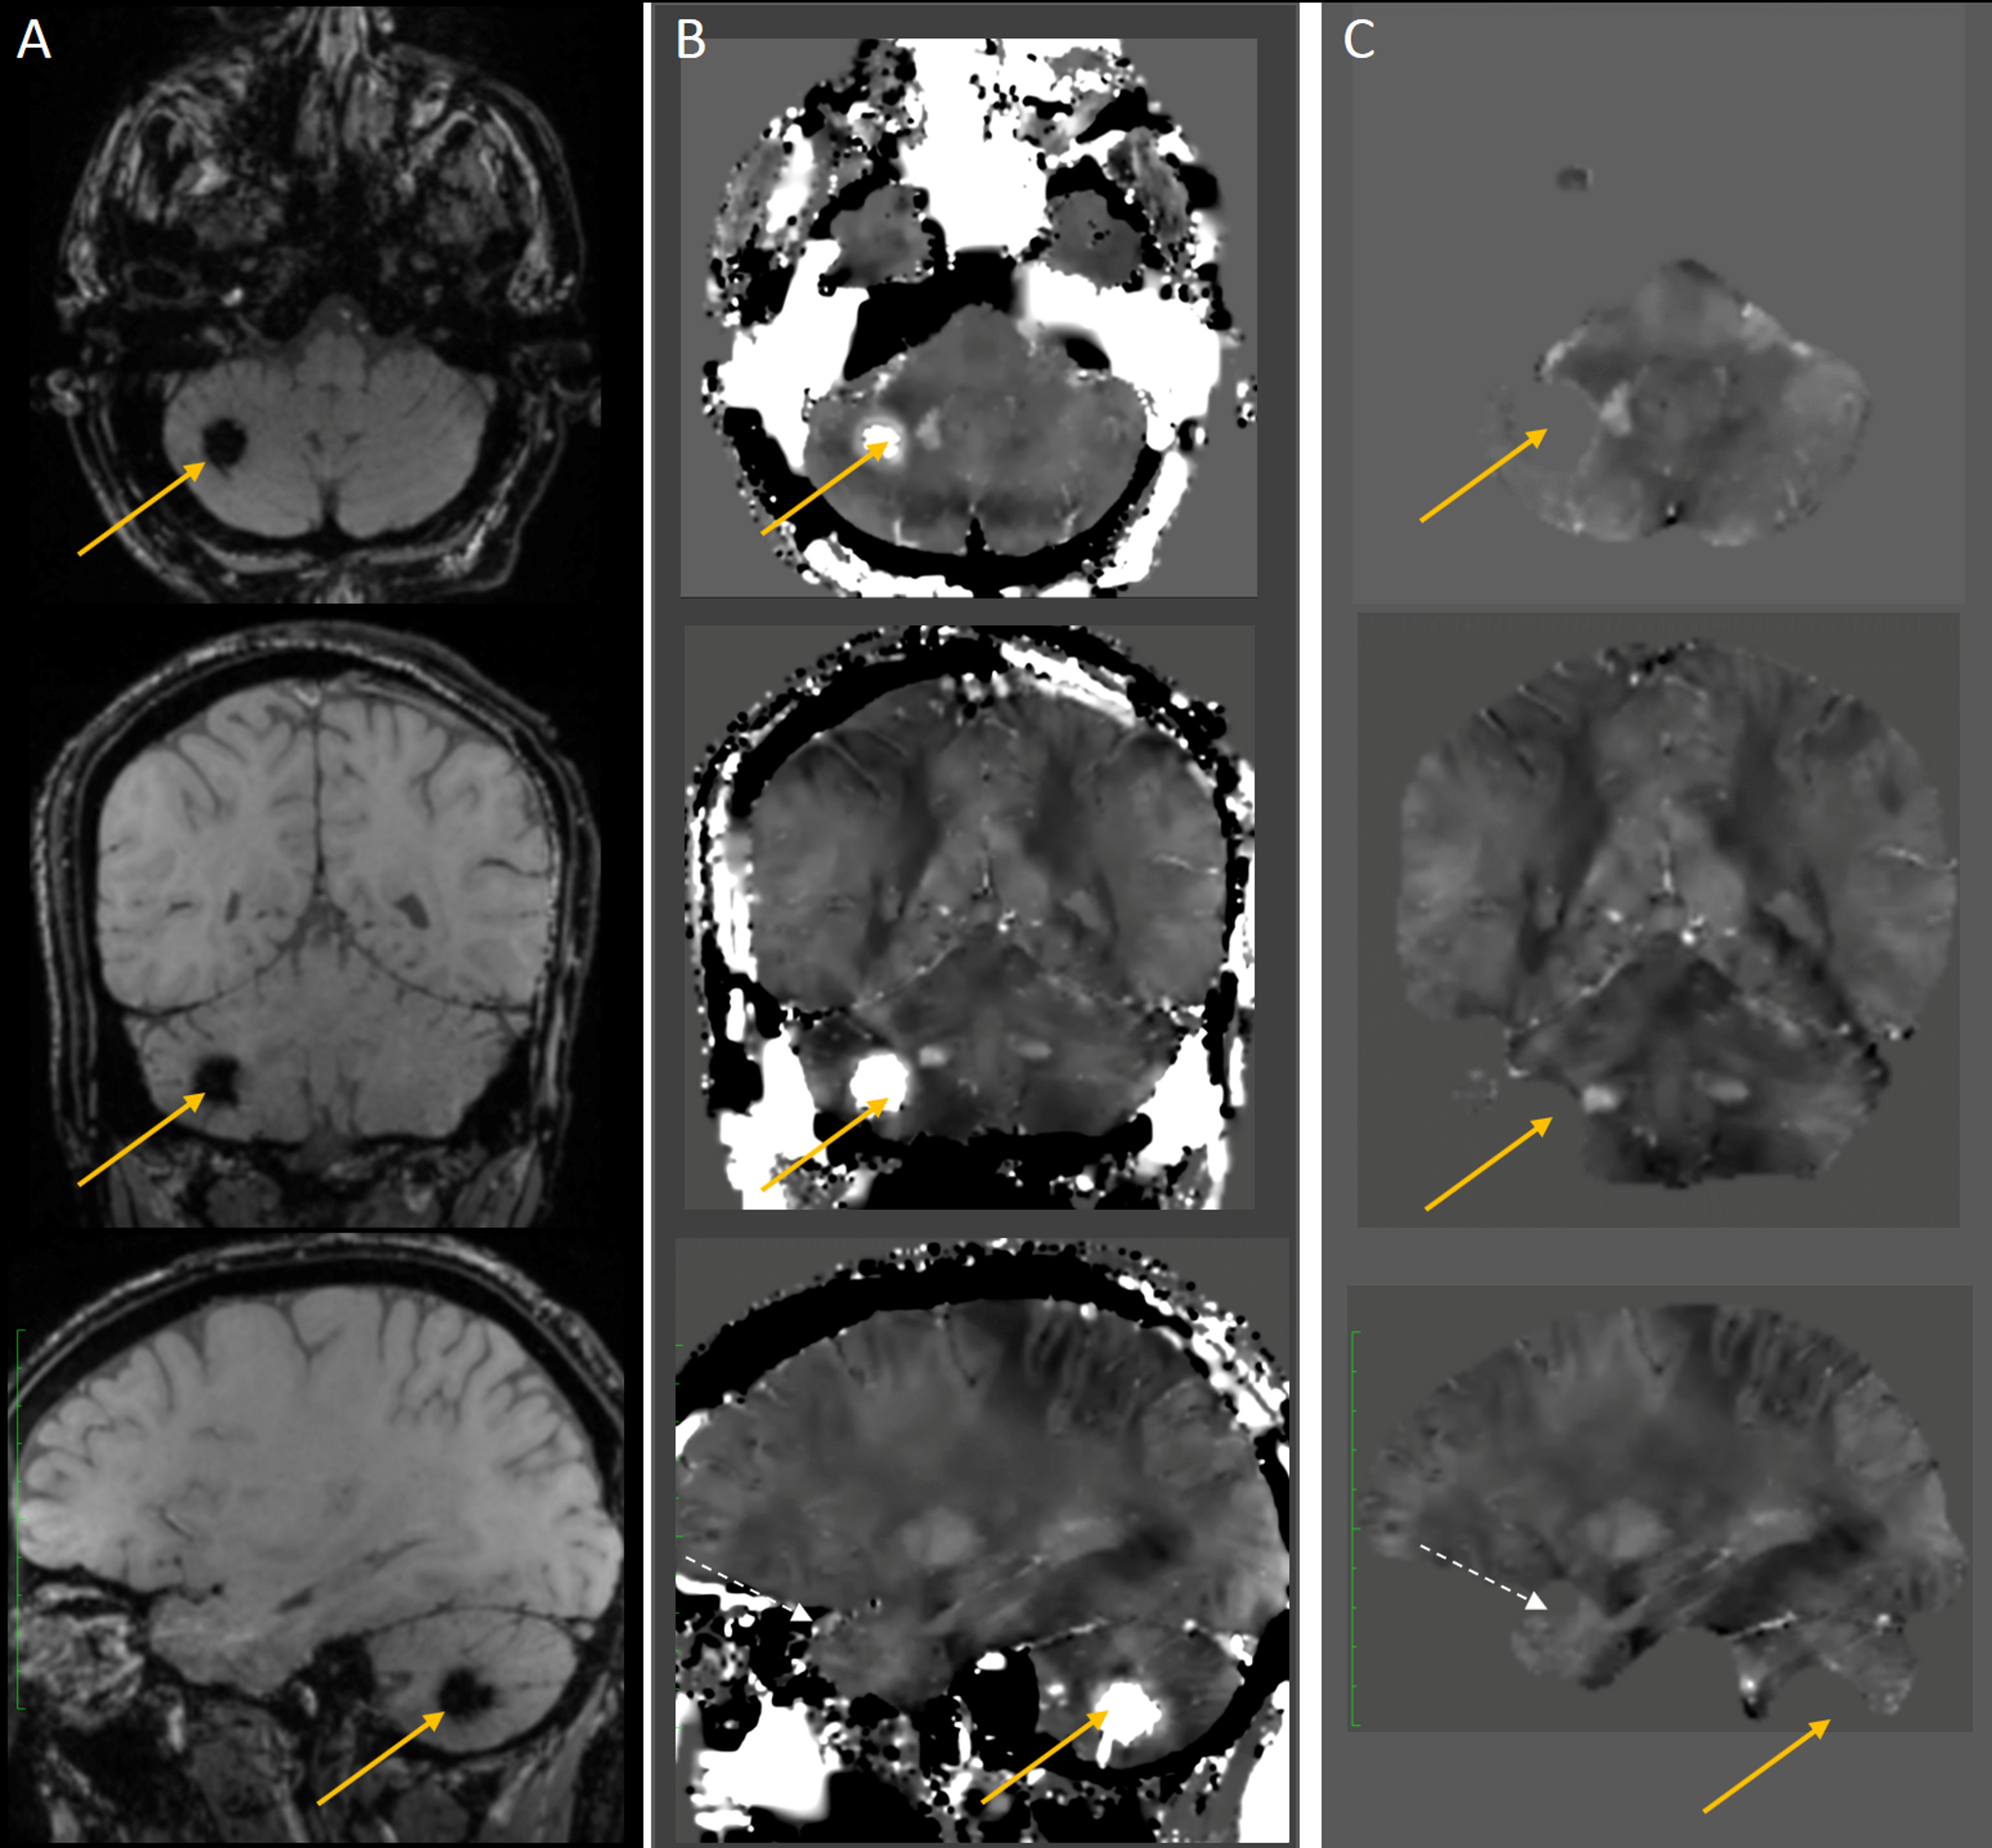
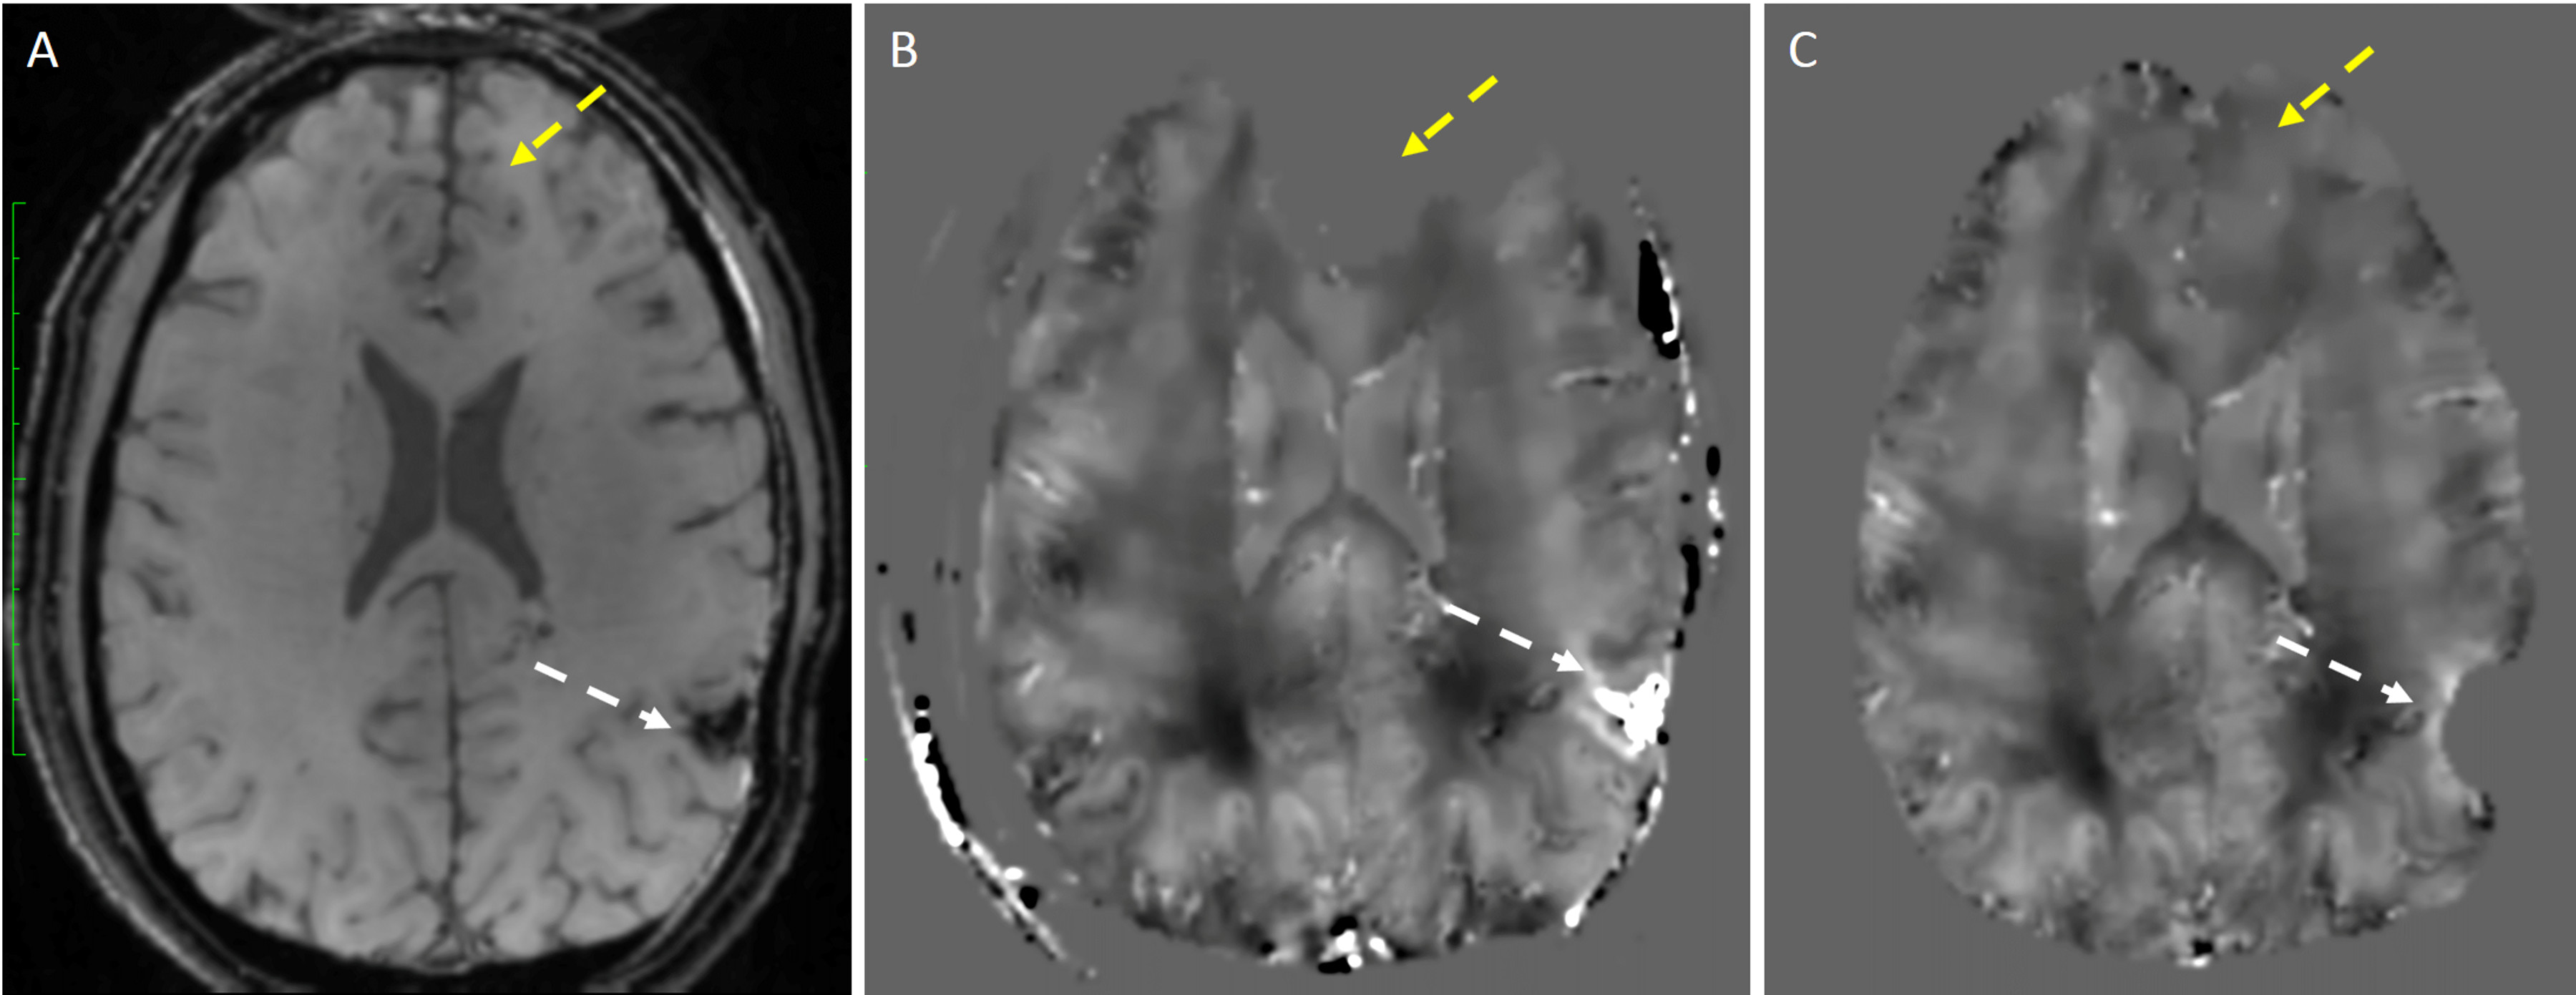
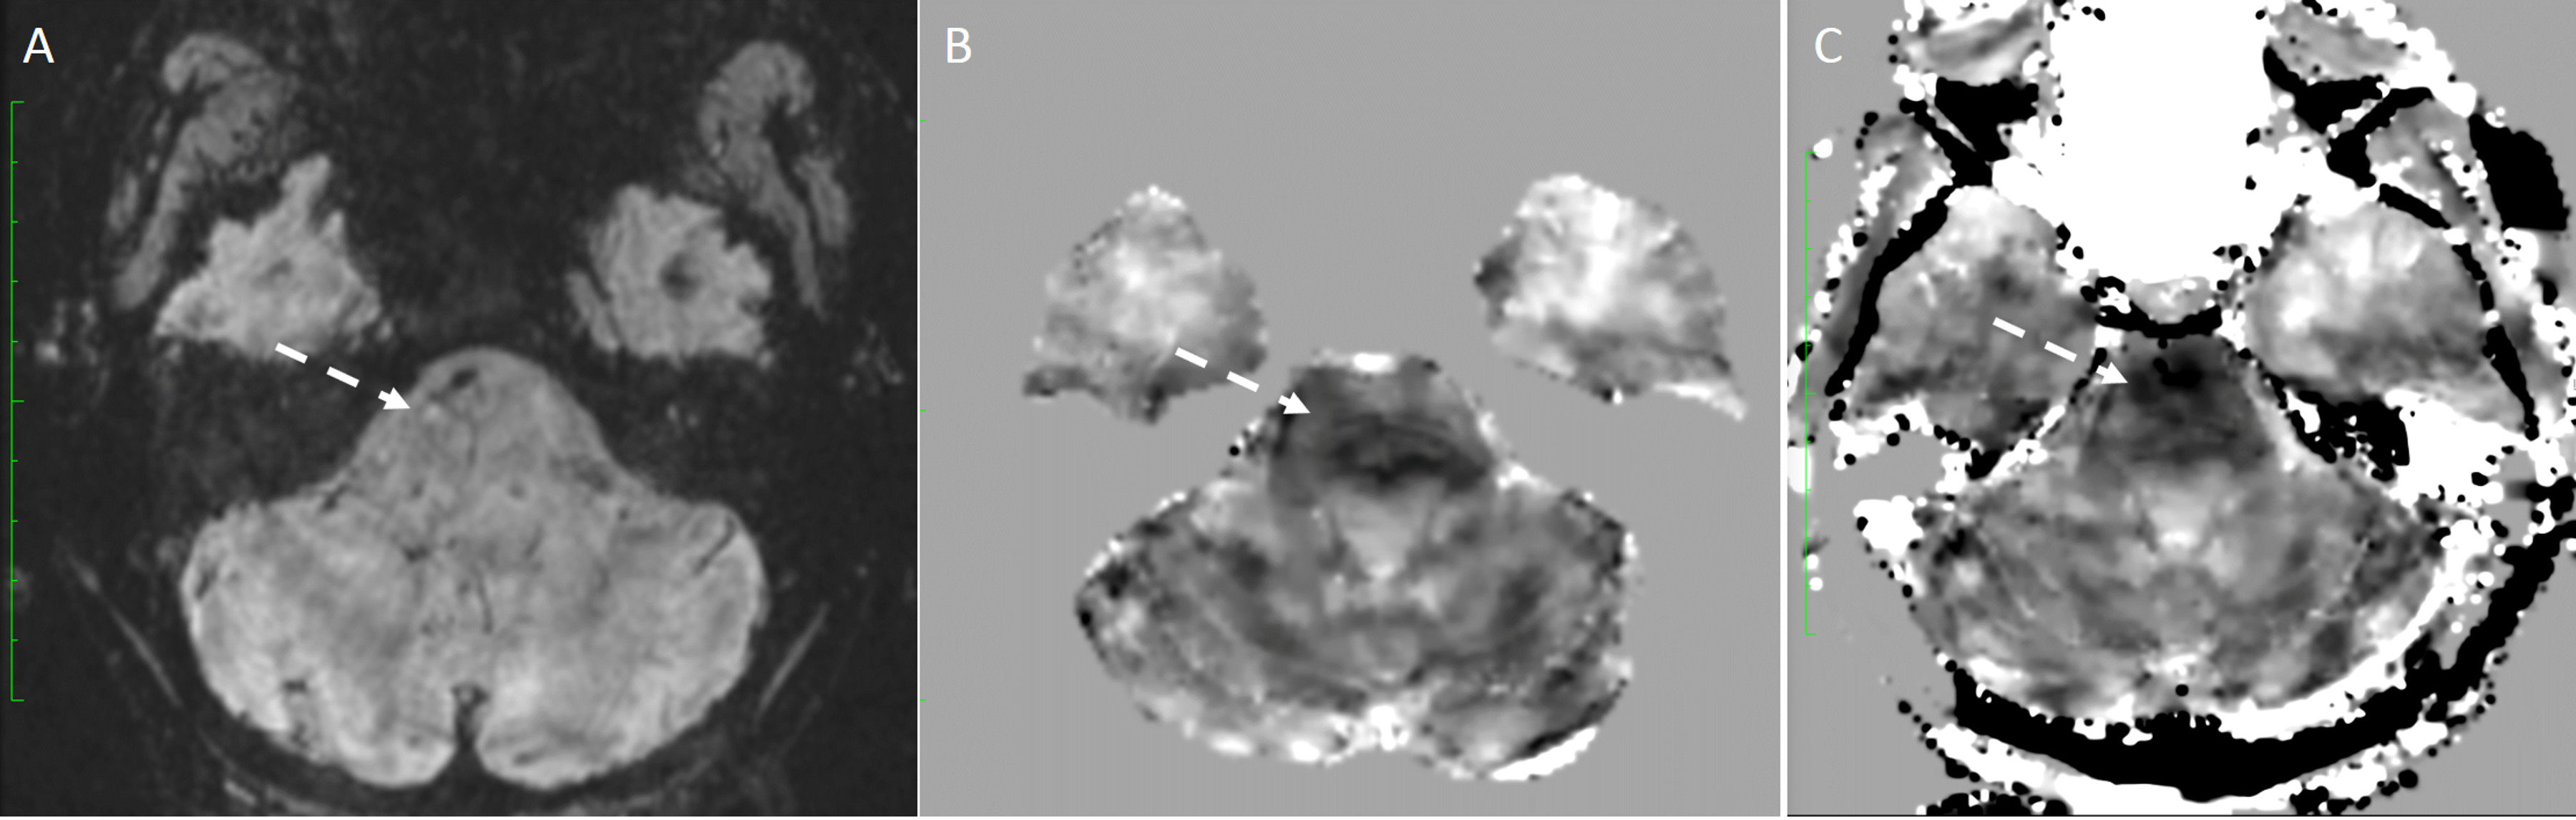
85 adult subjects were recruited, 63 subjects underwent 3DMSME imaging, and 56 subjects (44 tbi, 12 non tbi) had MEDI and TFI QSM images produced. 10 Subjects demonstrated blood or blood products (all had TBI), in the occipital, temporal, parietal or frontal lobes, basal ganglia or cerebellum (Figure 1-3). All of these lesions were visible on TFI QSM, while 6 of these lesions were not visible or less conspicuous on MEDI QSM. 30 subjects (53%) demonstrated brain parenchyma and / or lesions which were visible on TFI but were not included in the brain tissue on MEDI. 1 subject demonstrated less frontal brain parenchyma on TFI than MEDI (Figure 3). 5 subjects demonstrated worse artifacts on TFI than MEDI, primarily in the region of the pons (Figure 4).DISCUSSION
While QSM imaging can image subtle brain lesions independent of field strength and echo time, it often result in artifacts that distort normal brain tissues and can result in non-visualization of lesions. Our work demonstrated TFI based QSM, which doesn’t require brain masking, can preserve a greater amount of normal brain parenchyma and depict more lesions than non TFI based QSM methods. Furthermore, the greater preservation of anatomic landmarks, such as skull margins, has the potential to greatly aid clinical interpretation of QSM images.CONCLUSION
TFI based QSM imaging has the potential to greatly improve the depiction of normal and pathological tissues and advance the acceptance of QSM imaging for evaluating subtle brain injury, as can be seen in TBI.Acknowledgements
The authors acknowledge the support of Drs. G. Zaharchuk, J.W. Ashford, P. Masaband, C. Langkamer, B. Bilgic, and the War Related Illness and Injury Study Center for this work.References
1. Sosin DM, Sniezek JE, Thurman DJ. Incidence of mild and moderate brain injury in the United States, 1991. Brain Inj 1996;10(1):47-54. '
2. Xi G, Keep RF, Hoff JT. Mechanisms of brain injury after intracerebral haemorrhage. Lancet Neurol 2006;5(1):53-63.
3. Greenberg SM, Vernooij MW, Cordonnier C, Viswanathan A, Al-Shahi Salman R, Warach S, et al. Cerebral microbleeds: a guide to detection and interpretation. Lancet Neurol 2009;8(2):165-74.
4. Haacke EM, Xu Y, Cheng YC, Reichenbach JR. Susceptibility weighted imaging (SWI). Magn Reson Med 2004;52(3):612-8.
5. Liu T, Surapaneni K, Lou M, Cheng L, Spincemaille P, Wang Y. Cerebral microbleeds: burden assessment by using quantitative susceptibility mapping. Radiology 2012;262(1):269-78.
6. Haacke EM, Tang J, Neelavalli J, Cheng YC. Susceptibility mapping as a means to visualize veins and quantify oxygen saturation. J Magn Reson Imaging 2010;32(3):663-76.
7. Liu T, Xu W, Spincemaille P, Avestimehr AS, Wang Y. Accuracy of the morphology enabled dipole inversion (MEDI) algorithm for quantitative susceptibility mapping in MRI. IEEE Trans Med Imaging 2012;31(3):816-24.
8. Schweser F, Sommer K, Deistung A, Reichenbach JR. Quantitative susceptibility mapping for investigating subtle susceptibility variations in the human brain. Neuroimage 2012;62(3):2083-100.
9. Neelavalli J, Cheng YC, Jiang J, Haacke EM. Removing background phase variations in susceptibility-weighted imaging using a fast, forward-field calculation. J Magn Reson Imaging 2009;29(4):937-48.
10. Schweser F, Deistung A, Lehr BW, Reichenbach JR. Differentiation between diamagnetic and paramagnetic cerebral lesions based on magnetic susceptibility mapping. Med Phys 2010;37(10):5165-78. 11. Wang Y, Liu T. Quantitative susceptibility mapping (QSM): Decoding MRI data for a tissue magnetic biomarker. Magn Reson Med 2015;73(1):82-101.
12. de Rochefort L, Liu T, Kressler B, Liu J, Spincemaille P, Lebon V, et al. Quantitative susceptibility map reconstruction from MR phase data using bayesian regularization: validation and application to brain imaging. Magn Reson Med 2010;63(1):194-206.
13. de Rochefort L, Nguyen T, Brown R, Spincemaille P, Choi G, Weinsaft J, et al. In vivo quantification of contrast agent concentration using the induced magnetic field for time-resolved arterial input function measurement with MRI. Med Phys 2008;35(12):5328-39.
14. Wu B, Li W, Guidon A, Liu C. Whole brain susceptibility mapping using compressed sensing. Magn Reson Med 2012;67(1):137-47.
15. Liu J, Liu T, de Rochefort L, Ledoux J, Khalidov I, Chen W, et al. Morphology enabled dipole inversion for quantitative susceptibility mapping using structural consistency between the magnitude image and the susceptibility map. Neuroimage 2012;59(3):2560-8.
16. Liu Z, Kee Y, Zhou D, Wang Y, Spincemaille P. Preconditioned total field inversion (TFI) method for quantitative susceptibility mapping. Magn Reson Med 2016.
Figures